
Figure 1
Structure of the MuVGM dataset. Right arrows indicate grouped fields, while bullets indicate leaf‑level attributes. Pseudo‑labelled data are indicated by annotations.
| MuVGM Dataset Structure |
|---|
| Console |
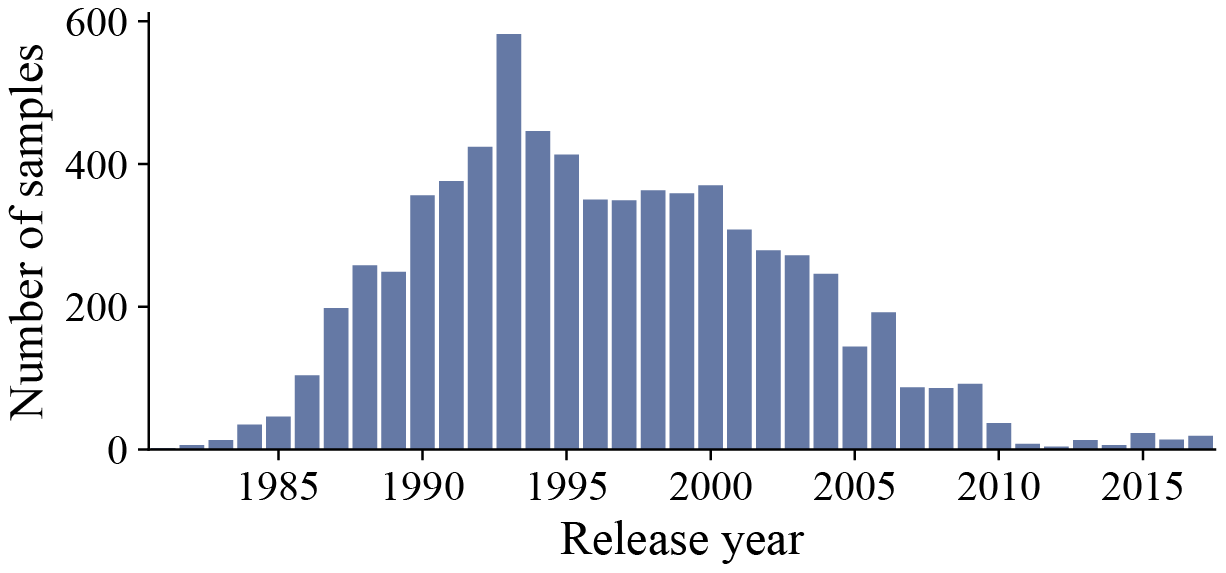
Figure 2
Temporal coverage of samples in MuVGM.
Table 1
The 10 most frequent musical characteristics and emotional palette tags in MuVGM.
| Musical tags | Emotional tags | ||
|---|---|---|---|
| Tag | Count | Tag | Count |
| arpeggiated | 3,677 | triumphant | 3,390 |
| chiptune | 3,600 | playful | 3,388 |
| electronic | 2,770 | urgent | 2,750 |
| synthesised | 1,960 | cheerful | 2,032 |
| major | 1,955 | adventurous | 2,025 |
| 8‑bit | 1,620 | exhilarating | 1,837 |
| orchestral | 1,261 | exuberant | 1,522 |
| syncopated | 1,069 | intense | 1,399 |
| square‑wave | 1,028 | optimistic | 1,171 |
| staccato | 935 | heroic | 1,141 |
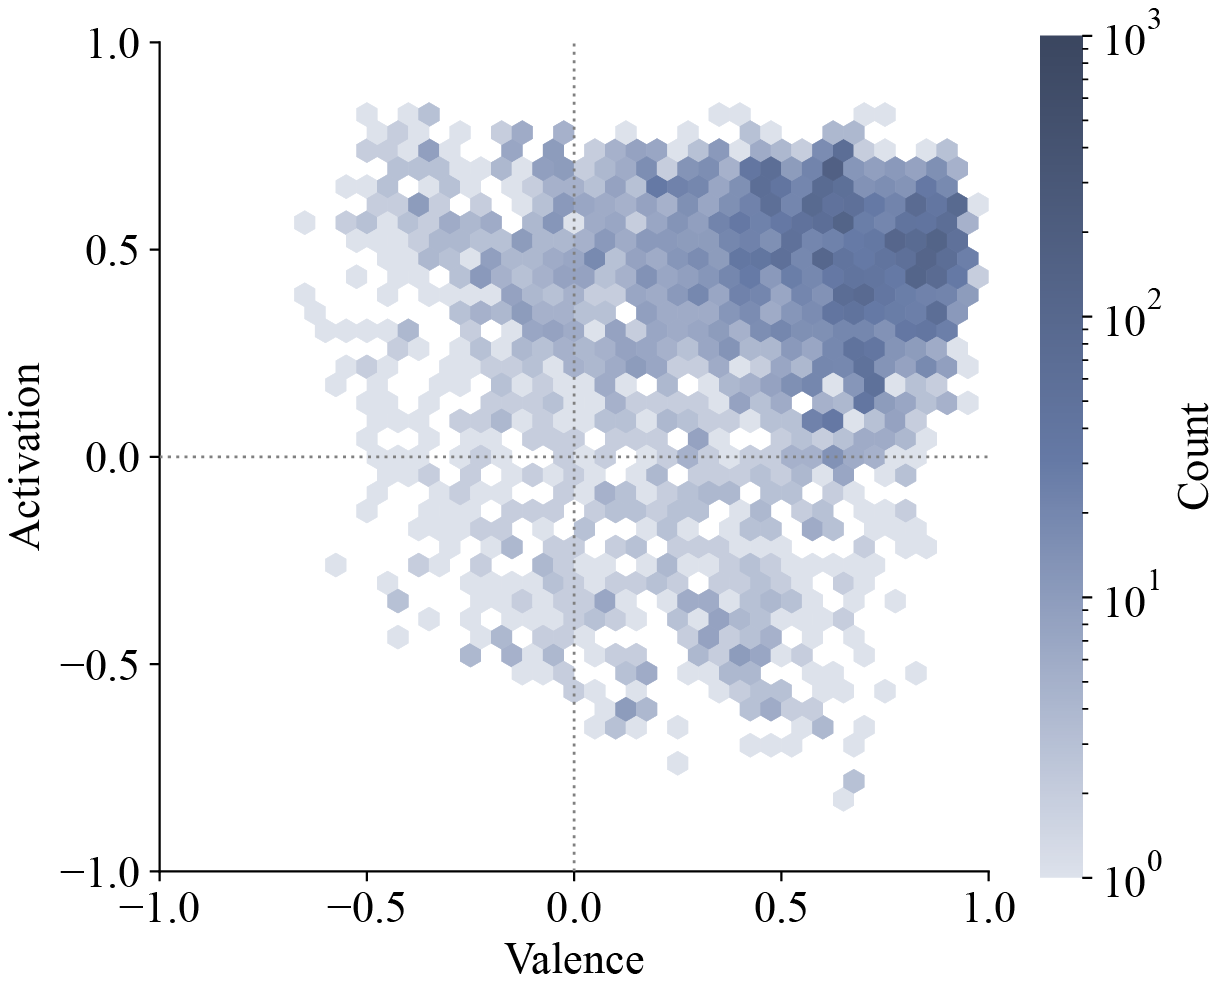
Figure 3
Distribution of valence‑activation labels in MuVGM. Hexagonal binning is used to visualise label density, with colour intensity indicating the logarithm of the number of samples per bin.
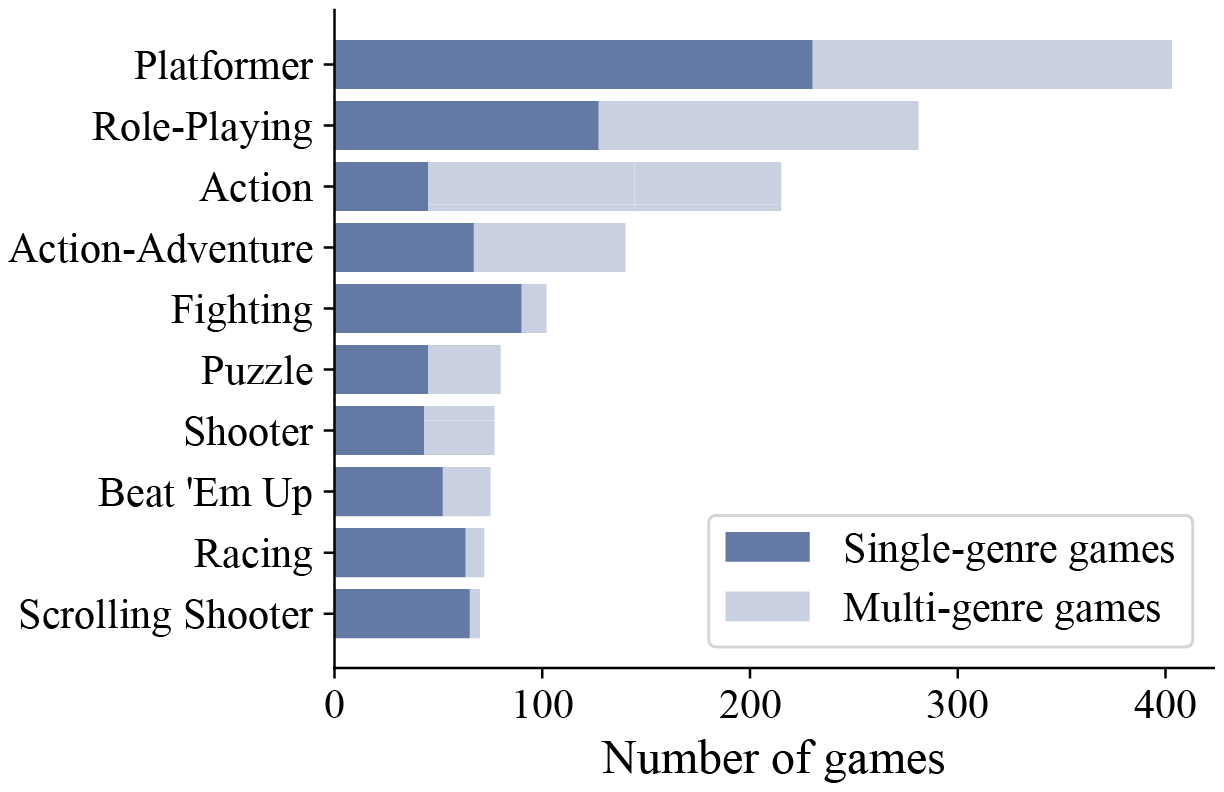
Figure 4
Top 10 most frequent genres in MuVGM.
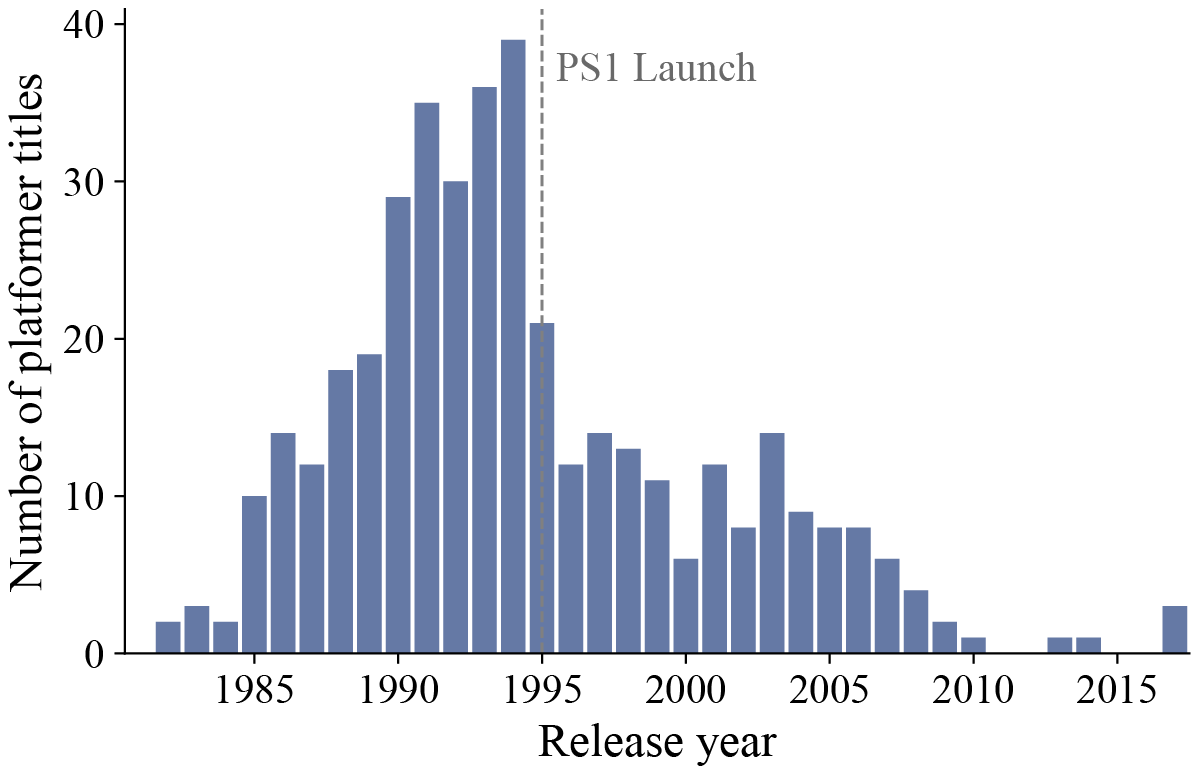
Figure 5
Frequency of platformer games over time.
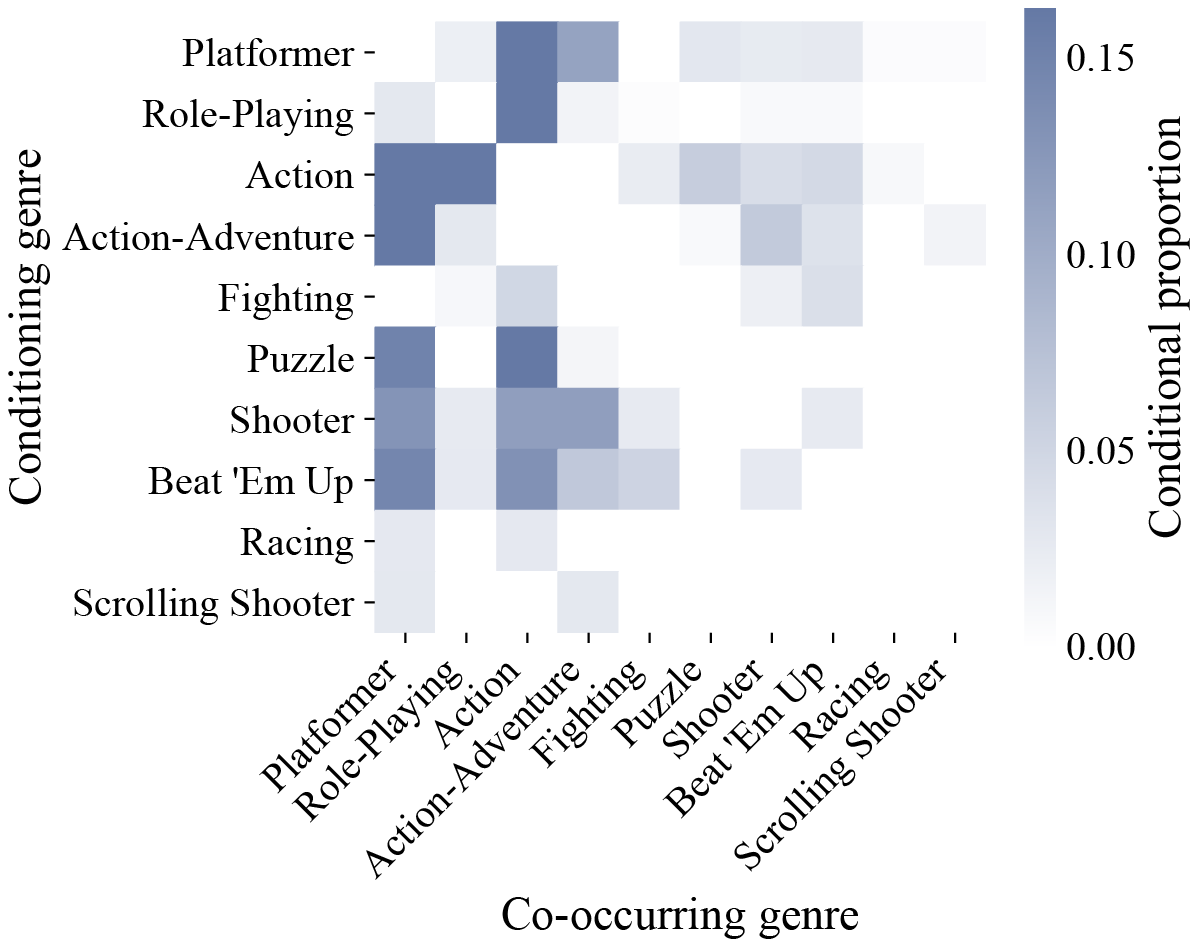
Figure 6
Row‑normalised genre co‑occurrence matrix of the 10 most frequent genres in MuVGM.
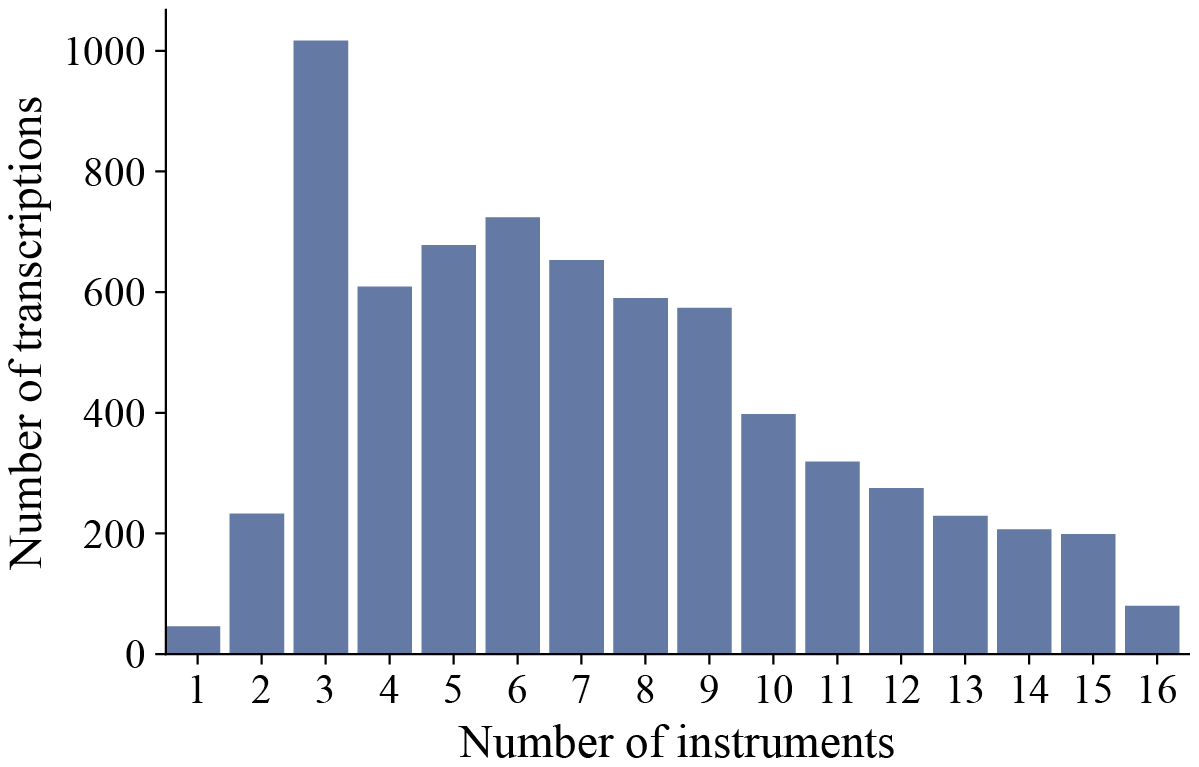
Figure 7
Distribution of instrument density counts across transcriptions (95th percentile).
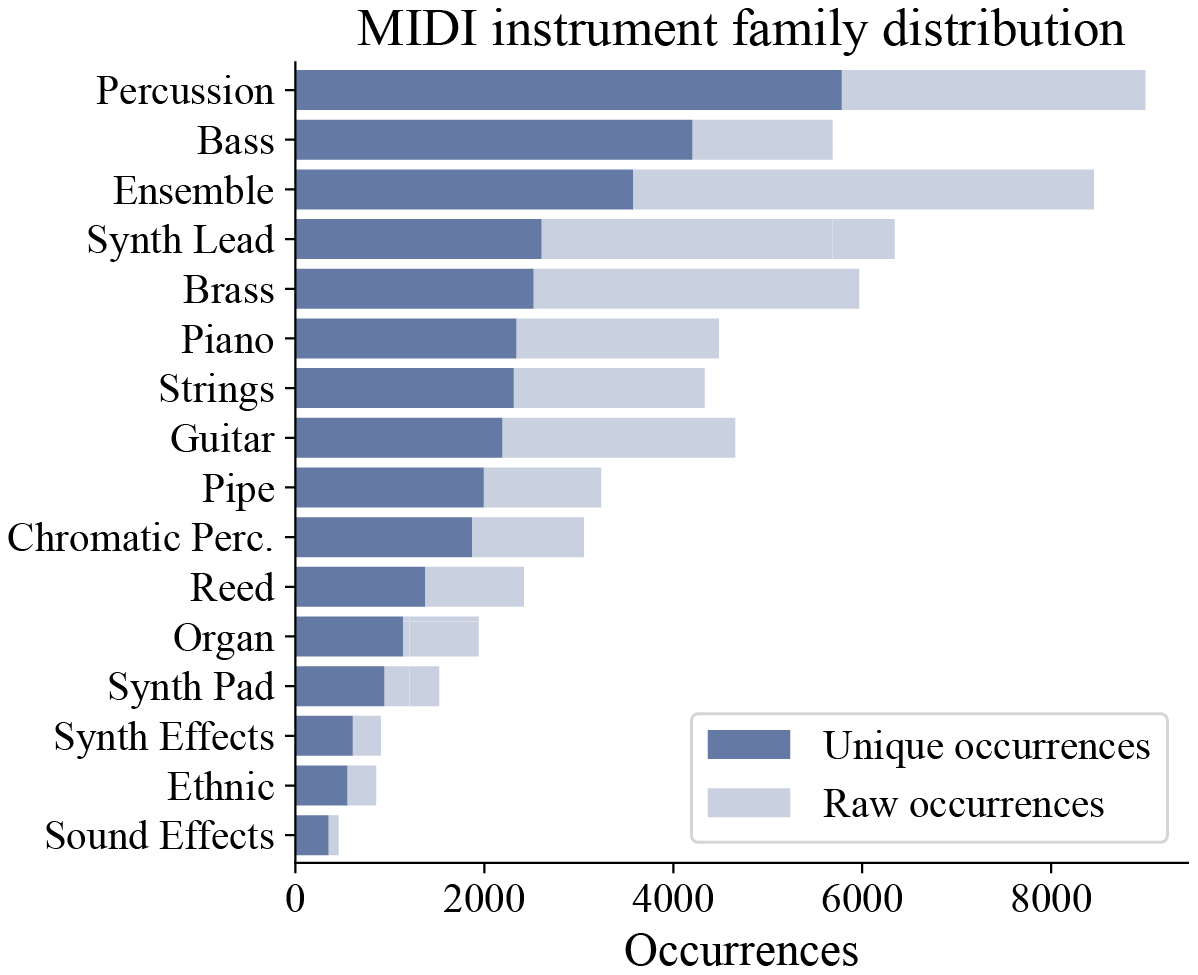
Figure 8
Distribution of instrument families.
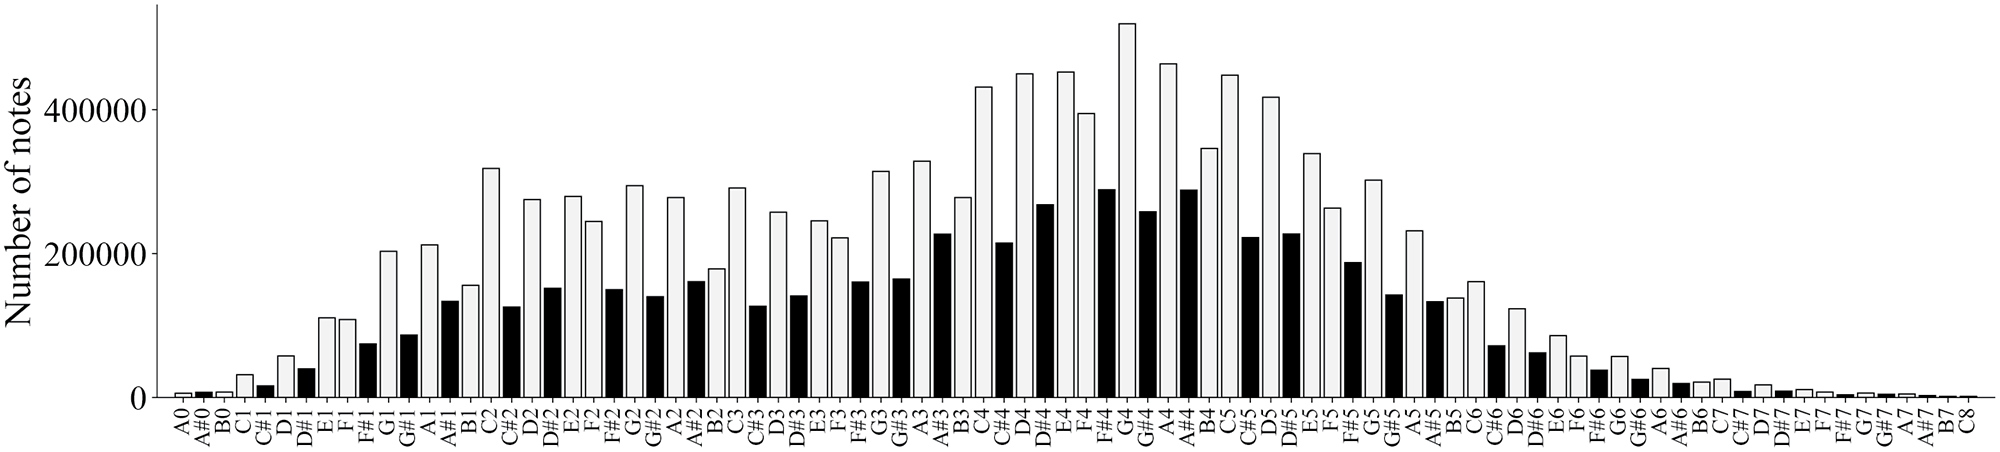
Figure 9
Pitch histogram of symbolic note events in MuVGM (drum tracks excluded).
Table 2
Cosine similarity between rendered MIDI audio and paired original audio in MuVGM.
| Metric | Feature Focus | Mean Sim. | Std |
|---|---|---|---|
| MFCC | Timbre and Texture | 0.8954 | 0.1411 |
| Chroma | Pitch and Harmony | 0.7790 | 0.1132 |
| CLAP | Semantic Identity | 0.7019 | 0.1792 |
Table 3
Summary of the features extracted for each modality and used in the exploratory analyses.
| Modality | Extracted Features |
|---|---|
| Symbolic (MIDI) | Duration; note count; track count; unique instrument count; mean polyphony; note density; IOI std; pitch (mean, range, entropy); velocity (mean, std, entropy); mean tempo. |
| Audio (Original) | Duration; RMS energy (mean, std); spectral centroid (mean, std); spectral bandwidth (mean, std); zero‑crossing rate; MFCCs 1–13. |
| Visual (Box Art) | Aspect ratio; colour statistics (mean and std of hue, saturation, and brightness); colourfulness; contrast; image entropy; edge density. |
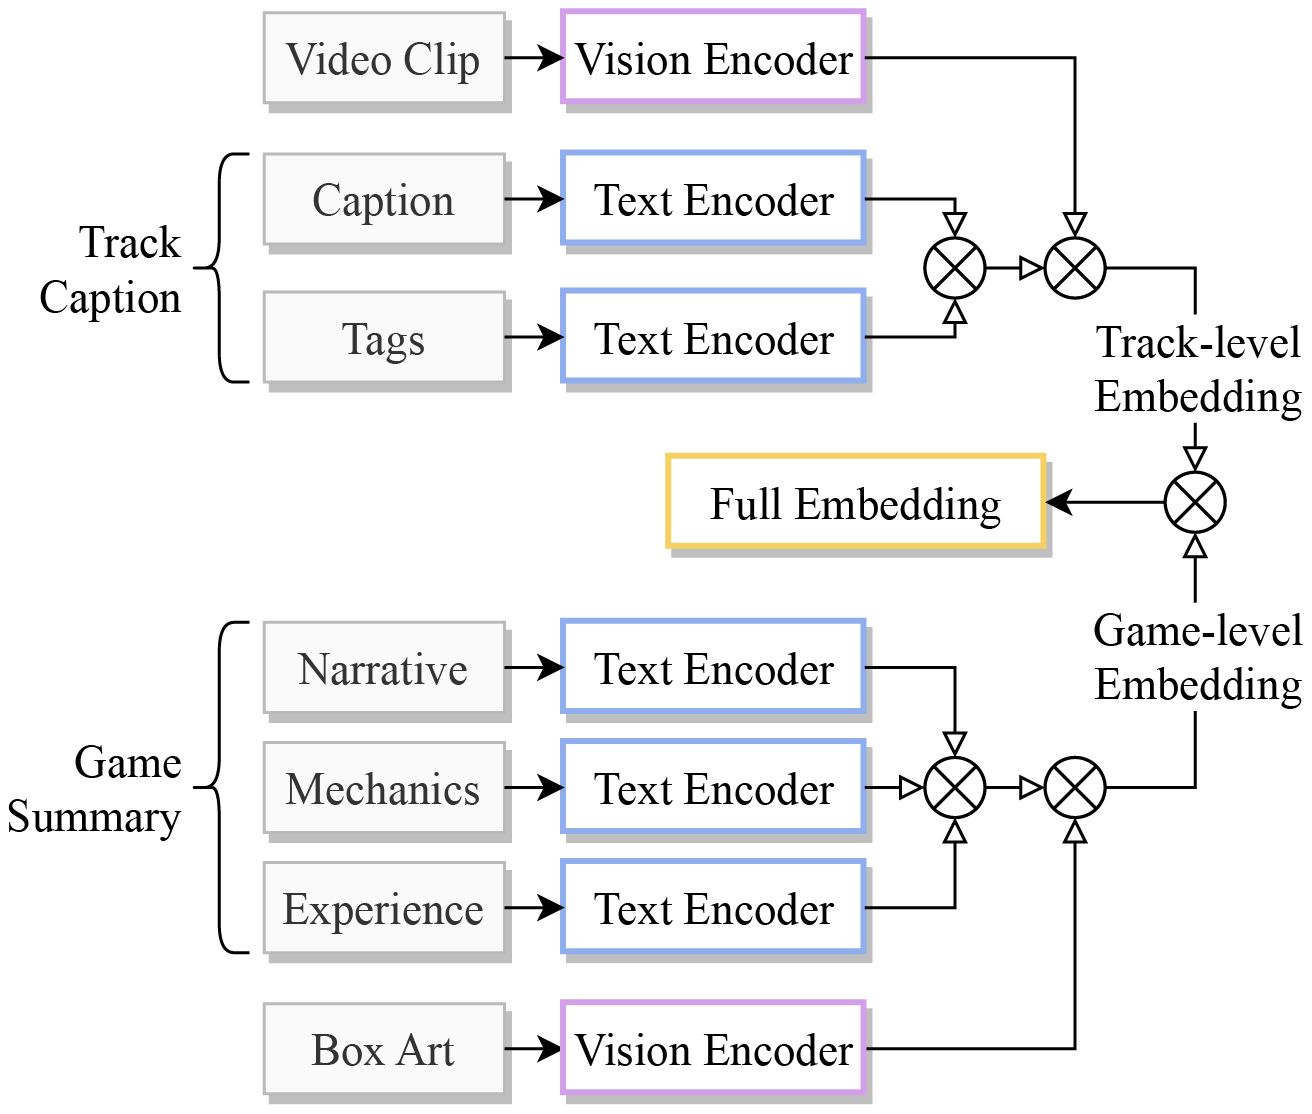
Figure 10
Multimodal embeddings constructed via late fusion. Each part is encoded independently and combined in embedding space, with fusion nodes () indicating a local mean aggregation with L2 normalisation over connected inputs.
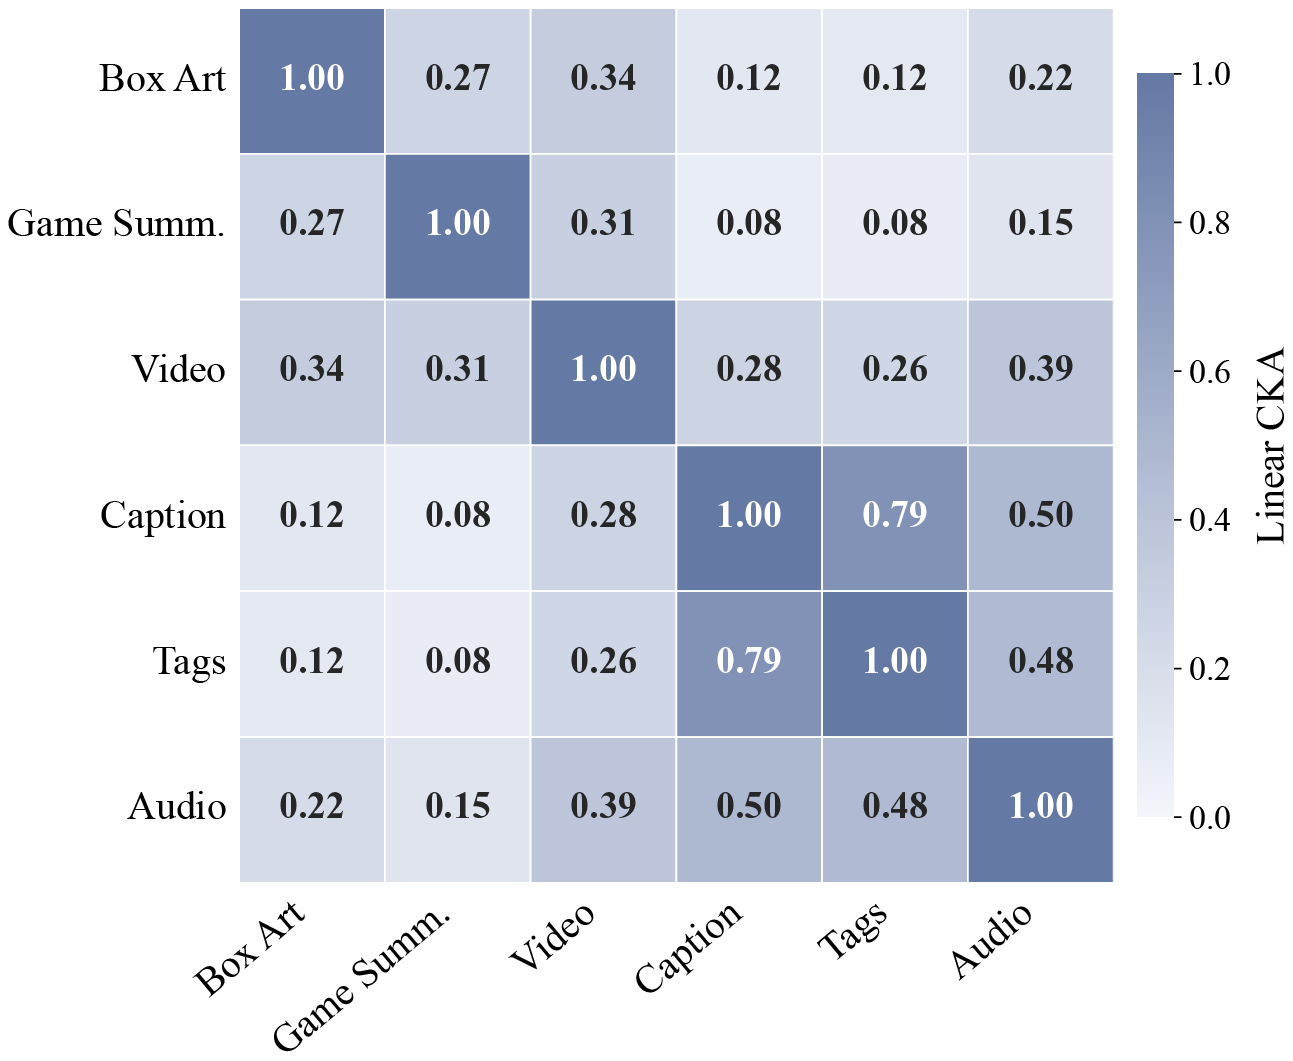
Figure 11
Pairwise linear CKA between modality embeddings in the ImageBind space.
Table 4
Crossmodal music retrieval performance under random ranking, zero‑shot cosine similarity, and learned bi‑encoder retrieval. R@ is the probability that the correct audio is in the top‑ retrieved candidates. Bi‑encoder results: mean std over 5 folds. Bold indicates the best result for each pool size and metric.
| Pool | Random | Zero‑Shot | Bi‑Encoder (5‑Fold) | ||||||
|---|---|---|---|---|---|---|---|---|---|
| R@1 | R@5 | R@10 | R@1 | R@5 | R@10 | R@1 | R@5 | R@10 | |
| 50 | 0.0200 | 0.1000 | 0.2000 | 0.2343 | 0.5545 | 0.7220 | 0.5255 0.0226 | 0.8674 0.0187 | 0.9496 0.0115 |
| 200 | 0.0050 | 0.0250 | 0.0500 | 0.1125 | 0.2951 | 0.4235 | 0.3162 0.0235 | 0.6308 0.0322 | 0.7729 0.0278 |
| 500 | 0.0020 | 0.0100 | 0.0200 | 0.0634 | 0.1842 | 0.2700 | 0.2122 0.0219 | 0.4647 0.0347 | 0.6040 0.0364 |
| 1000 | 0.0010 | 0.0050 | 0.0100 | 0.0425 | 0.1205 | 0.1866 | 0.1521 0.0159 | 0.3487 0.0320 | 0.4697 0.0334 |
Table 5
Weight ablation study for zero‑shot retrieval at pool size 200 comparing the relative contributions of the track‑level and game‑level context. Bold indicates the best result for each metric.
| Query Composition | R@1 | R@5 | R@10 |
|---|---|---|---|
| Track only (1.0/0.0) | 0.0941 | 0.2721 | 0.3873 |
| Game only (0.0/1.0) | 0.0801 | 0.2073 | 0.2957 |
| Track + Game (0.5/0.5) | 0.1125 | 0.2951 | 0.4235 |
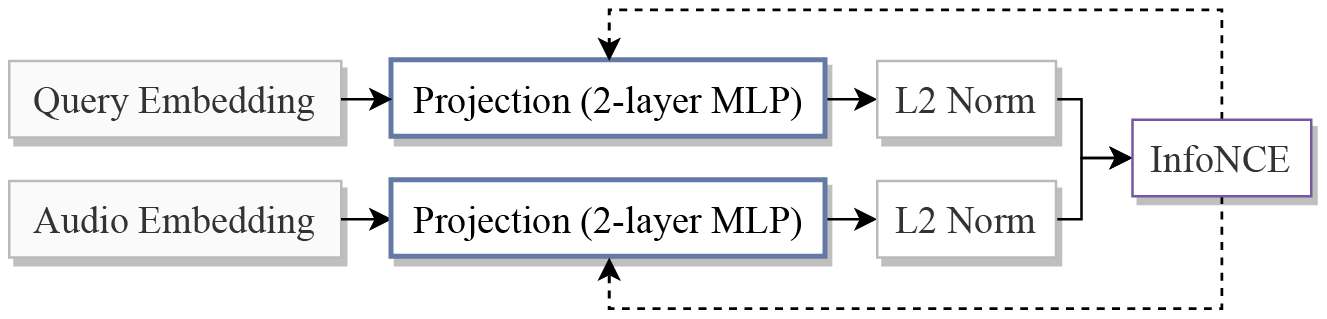
Figure 12
Bi‑encoder architecture for learned crossmodal retrieval.
Table 6
Genre classification performance.
| Metric | Mean Std |
|---|---|
| Micro F1 | 0.6582 0.0403 |
| Macro F1 | 0.4897 0.0427 |
| Micro Precision | 0.6899 0.0567 |
| Micro Recall | 0.6306 0.0361 |