
1 Introduction
Recent years have seen a rapid shift in AI research towards multimodal understanding. The field has moved from large language models to large multimodal models, such as GPT 5.51 and Gemini 3.1 Pro,2 that process vision, language, and audio together in unified representation spaces. Music modelling has been slower to follow this trajectory. Much of the field remains organised around single modalities or tightly defined modal pairs, as in source separation or optical music recognition, respectively. Recent work in generative music (e.g., Tian et al., 2025) suggests that interest in richer multimodal modelling is growing, but the resources needed to support this work are still emerging.
Existing multimodal music datasets reflect this narrowness (see Section 2.4). Relationships between music and broader non‑musical contexts are often diffuse and loosely defined, so datasets focus on mechanical or descriptive relationships (performance with notation, audio with captions, video with audio) rather than contextual ones. In recent generative work, modal alignment has been achieved through embedding similarity, pairing samples by proximity in a shared semantic space (Rinaldi et al., 2025). As a consequence, these associations tend to express coincidental resemblance or perceptual metaphors (e.g., visual warmth timbral warmth) rather than compositional intent. The music sounds like a scene but was not composed for it.
Video game music is a notable exception to this, as it is composed for specific visual environments, narrative contexts, and gameplay mechanics that live in directly observable spaces. These environments provide explicit functional frameworks within which musical decisions are made, whether to elicit specific emotions, reinforce characters or places, or strengthen thematic coherence across modalities (Collins, 2008). This makes video games an unusually well‑suited domain for studying multimodal music understanding.
Despite this, large‑scale datasets that situate game music within its full multimodal context remain scarce. Existing collections are narrow, typically confined to pairings such as Video–MIDI or Audio–MIDI alignment (Section 2.5). These are valuable resources, but none brings the full range of modalities together into a single, cohesive dataset. To address this gap, we introduce MuVGM, a hierarchical dataset that pairs symbolic transcriptions with reference audio, gameplay video excerpts, box art imagery, textual descriptions, audio captions, affective annotations, and metadata for 7,129 tracks3 from 1,484 games across 39 consoles.
2 Related Work
In this section, we review prior work on multimodal music datasets, with a particular focus on the representational assumptions that motivate the design of MuVGM. Across musicology, music psychology, and music technology, the term ‘multimodal’ is applied inconsistently (Christodoulou et al., 2024): it may denote a human sensory channel (vision, audition) or a computational data type (audio, symbolic notation, video, text). We adopt the latter, and following Li et al. (2026), we treat audio and symbolic notation as distinct modalities rather than interchangeable renderings of ‘music’. We use ‘multimodal’ for any dataset or task combining two or more data modalities and ‘bimodal’ for cases involving exactly two. In bimodal datasets, we use em‑dash pairs to denote the mutual presence of modalities rather than directionality. Genuinely multimodal music datasets remain rare, and comprehensive ones are rarer still.
2.1 Language and music
The most common bimodal music datasets pair audio recordings with natural language descriptions. AudioCaps (Kim et al., 2019) and MusicCaps (Agostinelli et al., 2023) are canonical examples, pairing short audio clips with human‑generated captions, while LP‑MusicCaps (Doh et al., 2023) and MuLaMCap (Huang et al., 2023) extend this through pseudo‑captioning, using LLMs to annotate large unlabeled corpora. In the symbolic domain, BUTTER (Zhang et al., 2020) and MuseCoco (Lu et al., 2023) train on bespoke text–MIDI pairs, offering greater structural transparency at the cost of perceptual richness, and MidiCaps (Melechovsky et al., 2024) applies the same pseudo‑captioning strategy to annotate MIDI data. In all cases, alignment is mediated entirely through language.
2.2 Images and music
Datasets that pair images with music are comparatively rare and are typically built using one of three strategies: semantic embedding similarity, affective alignment, or explicit structural correspondence. Art2Mus (Rinaldi et al., 2025) exemplifies the first, pairing artworks with music via cosine similarity in a shared ImageBind space; MuIm (Ullah and Choi, 2024) exemplifies the second, adding Mahalanobis distance in valence‑arousal space for pairs that are both semantically and affectively aligned; and structural‑correspondence datasets, such as those for contour‑based melody generation (see Liang and Wang, 2024; Namgyal et al., 2022), tend to be small and task‑specific. In each case, the pairing strategy bounds what a model can learn: affective pairings yield affective generalisation, and structural pairings yield structural ones.
2.3 Video and music
Pairing music with video introduces a temporal axis absent from static image work, along which musical events can be aligned. In performance reconstruction, Foley Music (Gan et al., 2020) and MI‑Net (Su et al., 2020) generate MIDI from skeletal pose features, evaluated on performance‑video corpora such as MUSIC (Li et al., 2019), URMP (Zhao et al., 2018), and Solos (Montesinos et al., 2020). Dance‑accompaniment datasets used by D2M‑GAN (Zhu et al., 2022) and RhythmicNet (Su et al., 2021) encode movement trajectories alongside rhythmically annotated music for beat‑level synchronisation, while background‑scoring datasets used by CMT (Di et al., 2021) and V‑MusProd (Kai and Xing, 2024) favour narrative alignment. LORIS (Yu et al., 2023) introduces a large‑scale bespoke dataset for sports such as figure skating and dance. Because video often carries music, or at least sound, naturally co‑occurring video–music pairs are abundant across film, television, and online video, giving this sub‑field a data advantage that static image–music research lacks.
2.4 Three or more modalities
Datasets combining three or more modalities are considerably rarer than their bimodal counterparts, owing to the difficulty of aligning heterogeneous data at scale. Li et al. (2026) survey this landscape from a generative viewpoint, while Christodoulou et al. (2024) and Gotham et al. (2025) approach it via analysis and retrieval; a recurring observation across all three is that scale and modality coverage rarely coincide. One of the earliest such efforts, SLAC (McKay and Fujinaga, 2008), paired 250 pieces across symbolic, audio, lyrical, and cultural modalities, though its scale remains modest by current standards. For instance, the Million Song Dataset (MSD) (Bertin‑Mahieux et al., 2011) provides audio features and metadata for one million songs, but its multimodal status comes almost entirely from later work built on top of it: MuMu adds roughly 31,000 album covers and customer reviews (Oramas et al., 2018), and LMD‑aligned matches 45,000 MIDI files to samples in MSD (Raffel, 2016).
By contrast, datasets designed for multimodality from the outset are smaller but more tightly integrated and fall into two kinds. The first treats the modalities as synchronised representations of one piece: DALI (Meseguer‑Brocal et al., 2020) aligns audio with vocal‑melody notes and lyrics, and MTD (Zalkow et al., 2020) links sheet‑music images, symbolic encodings, and audio snippets. Alignment is exact, but no external signal conditions the musical content. The second kind adds an external signal such as an image, video, or text: MuMu‑LLaMA (Liu et al., 2026) pairs AudioSet clips with vision‑language captions, V2Meow (Su et al., 2024) and Diff‑BGM (Li et al., 2024) draw pairs from music videos, M2M‑Gen (Sharma et al., 2026) scores manga with GPT‑4o, and XMusic (Tian et al., 2025) conditions on images, video, tags, text, and humming by first mapping each to inferred musical attributes. In each case, the music is matched to a context for which it was not composed, associating samples that resemble one another rather than ones where the context informed the music’s composition.
2.5 Ludomusicological datasets
Ludomusicology, the study of game music, is a relatively young field, and its dataset landscape reflects this. The most established corpora focus on the music itself. VGMIDI (Ferreira and Whitehead, 2019) provides valence‑arousal‑annotated piano arrangements of game soundtracks; NES‑MDB (Donahue et al., 2018) provides 5,200 Nintendo Entertainment System (NES) compositions with expressive performance attributes; YM2413‑MDB (Choi et al., 2022) provides 669 FM‑synthesis renderings with multi‑label emotion tags; and SAVGM (Luo and Reiss, 2026) maps music to structural segmentations. Each combines several musical modalities (symbolic score, rendered audio, and affective labels), and these corpora have supported much of the existing work on game‑music generation. They do not, however, represent the visual, narrative, or interactive context for which the music was composed.
Fewer datasets incorporate this context, but only partially. NES‑VMDB (Cardoso et al., 2024) is the closest precedent to MuVGM, pairing NES‑MDB with short gameplay clips for video‑conditioned music generation. GameVibe (Barthet et al., 2024) instead links gameplay footage to continuous viewer‑engagement traces, aligning affective responses to audiovisual presentations. While these advance the field, they capture only the local context: the immediate on‑screen state or player behaviour. They omit the global context: the overarching narrative, thematic framing, and visual paratexts like box art. No existing corpus situates game music in its full local and global contexts across a range of games and consoles, motivating the design of MuVGM.
3 Methodology
The MuVGM dataset was created using a six‑stage pipeline that combines large‑scale web scraping with established MIR techniques, such as cover song detection and audio fingerprinting. In this section, we discuss our methodology and the systems used.
3.1 MIDI collection
In the first stage, symbolic music was collected from VGMusic.com, a public, community‑maintained repository of fan‑transcribed video game music. We chose this source for the breadth of its library and its strict editorial standards, which ensure the metadata matches each submission. Each entry is also accompanied by a standardised comment file containing the game system, game name, track name, and other metadata, which we stored alongside the downloaded MIDI in a nested dictionary for use in later stages. We then filtered the collection to remove duplicate entities and derivative variations (such as remixes, medleys, and re‑orchestrations) based on naming conventions and discarded any samples shorter than 10 seconds to remove sound effects. This stage yielded 16,844 tracks across 3,074 games.
3.2 Wikipedia matching
To validate and enrich the MIDI files from the first stage, each unique game was matched to its Wikipedia page via the MediaWiki Search API. For each game, seven template search terms generated 20 candidate pages, ranked against the existing metadata using string‑similarity scoring. Specifically, we used the difflib.SequenceMatcher ratio between candidate and query titles (case‑normalised), retaining matches above a 0.6 threshold. To accommodate naming variations, we incorporated alternate title forms and console aliases, with additional logic to select the correct entry for numbered series. Games with no confident match were discarded, which also stripped obscure and malformed entries from the pool and reduced computational cost in later stages. For each matched game, we scanned the infobox to collect genre labels, gameplay modes, release year, and box art. The genre labels were then cleaned to combine sub‑genres and standardise names. After this stage, 13,557 tracks across 2,156 games remained, yielding an 80.5% retention rate.
3.3 Original audio search
In the third stage, we attempted to recover the original audio waveform corresponding to each MIDI entry. Following previous work, YouTube served as the audio source. For each track, the track, game, and console names formed a structured search query that returned 20 candidate videos. Names were normalised prior to search, and filtering excluded derivative videos (such as remixes, covers, and compilations). As in the Wikipedia matching stage, candidates were ranked by string similarity. Ranked candidates were then downloaded, loudness‑normalised, and scored against the MIDI transcription at 32 kHz using Essentia’s cover song detection pipeline4 (, Serrà et al., 2008, 2009, 2010). To account for timbral variation between early and modern consoles, each MIDI was resynthesised with two sound fonts: 8bitsf5 and GeneralUser GS.6 The first candidate to pass a confidence threshold of 0.90 was greedily selected. To bound computation, videos over 10 minutes were skipped, and at most 10 candidates were evaluated per track. This verification reduced spurious pairings due to metadata errors, search noise, and title similarity, ensuring that the retained transcriptions plausibly matched the original audio. Tracks with no confident match were discarded. After this stage, 11,480 tracks across 1,930 games remained, yielding an 84.7% retention rate.
3.4 Gameplay video fingerprinting
In this stage, we leveraged the widespread availability of longplay7 recordings to collect short clips of the game environments corresponding to each track. Using the collected metadata, we searched YouTube with a structured query, filtered candidates by title patterns to remove non‑representative content (e.g., trailers, reviews, remakes, commentary, and speedruns), and processed the remaining shortlist sequentially, scanning up to six candidate videos per game. To locate each track within the candidate videos, we used audfprint, a landmark‑based audio fingerprinting system,8 with the original waveforms from stage three as queries, downsampled to mono at 11.025 kHz. For each query, we retained the best match (highest number of common hashes), its estimated start time, and match strength across all candidates, requiring at least 20 common hashes and greedily stopping once all queries met this threshold. Notably, longplay videos are long, often several hours or more, which can cause time aliasing in audfprint: even a generous time depth of 21 bits allows only 13.5 hours before values wrap, yielding incorrect start times. We therefore split each video longer than 13.5 hours into 12‑hour chunks and processed them in parallel. Once the stopping criterion was met, matched tracks were extracted as 20‑second excerpts at 480p, and tracks with no confident match were discarded. After this stage, 7,129 tracks across 1,484 games remained, yielding a 62.1% retention rate.
3.5 Game description generation
In the fifth stage, we augmented each game entry with structured textual descriptions to provide semantic and contextual grounding for downstream tasks. For each game, we generated three short paragraphs describing the narrative premise, gameplay mechanics, and overall player experience. Generation used Gemma 4 26B A4B9 in a retrieval‑augmented generation (RAG) pipeline, served locally via Ollama behind an Open WebUI API endpoint. The Stage‑two Wikipedia match was supplied as fixed context, after which the model generated its own search queries, retrieved relevant web documents, and incorporated the results to support factual grounding. Our system prompt instructed the model to produce three neutral, descriptive paragraphs of fixed length, constrained to a strict JSON object containing only these descriptions. Because the logged search queries and source URLs were returned by Open WebUI’s retrieval layer rather than emitted by the model, they reflect genuine, accessible sources rather than potentially hallucinated references. The model was deployed on an Nvidia A100 (40 GB), using DDGS10 as the search API.
3.6 Automatic track captioning
In the final stage, we augmented each track with natural‑language descriptions and affective annotations derived from the audio recovered in stage three. Each waveform was down‑mixed to mono, resampled to 16 kHz, peak‑normalised, and split into 30‑second chunks with boundary fades. Chunks were captioned independently using Qwen3 Omni 30B Instruct11 via vLLM, prompted to describe instrumentation, genre, tonality, tempo, and mood while ignoring abrupt chunk starts or ends. Per‑chunk captions were synthesised into a single description using Gemma 4 26B A4B, additionally prompted for five musical and five emotional tags, with output constrained to a strict JSON schema and invalid responses resubmitted. Each emotional tag was then matched against the NRC‑VAD Lexicon v2.1 (Mohammad, 2025), which provides human‑annotated valence, arousal, and dominance ratings for 55,000 English words on a [−1, 1] scale; unmatched tags were retried via WordNet lemmatisation12 and discarded if no match was found. The mean and standard deviation of the matched ratings give each track’s valence, activation, and dominance, describing the region of affective space in which the music sits. The affect scale is thus anchored in human ratings, though the words steering the lookup are model‑generated; we discuss the implications of this in Section 7.6. A comparable approach has been applied to concert programme notes (Khanal and Donnelly, 2025), though its combination with model‑generated tags is, to our knowledge, novel.
3.7 Dataset structure
The pipeline described above produces a naturally hierarchical dataset. We therefore organise MuVGM into three primary levels: console‑, game‑, and track‑level, as shown in Figure 1. We also provide an interactive web‑based dataset explorer, with all download links at https://tylerhmc.com/muvgm/.
Figure 1
Structure of the MuVGM dataset. Right arrows indicate grouped fields, while bullets indicate leaf‑level attributes. Pseudo‑labelled data are indicated by annotations.
4 Descriptive Statistics
The MuVGM dataset comprises 7,129 tracks from 1,484 games across 39 consoles, covering 37 years of game music history, with an average of 4.8 tracks per game. The pipeline described in Section 3 was run to completion, ensuring 100% coverage of all fields, and took around one month to complete. The temporal coverage of MuVGM is illustrated in Figure 2.
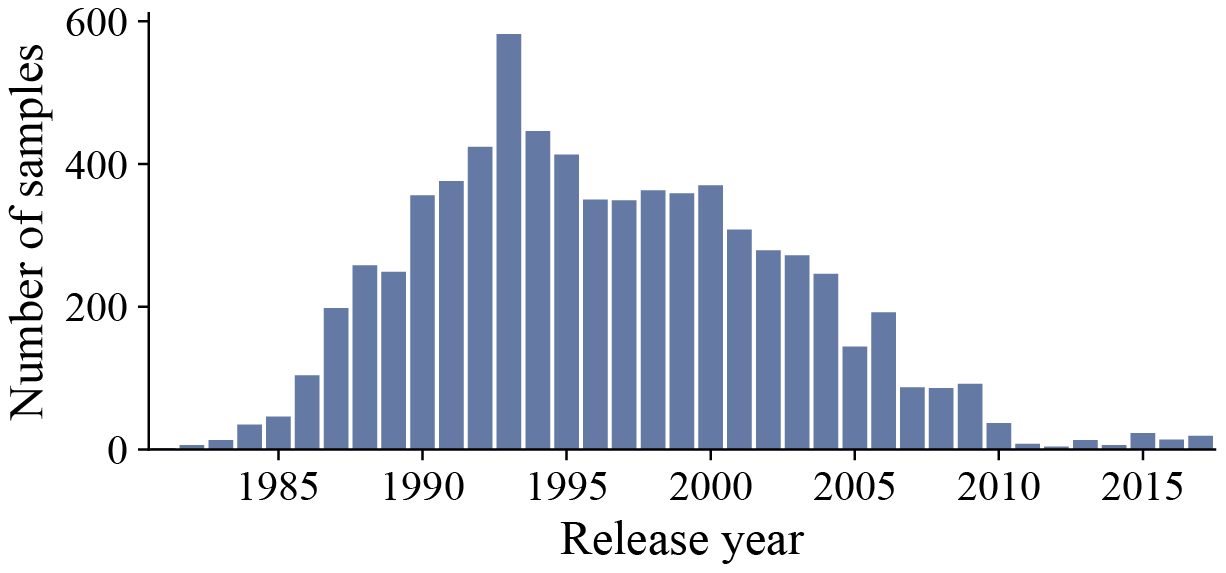
Figure 2
Temporal coverage of samples in MuVGM.
In total, the dataset provides 313 hours of audio data, with an average of 2.6 minutes per track, paired with 21 million total note events, with an average of 2,852 notes per transcription. In the visual domain, the dataset provides 39.6 hours of gameplay video data as 20‑second excerpts and 1,484 box art images. With the addition of pseudo‑labels, the dataset also provides 35,645 musical tags and 35,645 emotional tags, 7,129 circumplex emotion labels, and 738,000 words of textual material from game descriptions and track captions.
Table 1 lists the 10 most frequent musical characteristics and emotional palette tags in MuVGM. Musical annotations are dominated by electronic and synthesiser‑based descriptors (e.g., chiptune, electronic, and synthesised), likely reflecting the large proportion of older titles in the dataset. Emotion annotations tend towards high‑energy and positively valenced states, such as triumphant, playful, and adventurous, consistent with the functional role of game music in maintaining player engagement (Collins, 2008).
Table 1
The 10 most frequent musical characteristics and emotional palette tags in MuVGM.
| Musical tags | Emotional tags | ||
|---|---|---|---|
| Tag | Count | Tag | Count |
| arpeggiated | 3,677 | triumphant | 3,390 |
| chiptune | 3,600 | playful | 3,388 |
| electronic | 2,770 | urgent | 2,750 |
| synthesised | 1,960 | cheerful | 2,032 |
| major | 1,955 | adventurous | 2,025 |
| 8‑bit | 1,620 | exhilarating | 1,837 |
| orchestral | 1,261 | exuberant | 1,522 |
| syncopated | 1,069 | intense | 1,399 |
| square‑wave | 1,028 | optimistic | 1,171 |
| staccato | 935 | heroic | 1,141 |
This tendency towards high‑energy, positively valenced annotations is also reflected in the continuous affective annotations shown in Figure 3. The distribution of circumplex labels is strongly concentrated in the positive‑valence, positive‑activation region, indicating that a large proportion of samples may be characterised by an energetic and positively coloured profile. Log‑scaled density reveals structure across the remaining quadrants, showing that the distribution is not exclusively dominated by a single affective profile. Lower‑density regions corresponding to calmer, more neutral, or negatively valenced states remain well represented, albeit to a lesser extent.
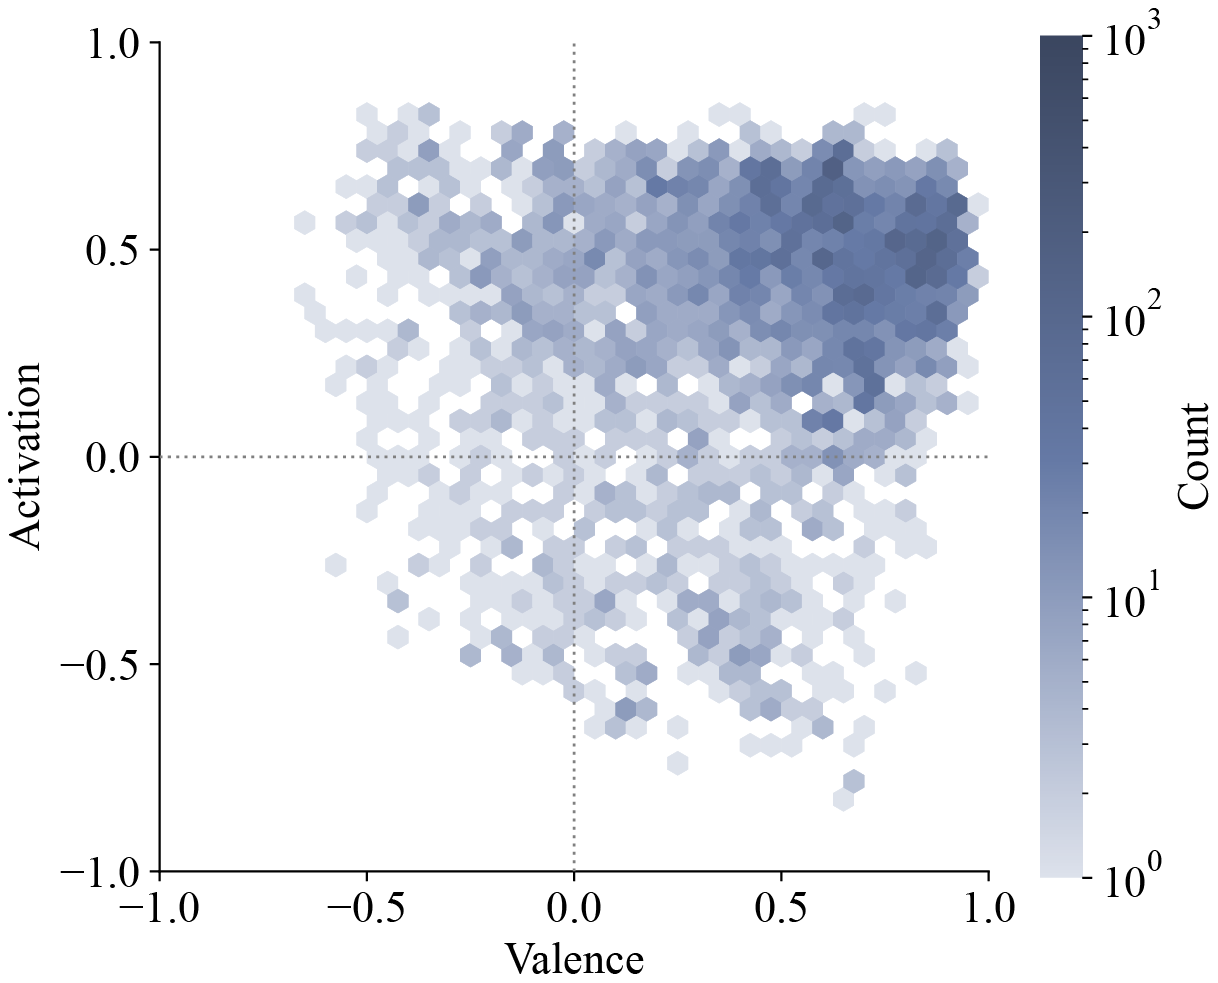
Figure 3
Distribution of valence‑activation labels in MuVGM. Hexagonal binning is used to visualise label density, with colour intensity indicating the logarithm of the number of samples per bin.
Following the cleaning of genre labels, as described in Section 3.2, 37 unique genres remained. Games may be associated with multiple genre labels, as shown in Figure 4, where lighter, hashed bars indicate the proportion of multi‑genre titles for a given genre label. Platformer was the most common genre label in both single‑genre and multi‑genre games, followed by role‑playing, action, and action‑adventure, in overall count.
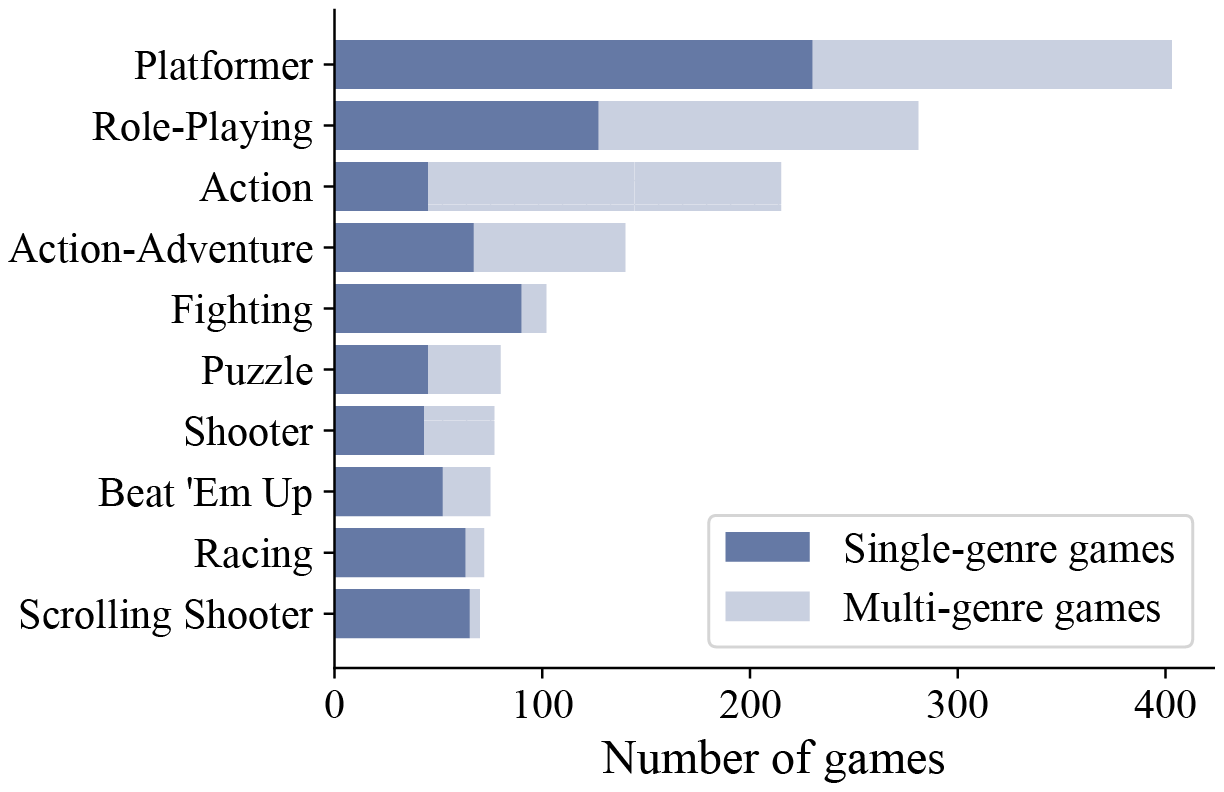
Figure 4
Top 10 most frequent genres in MuVGM.
The prevalence of platformer games could be explained by the constraints of pre‑1995 consoles, which were predominantly limited to 2D graphics. Platforming emerged naturally from 2D mechanics, where exploration largely meant moving across platforms. With the release of the PlayStation 1 in 1995 (Europe and North America), 3D games became more widespread, and platforming declined, as exemplified in Figure 5. Notably, pre‑1995 titles account for 50.7% of the total games in MuVGM, which aligns with the prominence of platforming titles observed in the dataset.
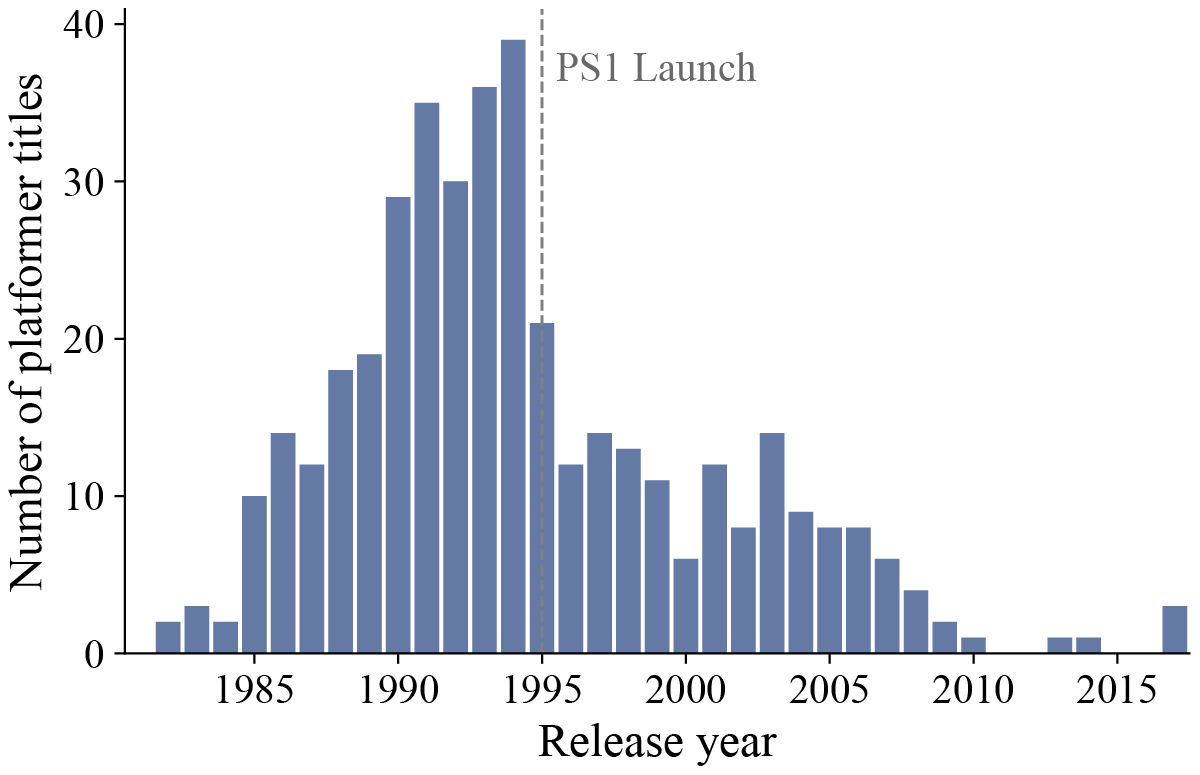
Figure 5
Frequency of platformer games over time.
Additionally, we observe systematic differences in genre co‑occurrence patterns. Figure 6 visualises these relationships using a row‑normalised co‑occurrence matrix, where each row corresponds to a conditioning genre, and each cell indicates how frequently that genre appears alongside another. Formally, each entry represents the conditional proportion . As shown, some genres function as relatively definitive labels, exhibiting limited overlap beyond a narrow set of related genres, such as racing and fighting, while genres such as platformer and action co‑occur far more broadly, reflecting differing levels of descriptive coarseness across the genre space represented in MuVGM.
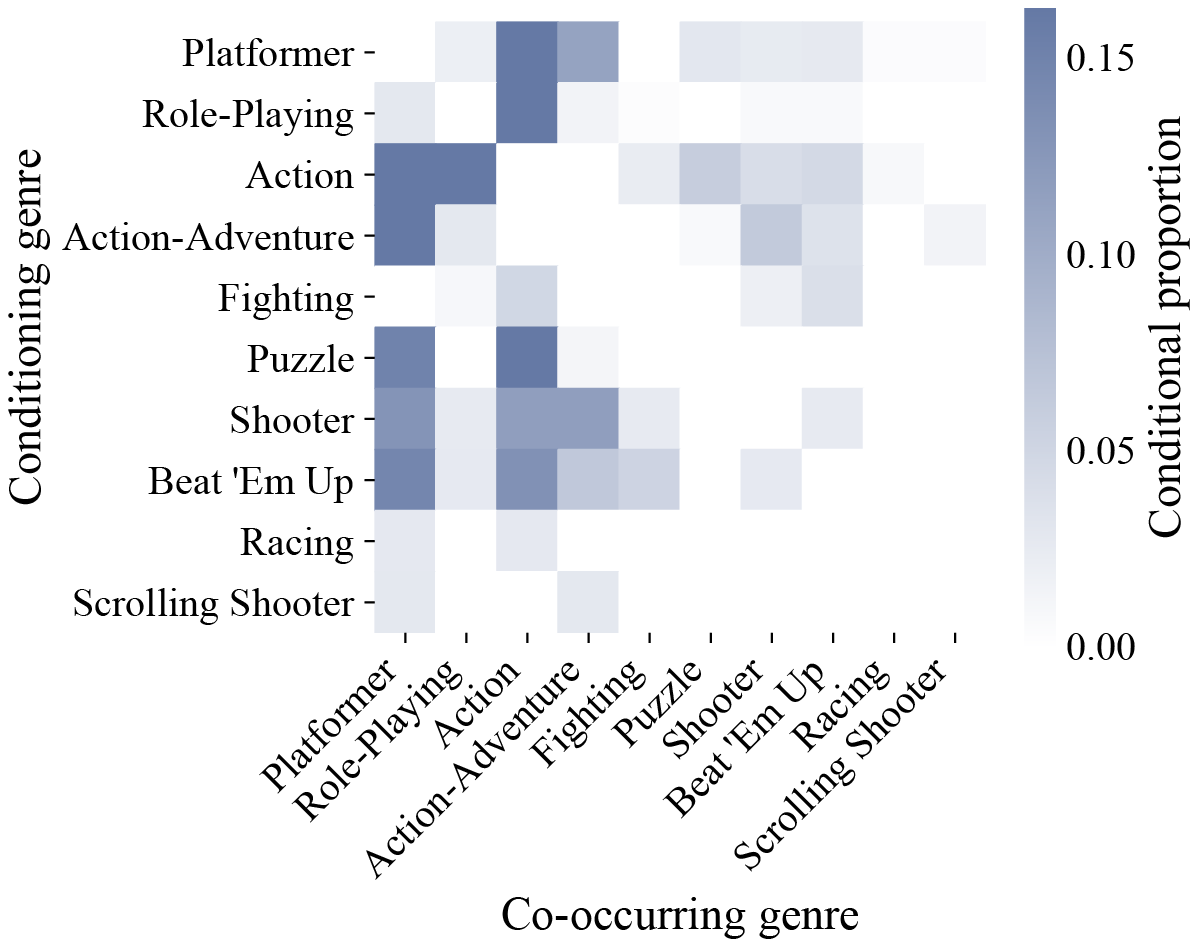
Figure 6
Row‑normalised genre co‑occurrence matrix of the 10 most frequent genres in MuVGM.
When examining the symbolic corpus, the distribution of instrumentation density spans a broad range, as displayed in Figure 7, with a mean of 7.81 instruments per transcription and a standard deviation of 4.79. While a local mode is observed at the three‑instrument bin, the majority of transcriptions cluster between approximately five and seven instruments, with a gradual decline thereafter. We suggest that the local mode may be related to the limitations of early hardware, which typically restricted audio output to a few simultaneous channels (melody, accompaniment, percussion), resulting in less densely orchestrated music.
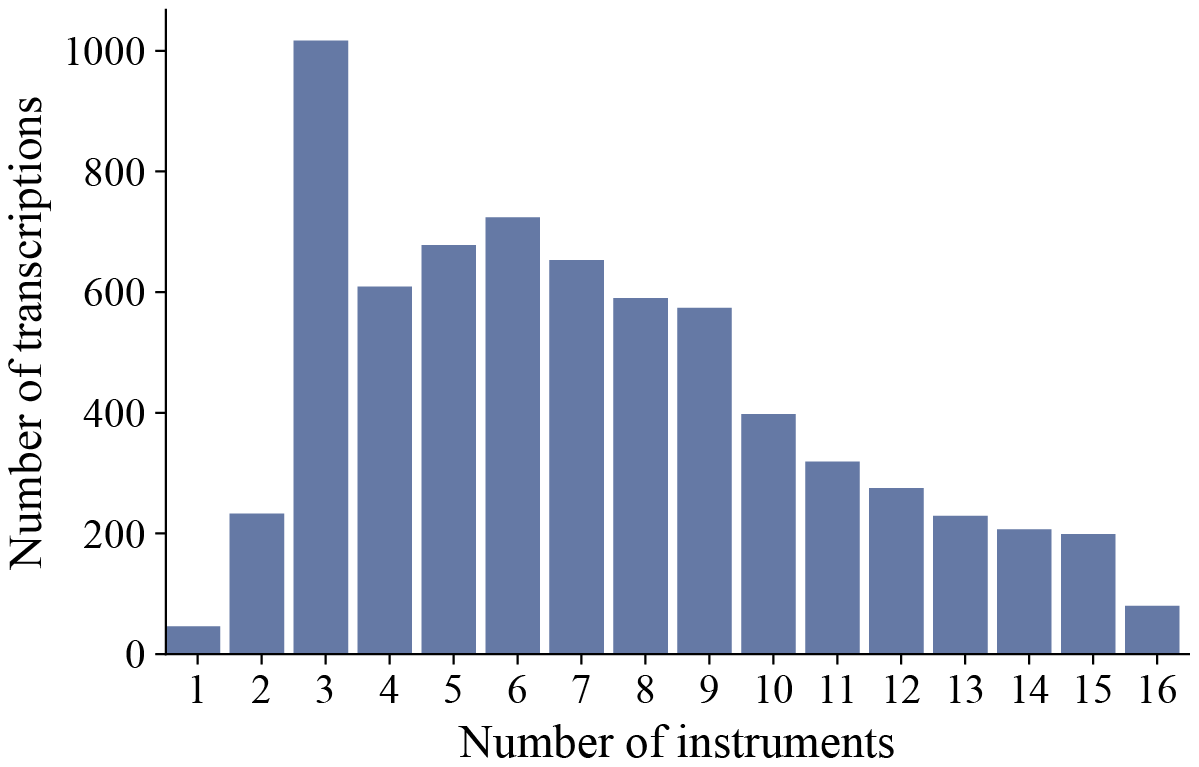
Figure 7
Distribution of instrument density counts across transcriptions (95th percentile).
Figure 8 shows the distribution of MIDI instrument families in the dataset, per the General MIDI specification (with drums included under Percussion), split into unique per‑track and raw occurrence counts. Percussion is most prevalent on both counts, followed by Bass and Ensemble; Ensemble also has a high raw total, reflecting heavy use of combined patches (such as strings and synth strings). Synth Lead ranks fourth, likely reflecting the 8‑bit aesthetic of early consoles. The core of the distribution consists of standard acoustic timbres (Brass, Piano, Strings, and Guitar), while categories like Ethnic and Sound Effects remain rare.
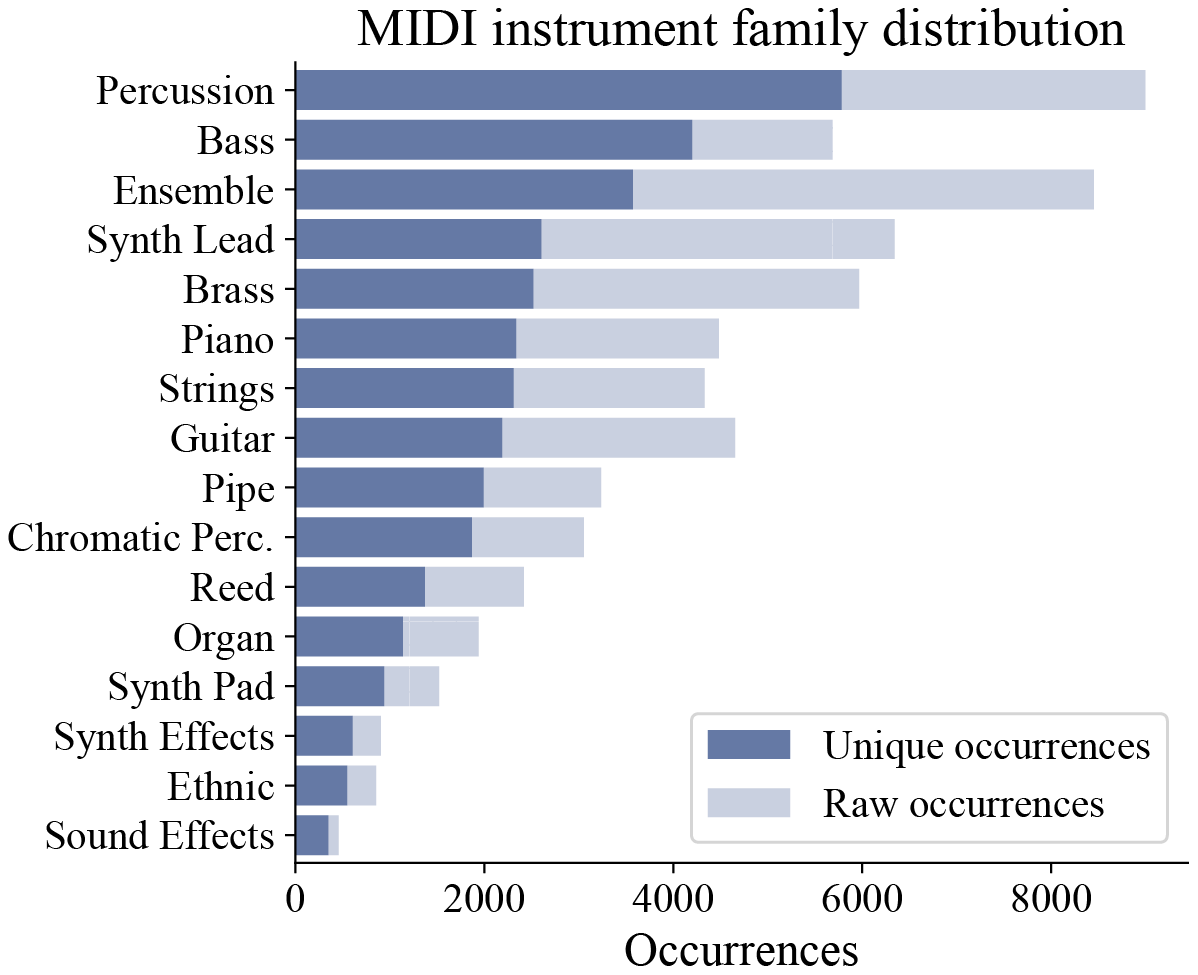
Figure 8
Distribution of instrument families.
Figure 9 shows the distribution of pitch occurrences across the symbolic corpus, with each bar reflecting the total number of note events at a given MIDI pitch. The greater frequency of pitches corresponding to the piano’s white keys suggests an emphasis on diatonic music in keys such as C, G, and F major or their relative minor keys. Visually, the distribution appears smooth across the playable MIDI range, with a weak bimodal structure. While Hartigan’s dip test rejects strict unimodality (dip = 0.0157, ), the bimodality coefficient remains too low (BC = 0.448) to suggest true bimodality.
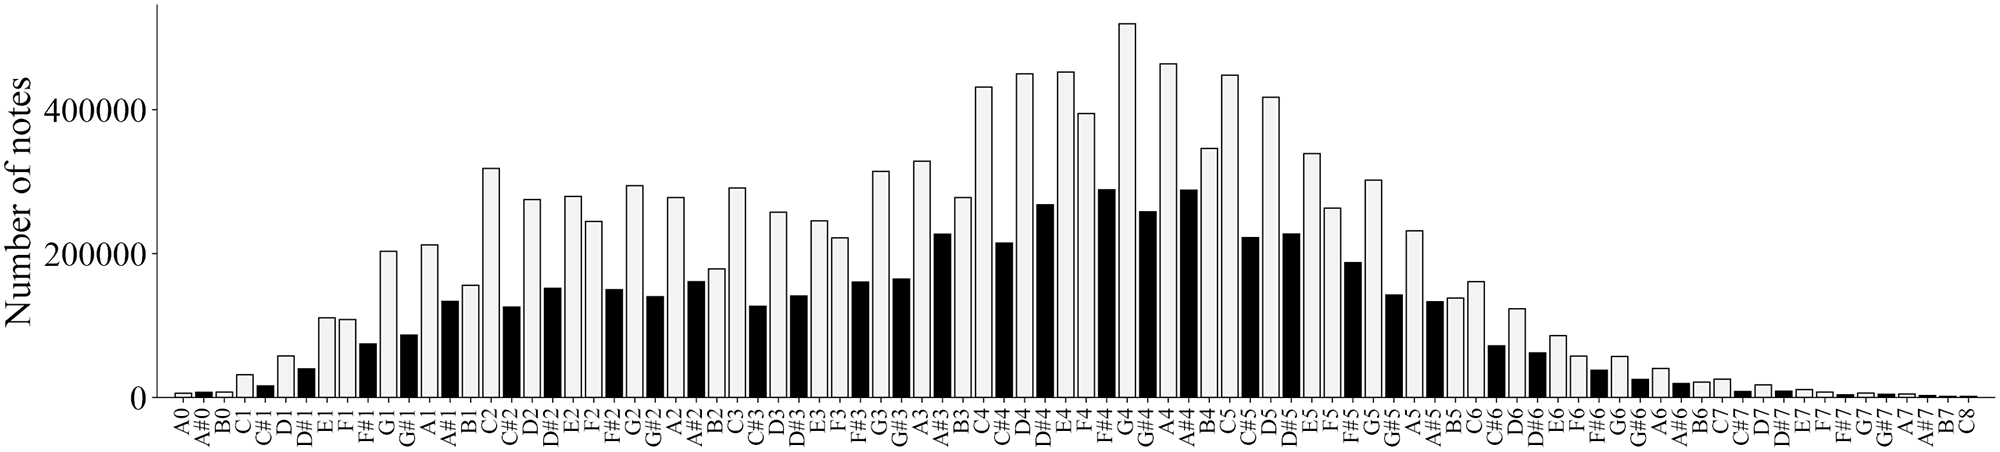
Figure 9
Pitch histogram of symbolic note events in MuVGM (drum tracks excluded).
4.1 Data validation: MIDI–audio similarity
To validate the alignment between symbolic and audio modalities, we measured the similarity between each MIDI transcription and its paired original audio. MIDI files were rendered to waveform using console‑appropriate SoundFonts (GeneralUser GS for general MIDI material; 8bitsf for chiptune‑style transcriptions), and both the rendered and original audio were resampled to 22 kHz mono. We then compared them using cosine similarity on a scale of −1 to 1, across three complementary feature representations. For pitch and harmonic content, we used constant‑Q chroma (librosa’s chroma_cqt (McFee et al., 2015)) as 12‑dimensional pitch‑class profiles with a 512‑sample hop. For timbre and texture, we used MFCCs (20 coefficients, 512‑sample hop). For high‑level semantic identity, we used LAION‑CLAP audio embeddings (Wu et al., 2023).
Table 2 reports the resulting similarity scores. Despite likely transcription noise, transposition errors, timbral mismatches, timing inaccuracies, and tempo deviations, similarity remains high across all three metrics, indicating good correspondence between the symbolic and audio representations at the corpus level. These are aggregate statistics, however, and do not preclude the individual transcription errors discussed in Section 7.
5 Exploratory Analysis
Having described the contents of MuVGM, we now investigate how its musical and visual features vary across time, platform, game mode, and genre. The statistical framework and reporting conventions used in this section are summarised below. The analyses operate on a set of modality‑specific features extracted from the symbolic, audio, and box art components of MuVGM, as summarised in Table 3. The full results of our analysis and the individual feature descriptions are provided in the Supplementary Material (Tables S1–S4 and S5–S7, respectively) and on the dataset explorer website (see Section 3.7).
Table 3
Summary of the features extracted for each modality and used in the exploratory analyses.
| Modality | Extracted Features |
|---|---|
| Symbolic (MIDI) | Duration; note count; track count; unique instrument count; mean polyphony; note density; IOI std; pitch (mean, range, entropy); velocity (mean, std, entropy); mean tempo. |
| Audio (Original) | Duration; RMS energy (mean, std); spectral centroid (mean, std); spectral bandwidth (mean, std); zero‑crossing rate; MFCCs 1–13. |
| Visual (Box Art) | Aspect ratio; colour statistics (mean and std of hue, saturation, and brightness); colourfulness; contrast; image entropy; edge density. |
5.1 Statistical framework
All analyses in this section use non‑parametric statistical tests because the extracted features are generally non‑normally distributed. We therefore rely on rank‑based and permutation‑based tests that do not assume normality. For each test, we discuss the method used, the threshold for significance, and the interpretation boundaries for the reported effect sizes.
5.1.1 Console effects
Console effects were measured using a Kruskal‑Wallis test to assess whether feature distributions differ across multiple console generations. Effect size is reported using epsilon‑squared , which estimates the proportion of variance attributable to console differences, with false discovery rate correction applied across features. Significance was assessed at . Values of of 0.01, 0.06, and 0.14 are interpreted as small, medium, and large effects, respectively (Cohen, 2013).
5.1.2 Temporal effects
Temporal effects were assessed using Spearman’s rank correlation to measure monotonic relationships between release year and each extracted feature. Effect sizes are reported using Spearman’s correlation coefficient , with false discovery rate correction applied across features. Significance was assessed at . Absolute values of of 0.1, 0.3, and 0.5 are interpreted as small, moderate, and large effects, respectively (Cohen, 2013).
5.1.3 Genre effects
Genre effects were measured using permutation‑based linear regression with binary genre indicators to test whether genre membership explains variance in each feature under a multi‑label setting. Effect size is reported using , with false discovery rate correction applied across features. Significance was assessed at via permutation testing. Values of of 0.02, 0.13, and 0.26 are interpreted as small, medium, and large effects (Cohen, 2013). Per‑genre descriptive effects are further detailed using Cliff’s .
5.1.4 Game mode effects
In MuVGM, most titles annotated with a multiplayer mode also support single‑player play. A small number of exclusively multiplayer titles (<1% of the dataset), corresponding to massively multiplayer online games, were excluded to avoid extreme class imbalance. The remaining titles were grouped into two classes: single‑player and mixed‑player. The differences between these groups were assessed using a Mann–Whitney U test. Effect size is reported using Cliff’s , with false discovery rate correction applied. Significance was assessed at . Absolute values of of 0.147, 0.33, and 0.474 are interpreted as small, medium, and large effects, respectively (Romano et al., 2006).
5.2 Results and discussion
Console generation emerges as the dominant explanatory factor across all analyses, producing the largest and most consistent effects in the symbolic, audio, and visual modalities. All features remained significant after correction (Table S1), with multiple large effects. In the symbolic domain, the strongest separation comes from structural complexity, with unique instrument count (), mean polyphony (), and track count () all reaching large effects, indicating that music on different platforms differs most in how many parts it carries and how densely they are layered. The audio modality separates more sharply in timbral descriptors, particularly spectral bandwidth (), spectral centroid (), and most MFCCs, pointing to distinct frequency profiles across platforms. Visual features show comparable structure, with the largest effect on box art aspect ratio () alongside medium effects in brightness, colourfulness, entropy, edge density, and saturation, so platforms differ not only in format but in the tone and busyness of their artwork. The platform therefore separates musical complexity, timbre, and visual design together rather than any one in isolation.
Temporal trends mostly restate the console effects rather than adding an independent signal. The same structural features lead (unique instrument count, ; track count, ; mean polyphony, ), and because these correlations are signed, they describe a direction: music becomes longer, denser, and more instrumentally varied over time, brighter chip timbres give way to warmer mixes, and box art grows busier but less saturated (Table S2). These effects are weaker than the console effects and are almost entirely attributable to the console effects. Because titles on the same platform can be released years apart on identical hardware, the release year acts largely as a coarse proxy for the hardware era. Controlling for console generation confirms this directly: the year correlations of the strongest features fall by over 90% (partial ), and release year explains negligible additional variance once console is accounted for (). We therefore treat platform, not release year, as the meaningful temporal descriptor.
Genre explains meaningful but comparatively moderate variance, and it is expressed more through how the music sounds and how games look than through symbolic structure. Symbolic effects stay small, with note density () and mean pitch () the strongest. Audio shows clearer genre‑level differentiation, with spectral bandwidth approaching a medium effect (), and the clearest distinctions appear in visual features, where colourfulness (), mean brightness (), and edge density () suggest consistent visual conventions within genres (Table S3). Within MuVGM, then, genre is carried more by timbral and visual character than by note‑level composition.
Multiplayer mechanics, by contrast, yield practically negligible effects. Many features reach significance, but effect sizes stay very small (Table S4). The most notable differences are symbolic: mixed‑player titles show slightly higher note density () and note count (), whereas audio and visual features show no meaningful separation. Within the properties our features capture, the presence of multiplayer does not systematically shape the music or artwork. The full results are provided in the Supplementary Material.
6 Experiments
To further evaluate the research utility of MuVGM, we conduct a set of experiments designed to probe the dataset for cross‑modal structure and learning signals. The aim is not to optimise task performance but to assess whether such signals are present. All data are first embedded into a shared representation space using a frozen ImageBind model (Girdhar et al., 2023), which, unlike alternatives such as CLIP, CLAP, or CLaMP (, Elizalde et al., 2023; Radford et al., 2021; Wu et al., 2025), natively encodes all three of our target modalities: text, vision, and audio.
6.1 Embeddings and late fusion
For each game and track, we compute modality‑specific embeddings using the ImageBind encoders. For each sample, we embed (i) game‑level context, comprising the box art image and textual summaries (narrative, mechanics, and player experience), and (ii) track‑level context, comprising the gameplay video and track annotations (caption and tags). Game‑level text fields are aggregated before fusion. Additionally, we embed the corresponding original audio as a standalone target for retrieval tasks. The individual embeddings are combined using late fusion in embedding space to form track‑ and game‑level embeddings, which can be further fused into full embeddings. The fusion setup is illustrated in Figure 10.
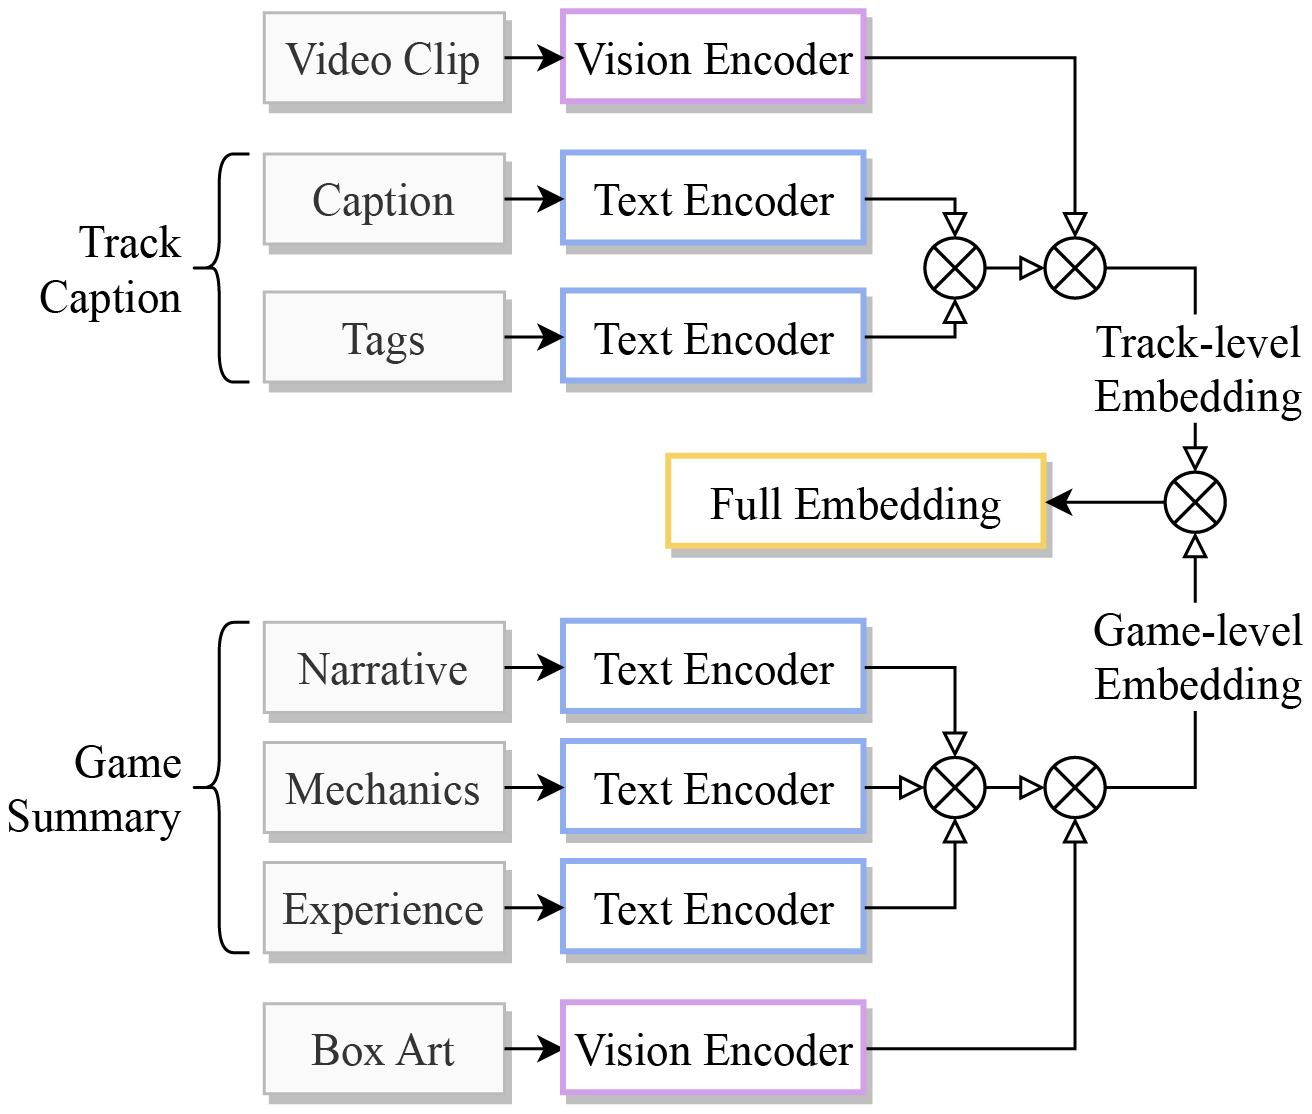
Figure 10
Multimodal embeddings constructed via late fusion. Each part is encoded independently and combined in embedding space, with fusion nodes () indicating a local mean aggregation with L2 normalisation over connected inputs.
We fuse embeddings by first projecting each vector onto the unit hypersphere via L2 normalisation. The normalised vectors are averaged, and the mean is subsequently re‑projected to unit length. Formally, for embeddings , the fused representation is given by Equation (1):
This ensures that all cosine similarity comparisons remain aligned with the angular structure induced by contrastive training, where semantic relationships are primarily encoded in the vector direction. The final L2 normalisation step prevents embedding magnitude from influencing similarity scores.
6.1.1 Input chunking
A limitation of ImageBind is that it processes audio and video in fixed 2‑second chunks. For longer files, it samples several 2‑second segments, embeds them independently, and averages them into a single representation. By default, it uses only three segments for audio and five for video, regardless of duration, so longer files receive proportionally sparser coverage than shorter ones. To avoid this length‑dependent bias, we increase the number of segments dynamically to span the full duration of each file.
6.1.2 Crossmodal representational alignment
To assess whether the embeddings capture meaningful crossmodal structure, we compute the pairwise linear Centered Kernel Alignment (CKA) (Kornblith et al., 2019) between modality embeddings. CKA measures how similarly two representations organise a shared set of paired items; although typically used to compare network layers, it has been applied to measure crossmodal representational similarity (Maniparambil et al., 2024). A high score means two modalities organise the dataset similarly, with pairs of items that are similar under one tending to be similar under the other.
Figure 11 shows the resulting alignment scores. Captions and tags are the most strongly aligned (0.79), consistent with both describing the same track. Audio aligns substantially with its textual descriptions (0.50 with captions, 0.48 with tags) and with video (0.39), indicating that the music, its annotations, and its in‑game context share representational structure. Video aligns moderately with all modalities (0.26–0.39), acting as an audiovisual bridge, while the game‑level modalities cohere with each other (box art–game summary, 0.27) but only weakly with track‑level text (0.12), as expected given that a single game may correspond to many tracks. Overall, the dataset’s paired modalities exhibit consistent representational alignment, strongest along the track‑level pairings at the core of the dataset.
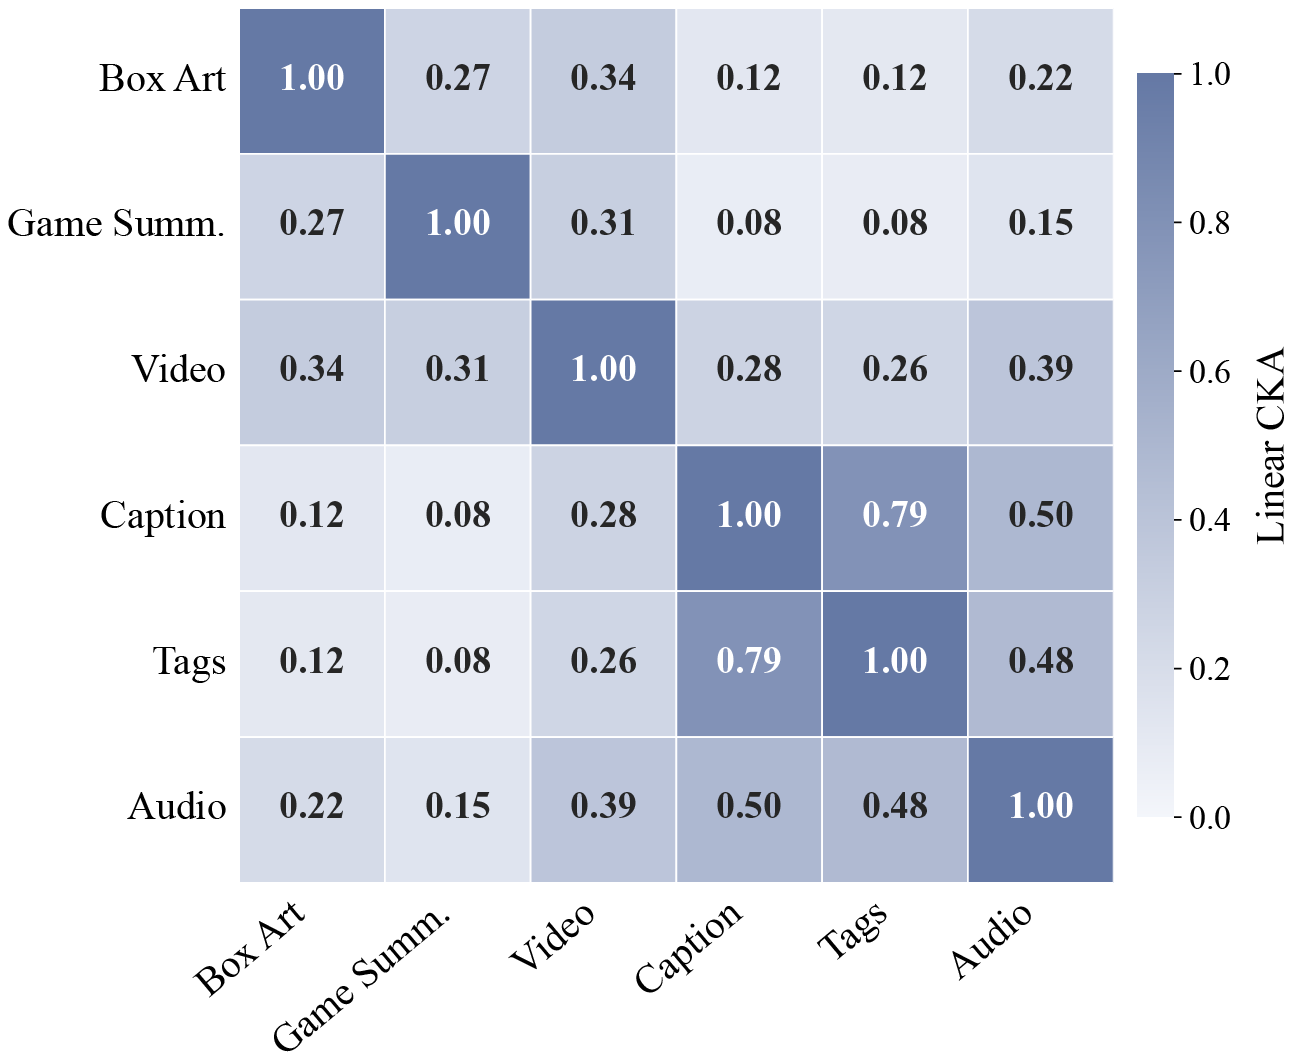
Figure 11
Pairwise linear CKA between modality embeddings in the ImageBind space.
6.2 Crossmodal music retrieval
To further explore the crossmodal structure in MuVGM, we conduct a music retrieval experiment using the ImageBind embeddings. Given a fully fused ‘environment’ embedding (shown in yellow in Figure 10), formed by fusing the game embedding and track embedding, the task is to retrieve the corresponding original audio from a database of audio embeddings. For each query, the database contains the correct audio and negative audio embeddings. Performance is reported using Recall@ for . A random‑chance baseline for each pool size is provided in Table 4. Negative samples are drawn exclusively from non‑query games, excluding samples from the same game to avoid leakage and bias. We compare two settings: (i) zero‑shot retrieval using frozen embeddings, and (ii) learned retrieval using a bi‑encoder trained on the MuVGM dataset. In both cases, candidates are ranked by cosine similarity in the resulting representation space.
Table 4
Crossmodal music retrieval performance under random ranking, zero‑shot cosine similarity, and learned bi‑encoder retrieval. R@ is the probability that the correct audio is in the top‑ retrieved candidates. Bi‑encoder results: mean std over 5 folds. Bold indicates the best result for each pool size and metric.
| Pool | Random | Zero‑Shot | Bi‑Encoder (5‑Fold) | ||||||
|---|---|---|---|---|---|---|---|---|---|
| R@1 | R@5 | R@10 | R@1 | R@5 | R@10 | R@1 | R@5 | R@10 | |
| 50 | 0.0200 | 0.1000 | 0.2000 | 0.2343 | 0.5545 | 0.7220 | 0.5255 0.0226 | 0.8674 0.0187 | 0.9496 0.0115 |
| 200 | 0.0050 | 0.0250 | 0.0500 | 0.1125 | 0.2951 | 0.4235 | 0.3162 0.0235 | 0.6308 0.0322 | 0.7729 0.0278 |
| 500 | 0.0020 | 0.0100 | 0.0200 | 0.0634 | 0.1842 | 0.2700 | 0.2122 0.0219 | 0.4647 0.0347 | 0.6040 0.0364 |
| 1000 | 0.0010 | 0.0050 | 0.0100 | 0.0425 | 0.1205 | 0.1866 | 0.1521 0.0159 | 0.3487 0.0320 | 0.4697 0.0334 |
6.2.1 Zero‑shot cosine retrieval
In the zero‑shot setting, we perform retrieval directly on the frozen embeddings, without any training or adaptation. Table 4 summarises retrieval performance across the different candidate pool sizes. Retrieval consistently exceeds the chance baseline for all values of , indicating that some crossmodal alignment is present in the frozen embedding space. As expected, Recall@ decreases gradually as the pool size grows and the task becomes more challenging. Even at the largest pool size (1,000 candidates), performance remains well above chance, with R@1 = 0.0425 and R@10 = 0.1866, substantially outperforming the corresponding random baseline.
To assess the relative contribution of track‑level and game‑level context, we conduct an ablation study at a fixed pool size of 200 (Table 5), a pool size large enough to be discriminative yet small enough for R@1 to remain informative. Combining both levels (R@1 = 0.1125) outperforms track context alone (R@1 = 0.0941), showing that game context contains meaningful information not fully captured by track context. Notably, game embeddings alone reach R@1 = 0.0801, roughly 16× the random baseline, despite deriving only from box art and game descriptions. This indicates that even coarse, game‑wide context carries a meaningful signal for music retrieval.
Table 5
Weight ablation study for zero‑shot retrieval at pool size 200 comparing the relative contributions of the track‑level and game‑level context. Bold indicates the best result for each metric.
| Query Composition | R@1 | R@5 | R@10 |
|---|---|---|---|
| Track only (1.0/0.0) | 0.0941 | 0.2721 | 0.3873 |
| Game only (0.0/1.0) | 0.0801 | 0.2073 | 0.2957 |
| Track + Game (0.5/0.5) | 0.1125 | 0.2951 | 0.4235 |
6.2.2 Learned bi‑encoder retrieval
In the learned retrieval setting, we train a bi‑encoder on the ImageBind embeddings (see Figure 12). The model consists of two independent projection networks that map the 1024‑dimensional fused environment and audio embeddings onto an aligned 256‑dimensional latent space using a two‑layer Multilayer Perceptron (MLP) with LayerNorm and GELU activations. Alignment is optimised using an InfoNCE objective, which pulls matching pairs together and pushes non‑matching pairs apart via in‑batch negatives. A bi‑encoder design with a contrastive objective follows previous work in cross‑modal retrieval (Radford et al., 2021), adopted here in a simple form so that performance reflects the dataset rather than the model.
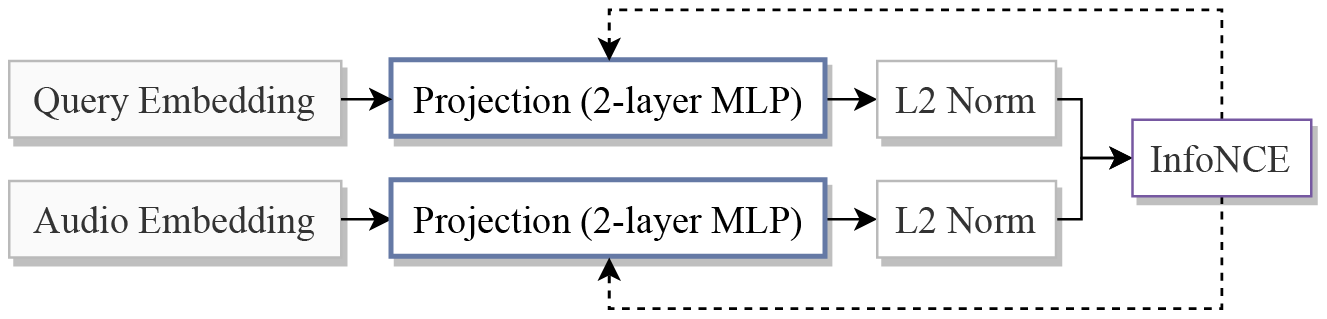
Figure 12
Bi‑encoder architecture for learned crossmodal retrieval.
We train the bi‑encoder with AdamW for 10 epochs, with a batch size of 256, weight decay of , and a seed of . The temperature () and learning rate () are chosen by nested cross‑validation, so that no tuning touches the outer validation folds. An inner 3‑fold loop within each training fold searches and , and the outer 5‑fold, game‑level split gives the reported results. All other settings are left at standard defaults. Across folds, the search consistently favoured , with at in four of the five folds (and in the fifth).
As shown in Table 4, learned retrieval substantially outperforms the zero‑shot and chance baselines at all pool sizes, with improvements evident across all values of . At a pool size of 200, for example, R@1 increases from 0.1125 in the zero‑shot setting to 0.3162 0.0235, almost tripling top‑1 retrieval accuracy. Similar relative gains are observed at R@5 and R@10, and the performance gap between learned and zero‑shot retrieval remains pronounced as the candidate pool increases. Variance across folds remains low, indicating stable generalisation to unseen games.
6.3 Metadata prediction
To assess whether MuVGM supports learning structured game properties from multimodal content, we conduct a series of supervised prediction tasks over the game‑level embeddings. Each task trains a single‑layer linear classifier on the frozen embeddings to predict a metadata attribute. A linear probe reveals what is directly readable from the embeddings, without a high‑capacity model masking how accessible the information really is (Hewitt and Liang, 2019). Probes are trained for 20 epochs with AdamW (batch size 64, weight decay , and seed ), and the learning rate is selected by nested cross‑validation: an outer 5‑fold game‑level split gives the reported scores, while an inner 3‑fold loop selects on the training data alone.
6.3.1 Multi‑label genre classification
In the first experiment, we predict the multi‑label set of genres for each game using the fused game‑level embeddings. After excluding the ‘various’ label from the 37 unique genre labels, the probe predicts the remaining 36 genre classes, trained with class‑weighted binary cross‑entropy and per‑genre decision thresholds optimised on the training folds to account for class imbalance. The inner search favoured a learning rate of in four of the five folds (and in the fifth).
As shown in Table 6, the model reaches a Micro F1 of 0.66, showing that common genres are reliably decodable from the game embeddings. Micro Precision (0.69) and Recall (0.63) are reasonably balanced. The lower Macro F1 (0.49) reveals that performance is uneven across genres: frequent genres are recovered well, while rarer or minority labels remain considerably harder to predict.
6.3.2 Multiplayer discriminative classification
We next predict whether a game supports multiplayer functionality (single‑player only vs. mixed‑player; as in Section 5.1.4), framing the task as binary classification. All titles are assumed to support single‑player, so the probe predicts the presence or absence of multiplayer from a single output node, trained with a class‑weighted binary cross‑entropy objective. The inner search favoured a learning rate of in four of the five folds (and in the fifth).
As shown in Table 7, the model reaches an Accuracy of 0.76 and an F1 of 0.74, reliably distinguishing multiplayer from single‑player‑only titles. Precision (0.72) and Recall (0.77) are reasonably balanced, indicating no strong bias towards either class. This shows that multiplayer support is linearly decodable from the fused game‑level embeddings.
6.3.3 Console generation classification
Finally, we predict the target console for each game, framing the task as single‑label multi‑class classification over 39 console categories represented in the dataset. As before, training uses a class‑weighted cross‑entropy objective to account for class imbalance. The inner search favoured a learning rate of in four of the five folds (and in the fifth).
As shown in Table 8, the model reaches an Accuracy of 0.53 across the 39 consoles, indicating that console information is partially recoverable from the game‑level embeddings. However, the low Macro F1 (0.32) indicates substantial variation in performance across platforms, with well‑represented consoles decoded more reliably than rare ones. It is notable, though, that console yielded the strongest effects in the exploratory analysis (Section 5.2) despite the weakest performance in our probing, suggesting that console identity may be less strongly represented in the embeddings.
7 Limitations
This section documents the limitations of each pipeline stage, both to guide appropriate use of MuVGM and to provide a better picture of how the dataset behaves in practice. As with most automatically constructed datasets, the pipeline introduces a degree of noise, and each stage carries its own characteristic error modes. Users should be aware of these when working with the affected fields, particularly the pseudo‑labelled annotations. We also hope this record of the practical challenges encountered at this scale proves useful to the design of future datasets. Where possible, we quantify the extent of each issue or illustrate it with examples.
7.1 Stage 1—MIDI data
The symbolic transcriptions in MuVGM are sourced from VGMusic.com and inherit that source’s limitations. Submissions are transcribed by fans rather than extracted from the original game data, so they may contain missing or added notes, incorrect voicing, missing sections, and other transcription noise, and quality varies by transcriber. Some entries are excellent transcriptions (e.g., Beedle'’ s Shop from The Legend of Zelda: The Wind Waker, GameCube), while others depart substantially from the source material: Title Screen from Kid Icarus (NES) is transcribed as a denser arrangement than the NES’s hardware could produce, and Myst (Windows) is transcribed as only the final section of the piece rather than the full track. Most transcriptions are of reasonable quality in our own interactions with the dataset, but this noise is nonetheless inherited by any symbolic analyses.
An alternative would be to source music data from repositories such as Zophar’s Domain,13 which offer direct rips of the game’s original data. However, there is a broader tension between sequenced and streamed hardware: rips are only symbolic for platforms that generate audio via symbolic synthesis, such as the NES, whereas most modern games use streamed waveforms, for which no equivalent symbolic ground truth exists. Consequently, the only way to obtain symbolic coverage for these games is through transcription, making VGMusic.com a practical choice for covering both eras.
7.2 Stage 2—Wikipedia matches
The Wikipedia matching stage introduces its own sources of noise. Some games have no page of their own, being covered only within a series or compilation page; Final Fantasy I & II: Dawn of Souls (GBA), for example, was matched to Final Fantasy II. Others lack a platform‑specific page, such as The Urbz: Sims in the City, which has little effect on descriptions or metadata but can yield box art with the wrong aspect ratio or console logo. A further source of error is spurious matching, where the algorithm favours a similar but incorrect title: Wario Land (GB), fully titled Wario Land: Super Mario Land 3, was matched to Super Mario Land. Because descriptions are generated through a separate RAG pipeline (Section 7.5), they are typically still correct in such cases, but the box art and some metadata (e.g., release year) may not be. A related failure mode is version‑specific titles being matched to franchise pages, as with Animal Crossing (GameCube).
To address this, we used the box art aspect ratio as a proxy for mismatches, flagging games whose artwork deviated from the most common ratio within their console’s subtree. This surfaced 375 potential conflicts, of which 144 were genuine franchise‑ or wrong‑page matches that we corrected manually; the remaining 231 needed no fix, being either correct entries with atypical box art or correct games simply lacking a console‑specific page. We also identified and corrected four cases where a modern remake had been matched in place of the original. However, residual errors of these kinds may still persist. Finally, because release year, game modes, and genres are drawn solely from the infobox rather than inferred from page text, incomplete infoboxes resulted in missing fields; we manually annotated 130 such games.
7.3 Stage 3—Original audio
Recovering original audio via fingerprinting introduces two further issues. First, games that reuse leitmotifs across multiple tracks can confuse the fingerprinting system: in Banjo‑Kazooie (N64), a shared motif recurs across several ‘Gruntilda’ areas with only minor variation, producing spurious matches from partial spectral overlap, though such samples tend to cluster within the same in‑game areas. Second, because audio is sourced from YouTube, it is not guaranteed to be at original quality and may have inconsistent loudness, although this is largely correctable in post.
Direct‑rip repositories such as Zophar’s Domain offer an alternative, providing audio at the original quality and mix, and would be a valuable extension for ensuring that no extraneous sounds are present. Coverage is not exhaustive, however (Resident Evil 1 is absent, for example), and naming conventions are inconsistent, with some entries using in‑game filesystem identifiers (e.g., sg00, SEQ_P017_OUTRO) rather than track titles. Matching these to named tracks via cover song detection is feasible but left to future work. YouTube sourcing partly compensates for this, since even untitled tracks usually carry a meaningful description: for 720° (NES), our source names one track ‘Main Area’, corresponding to the in‑ game ‘Main Park’ zone, where Zophar’s Domain lists it only as ‘Track 3’.14
7.4 Stage 4—Gameplay videos
The gameplay video stage has a few further limitations. Despite filtering, a small number of extracted clips originate from speedrun recordings, which differ from standard gameplay in pacing and presentation and may not reflect typical use. Recordings for dual‑screen devices such as the Nintendo DS also often composite additional visual material (e.g., box or fan art) to fill empty space, a characteristic largely absent from single‑screen recordings.
A separate issue arises from how audfprint estimates start times from the query duration and matched hash timestamps. When a track contains repeating sections, it may align the query against a later repetition rather than the first occurrence, offsetting the estimated start time to before the music is audible; less commonly, the target track itself starts partway through, causing the same effect. In both cases, the extracted window remains temporally adjacent to the target music, but alignment is either imperfect or the music is missing; a secondary fingerprinting pass over the extracted clips would be sufficient to detect and remove such cases.
7.5 Stage 5—Game descriptions
Game descriptions in MuVGM are machine generated and may therefore contain incorrect or misleading information. To limit this, we generate them using Gemma 4 26B, a current‑generation open‑source model suited to local deployment, in a retrieval‑augmented pipeline. The model is given the collected metadata and Wikipedia page, generates its own search queries, and uses the retrieved pages as grounding context. We reject any responses that lack sources, so each description is guaranteed to be grounded in real, accessible information. Even so, factual errors remain possible. The model may misunderstand or misrepresent a source or draw on a page about a different game; the latter typically stems from an incorrect upstream Wikipedia match (Section 7.2). These issues are simply the nature of machine‑generated text. Grounding reduces hallucination but does not eliminate it, and verifying every entry by hand is not feasible at this scale. We therefore recommend using the descriptions as conditioning signals or heuristics rather than as predictive targets.
7.6 Stage 6—Track captions and affective labels
Track captions are produced with Qwen3 Omni 30B, whose Audio Transformer backbone is calibrated to 30 seconds of audio, so tracks are chunked as described in Section 3.6. Captioning a full track in one pass produced severe hallucinations (incorrect tonality, instrumentation, and so on), and chunking avoids this but at a cost. Chunks can disagree, with the same instrument described differently across a track (harp in one chunk, piano in another) due to mixing or masking sound effects. Even so, Qwen3 Omni 30B performed well in our interactions with the dataset, and considerably more reliably than alternatives such as Music Flamingo (Ghosh et al., 2026), which we found prone to large, unstable swings in output (‘romantic strings’ becoming ‘lyrical piano’) under trivial changes to the system prompt. The per‑chunk captions were then condensed into a single description by Gemma 4 26B, instructed to apply majority voting across chunks, filter chunk‑local errors, and capture the track’s overall character. Audio captioning remains a genuinely difficult, unsolved task. A systematic evaluation of large audio‑language models found that hallucination is widespread across the field rather than specific to any one system (Zhao et al., 2026). Our captions should therefore be read with this in mind, even as such models continue to be used for pseudo‑labelling at scale (Hsieh et al., 2026).
The same Gemma 4 pass also produces five emotion words per track, from which we retrieve valence, arousal, and dominance scores via the NRC‑VAD Lexicon v2.1. Rather than asking a model to predict affect scores directly, the model does only what it is better suited to (generating emotionally descriptive words), while the affect values come from human‑rated lexicon entries. We stress, however, that this does not make the resulting VAD scores human data; the underlying scale is human derived, but the words steering it are model generated, so the annotation is synthetic data measured on a human‑calibrated instrument, not a human judgement of the music. Validating the pipeline against human‑elicited affect words is, therefore, a natural direction for future work. As with the other pseudo‑labelled fields in MuVGM, we recommend these annotations be used as conditioning or heuristics rather than as predictive targets. Note also that, since the VAD scores are derived from the emotion tag words, some covariance between the two is expected by construction.
8 Conclusion
We have introduced MuVGM, a large‑scale multimodal dataset that situates video game music within the compositional context for which it was written, pairing symbolic transcriptions with reference audio, gameplay video, box art, and textual descriptions for 7,129 tracks from 1,484 games across 39 consoles. The dataset was assembled through a six‑stage pipeline combining web scraping, Wikipedia matching, cover song detection, audio fingerprinting, retrieval‑augmented text generation, and automatic music captioning, with each stage’s characteristic limitations documented in Section 7. Our analyses show that the dataset captures meaningful structure; console generation emerges as the dominant explanatory factor in feature analysis, and experiments in a shared embedding space demonstrate learnable cross‑modal alignment, with retrieval and metadata prediction performing well above chance and improving substantially with light supervised training. Together, these results suggest that the contextual grounding unique to game music is present and exploitable in MuVGM. We hope the dataset will support future work in multimodal music understanding, from context‑conditioned generation to ludomusicological analysis, and that the construction and validation methods documented here prove useful for the design of future datasets.
Notes
[1] https://openai.com/index/gpt-5-5-system-card/, last accessed August 19, 2026.
[2] https://deepmind.google/models/model-cards/gemini-3-1-pro/, last accessed August 19, 2026.
[3] Here, ‘track’ refers to a music sample in MuVGM, not an individual instrument stem within a multitrack MIDI.
[4] https://essentia.upf.edu/tutorial_similarity_cover.html, last accessed August 19, 2026.
[5] https://musical-artifacts.com/artifacts/23, last accessed August 19, 2026.
[6] https://www.schristiancollins.com/generaluser, last accessed August 19, 2026.
[8] https://github.com/dpwe/audfprint, last accessed August 19, 2026.
[9] https://huggingface.co/google/gemma-4-26B-A4B, last accessed August 19, 2026.
[10] https://docs.openwebui.com/features/chat-conversations/web-search/providers/ddgs/, last accessed August 19, 2026.
[11] https://huggingface.co/Qwen/Qwen3-Omni-30B-A3B-Instruct, last accessed August 19, 2026.
[12] https://www.nltk.org/api/nltk.stem.wordnet.html, last accessed August 19, 2026.
[13] https://www.zophar.net/, last accessed August 19, 2026.
[14] https://www.zophar.net/music/nintendo-nes-nsf/720, last accessed August 19, 2026.
Funders
This study was funded by Queen Mary University of London and UK Research and Innovation (EP/S022694/1).
Additional Files
The additional files for this article can be found as follows:
Ethics Statement
This work did not involve human participants or personal data. The audio, video, and visual material in MuVGM is copyrighted by its respective rights holders; it was collected from publicly accessible online sources (VGMusic, Wikipedia, YouTube) for research purposes under fair dealing/fair use. While sharing and derivative use of video game audiovisual content are common practices online, this does not constitute a waiver of copyright, and the dataset is therefore not distributed under an open, unrestricted licence. Instead, MuVGM is hosted behind an access‑request mechanism requiring evidence of academic affiliation and confirmation of non‑commercial research use, and we will respond promptly to any requests from rights holders to remove specific content from the dataset.
Funding Information
The first author is a research student at the UKRI Centre for Doctoral Training in Artificial Intelligence and Music, supported jointly by UK Research and Innovation (grant number EP/S022694/1) and Queen Mary University of London.
Competing Interests
Simon Dixon is a former Co‑editor‑in‑Chief of the Transactions of the International Society for Music Information Retrieval. The first author is a research student at the UKRI Centre for Doctoral Training in Artificial Intelligence and Music, supported jointly by UK Research and Innovation (grant number EP/S022694/1) and Queen Mary University of London. There are no other competing interests to declare.