
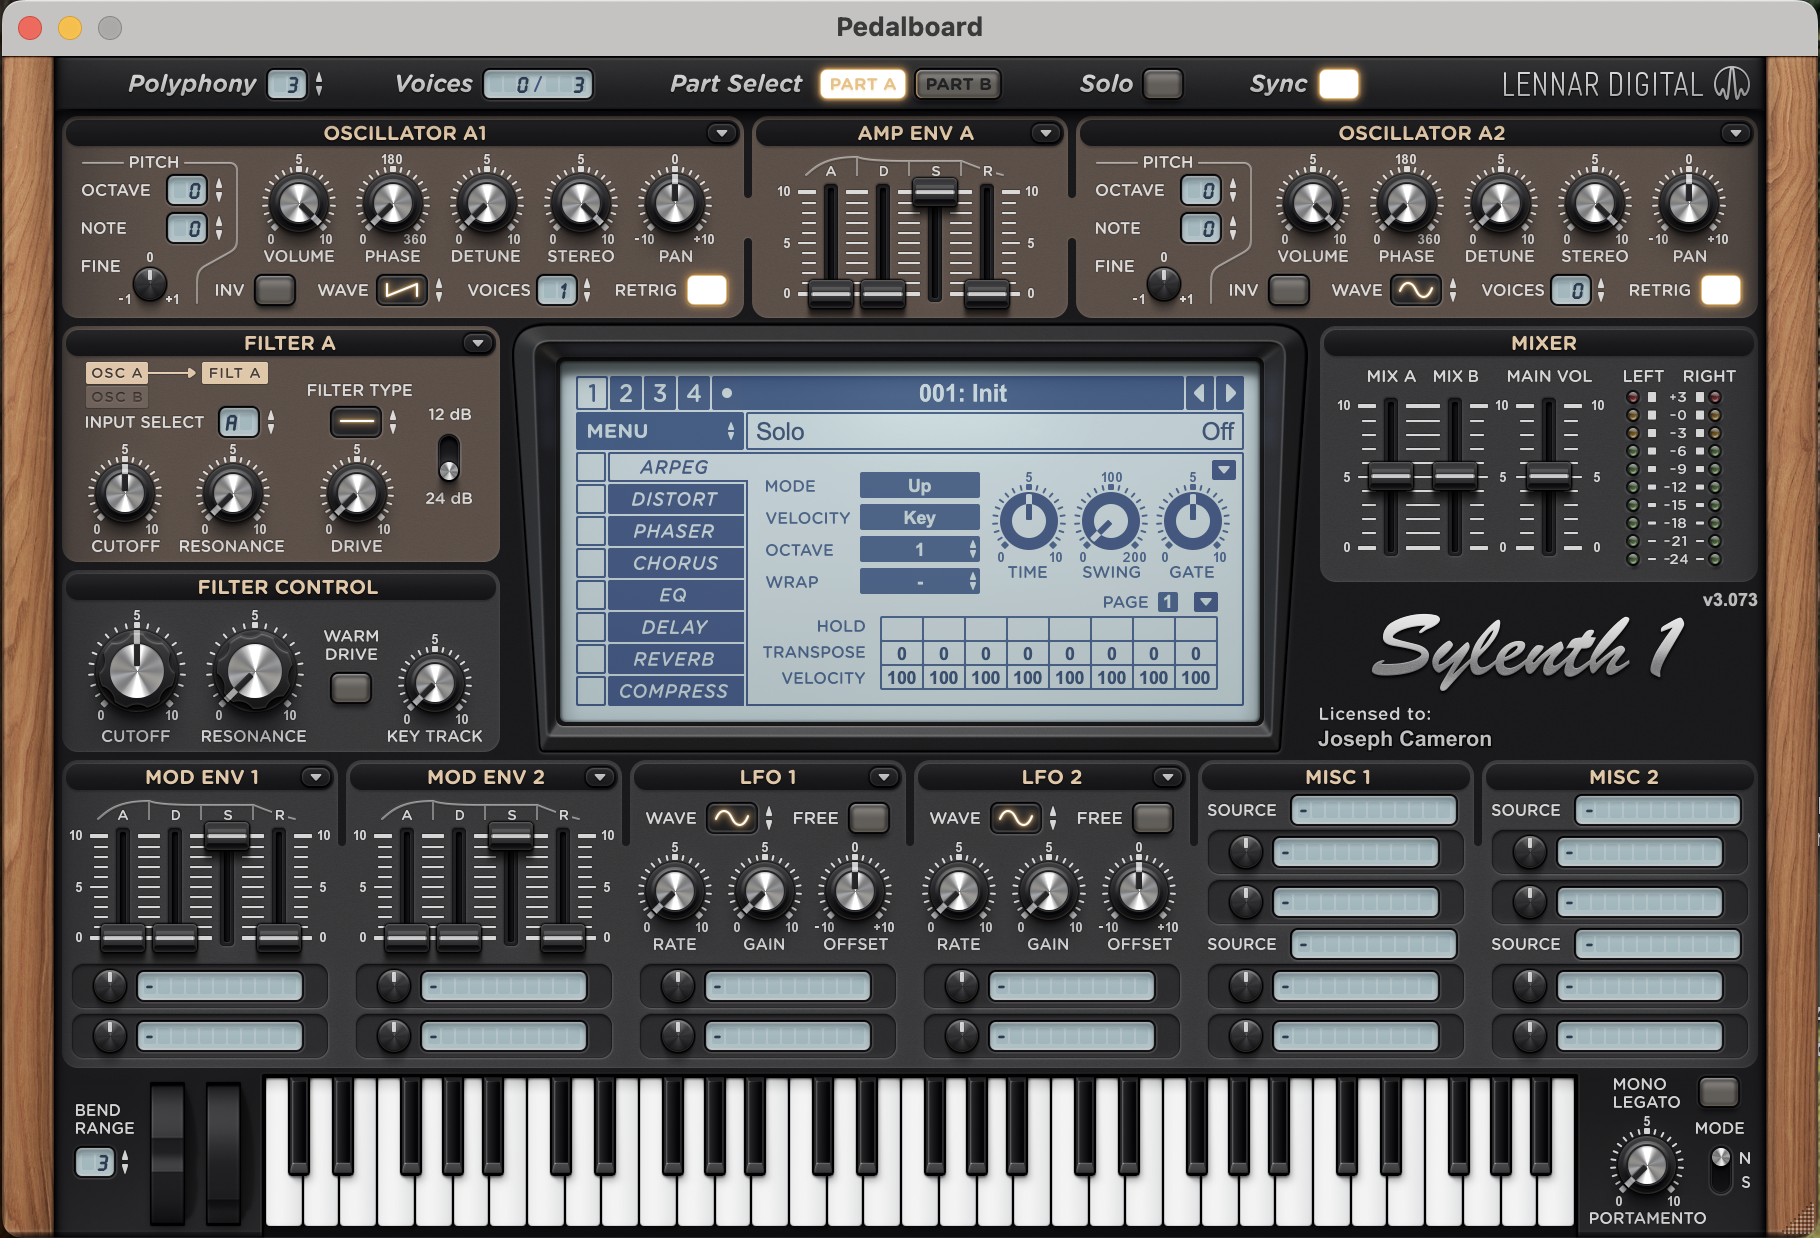
Figure 1
The initial preset of Sylenth1 (LennarDigital, 2007).
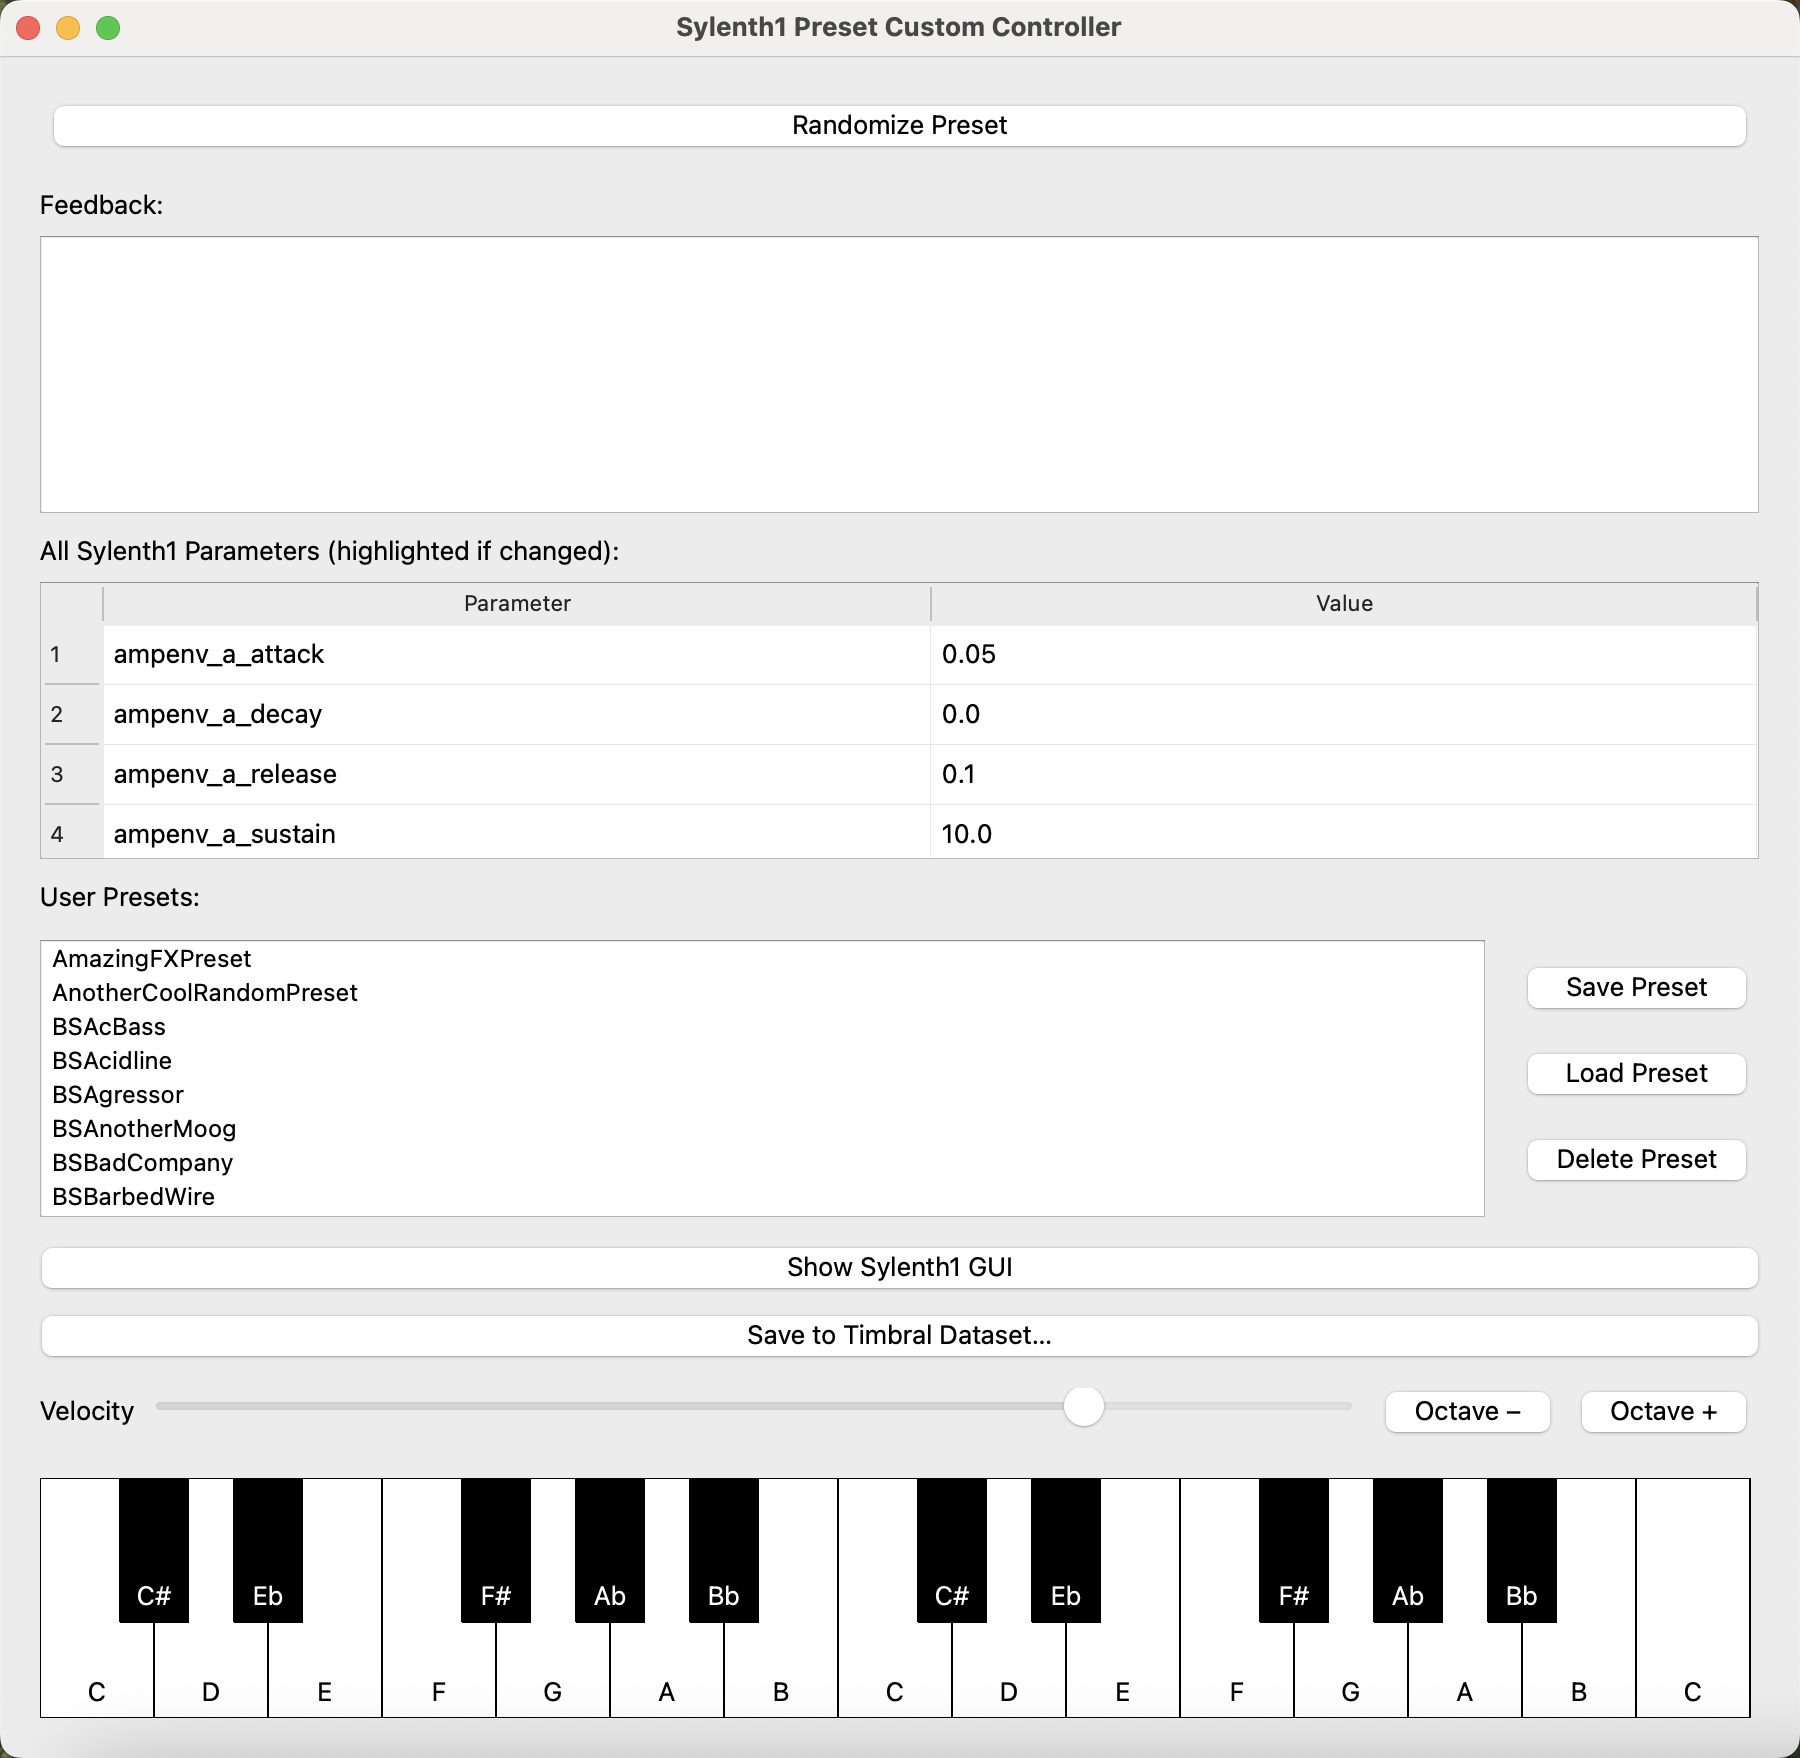
Figure 2
The interface of the custom Python application for interacting with Sylenth1.
Table 1
Parameter accounting for the Sylenth1‑10KPresets Dataset. The canonical 179‑dimensional schema arises by removing the 67 controls listed in this section from the 246 the plugin exposes; factory entries additionally carry the three modulation flags listed below but these are dropped from analysis so that factory and random entries share an identical schema.
| Parameter Group | Count |
|---|---|
| Raw plugin parameters (VST3 host) | 246 |
| Excluded (arp/pitch/volume/bypass) | 67 |
| Canonical timbre‑relevant parameters | 179 |
| of which float (all non‑constant) | 106 |
| of which enum | 55 |
| of which bool | 18 |
| Factory‑only retained keys (lfo_1_free, lfo_2_free, solo) | 3 |
| Per‑row schema, factory entries | 182 |
| Per‑row schema, random entries | 179 |
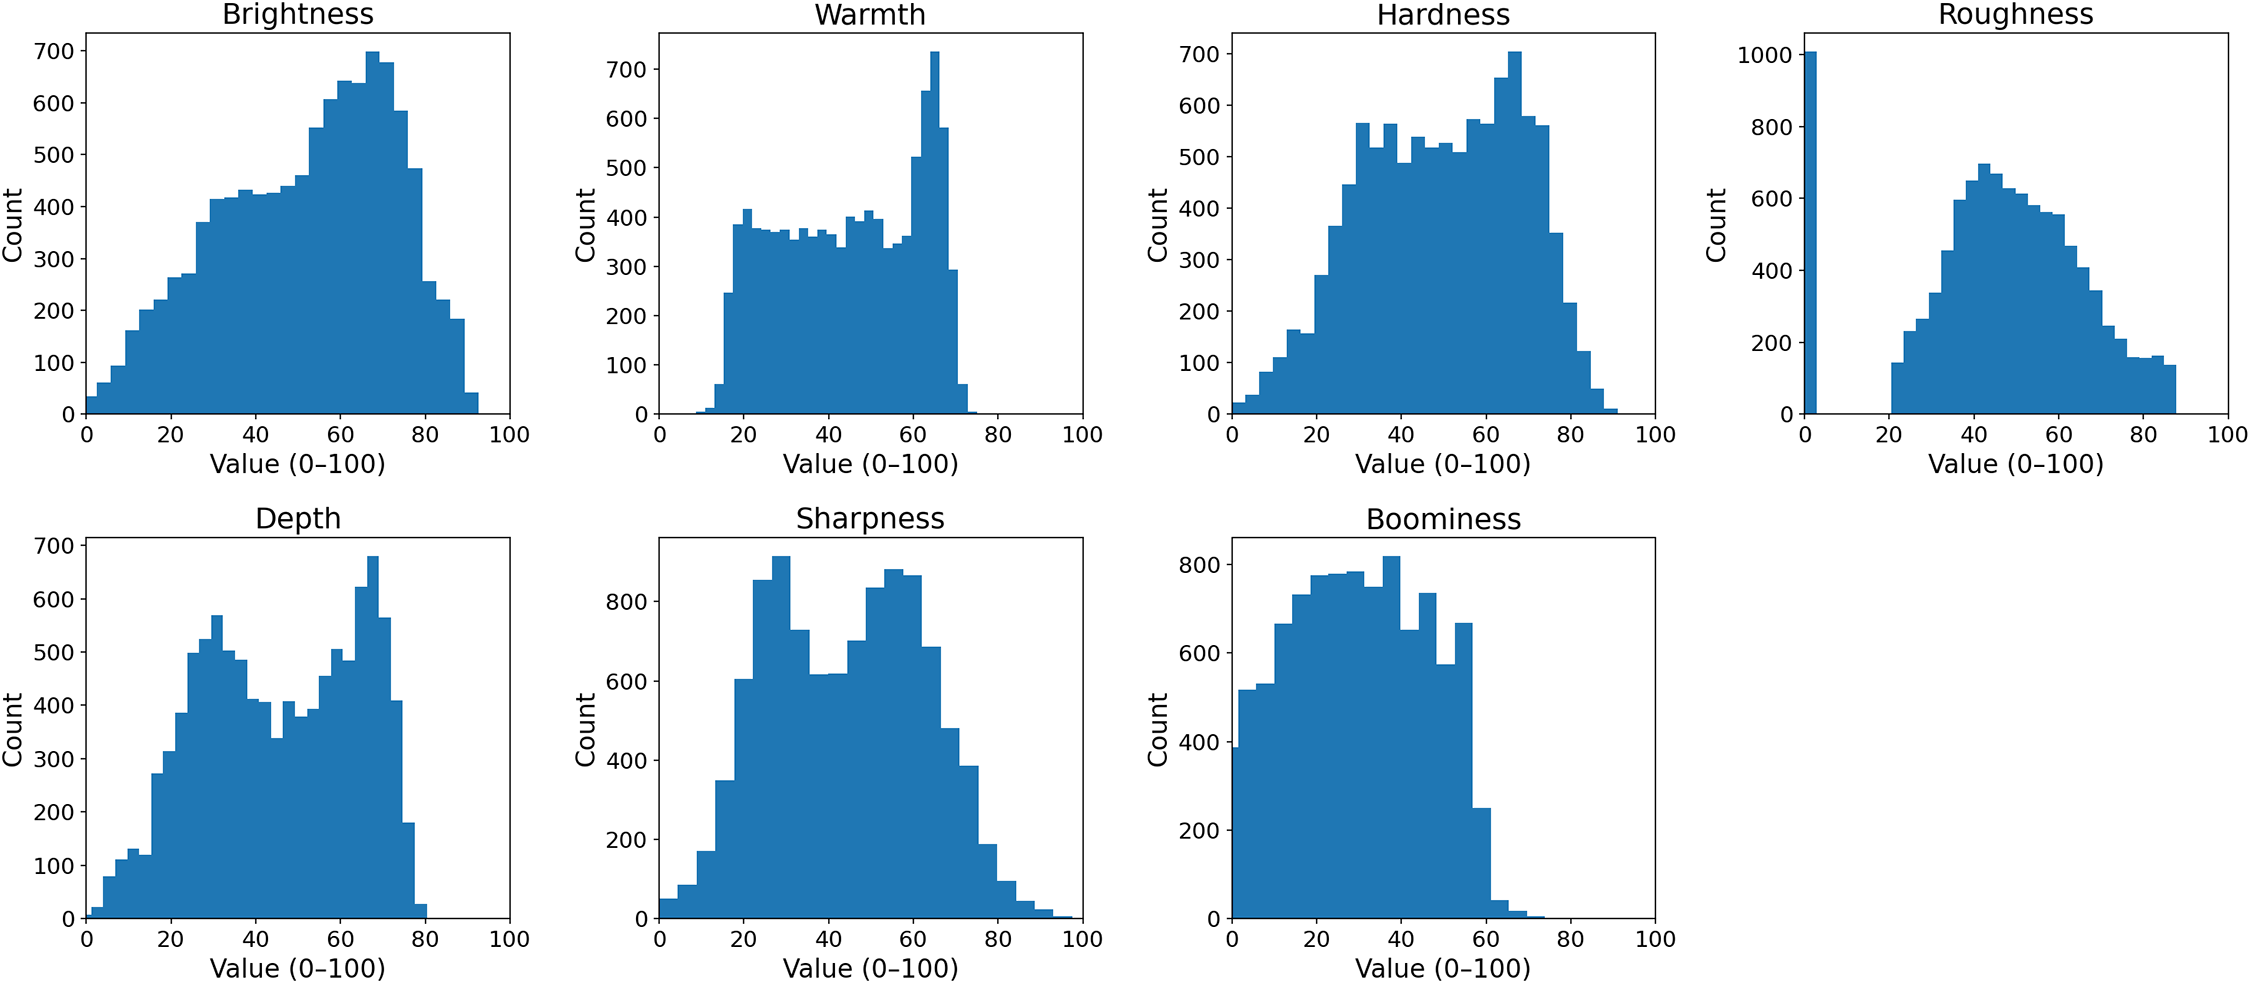
Figure 3
Distributions of the 7 AudioCommons timbral models over all 10,292 presets. Each panel shows a histogram on the common 0–100 scale.
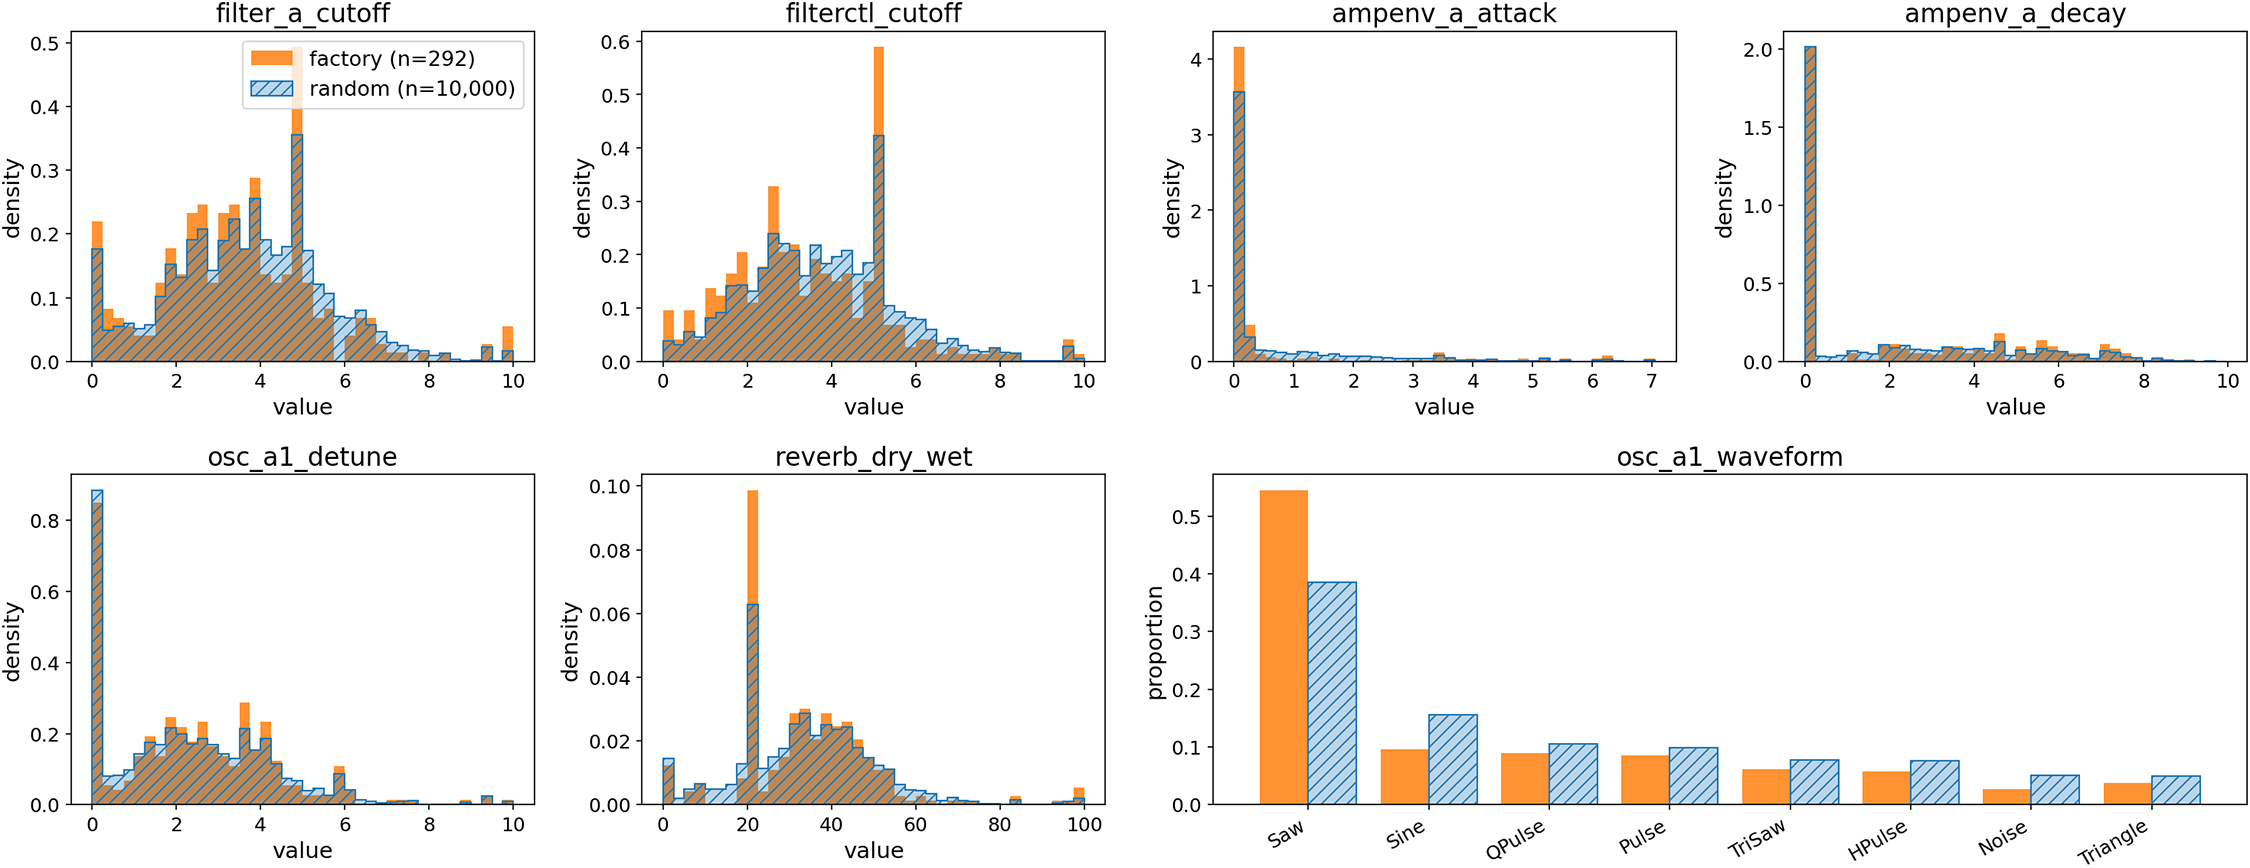
Figure 4
Factory versus random distributions for seven representative Sylenth1 parameters, grouped by function (filtering, envelope shaping, oscillator, effects, categorical waveform). Numeric panels overlay density‑normalized histograms of the factory presets (solid orange, ) and the random presets (blue diagonal hatching, ) on shared axes, so the two populations are directly comparable despite the order‑of‑magnitude size difference; where the random density falls below the factory density, the hatching remains visible over the taller orange bar. The categorical waveform panel uses side‑by‑side proportion bars with the same encoding. Distributions for the remaining parameters follow the same pattern and are provided in the dataset repository.
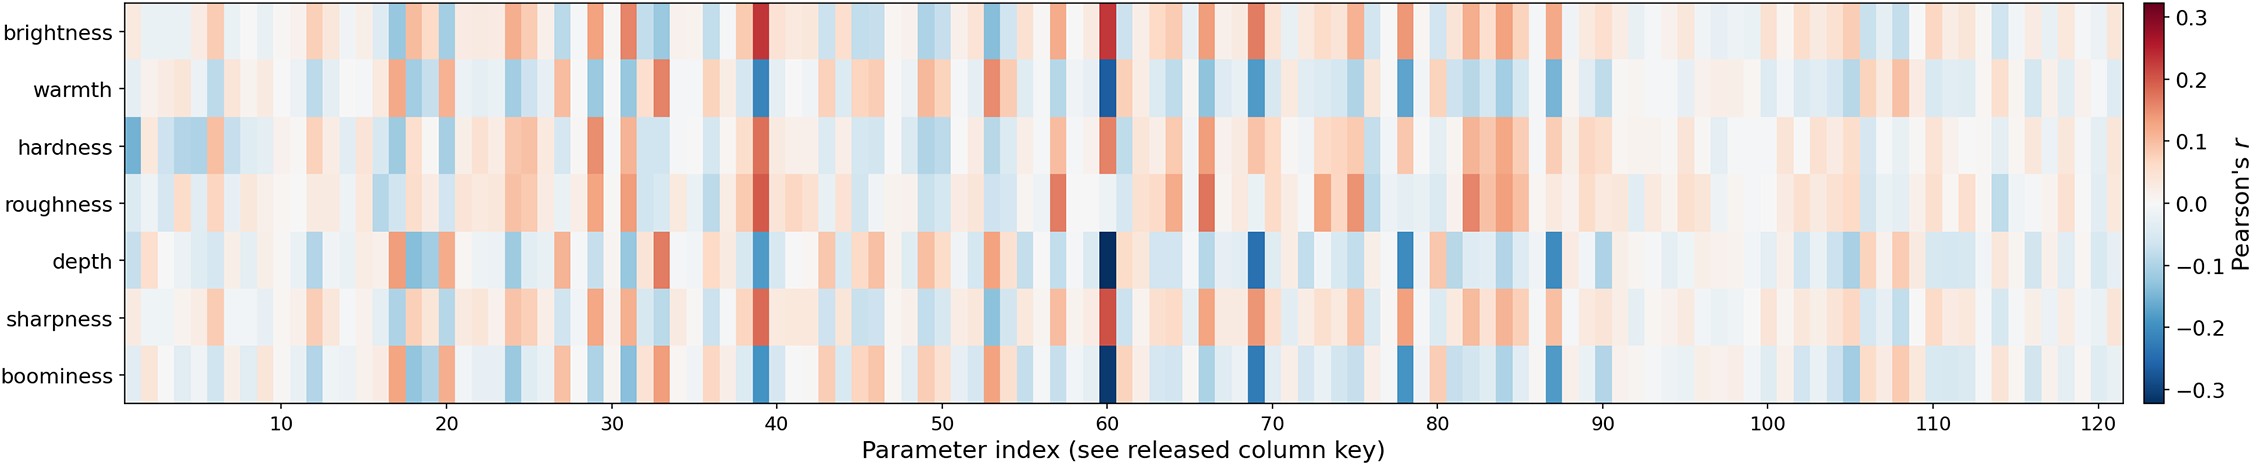
Figure 5
Pearson correlations between the 121 numeric Sylenth1 parameters (columns, indexed alphabetically; the full index‑to‑ name key is released in the dataset repository) and the 7 AudioCommons timbral models (rows) over all 10,292 presets. The color scale is normalized to the observed correlation range (deep red strongest positive, deep blue strongest negative, ) rather than the theoretical . The strongest correlates are named in the text.
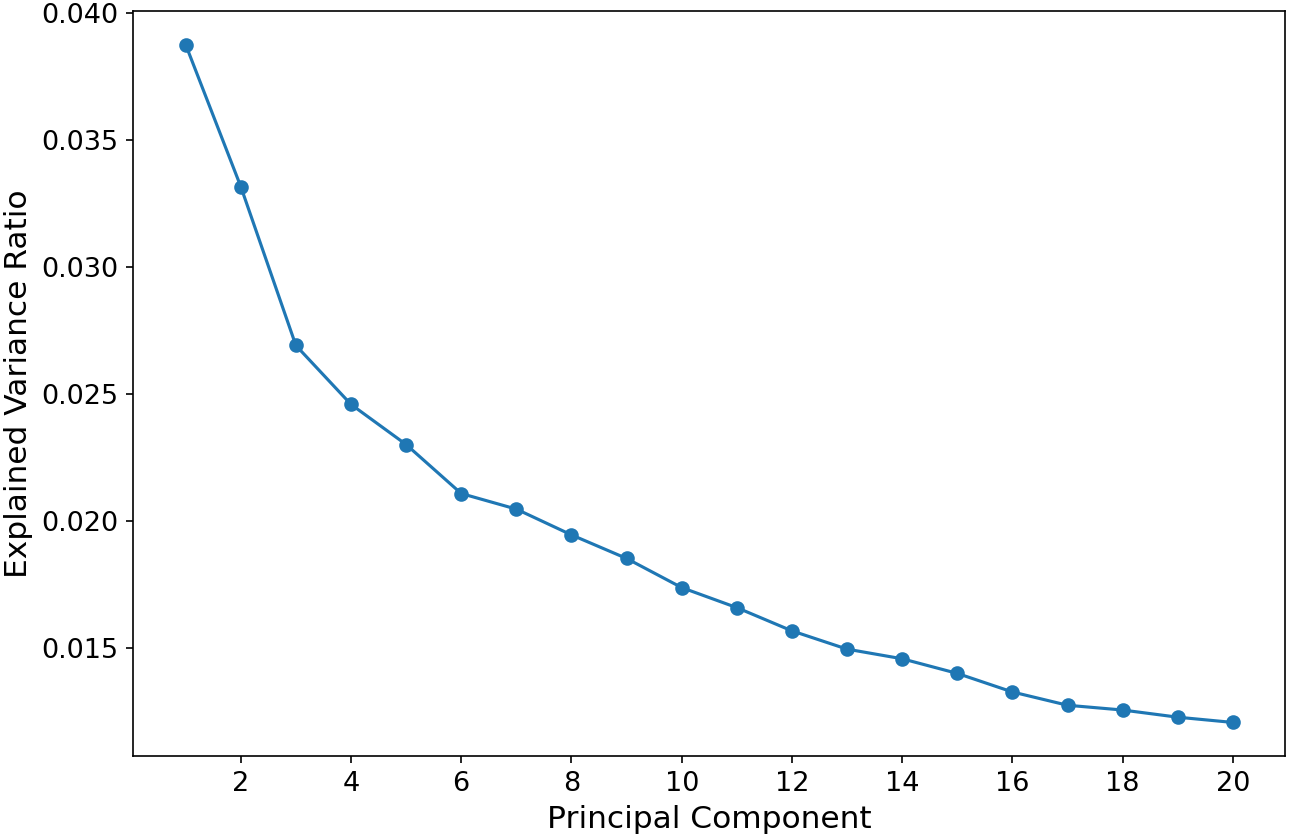
Figure 6
PCA scree plot showing explained variance ratio for the first 20 principal components computed over all 10,292 presets.
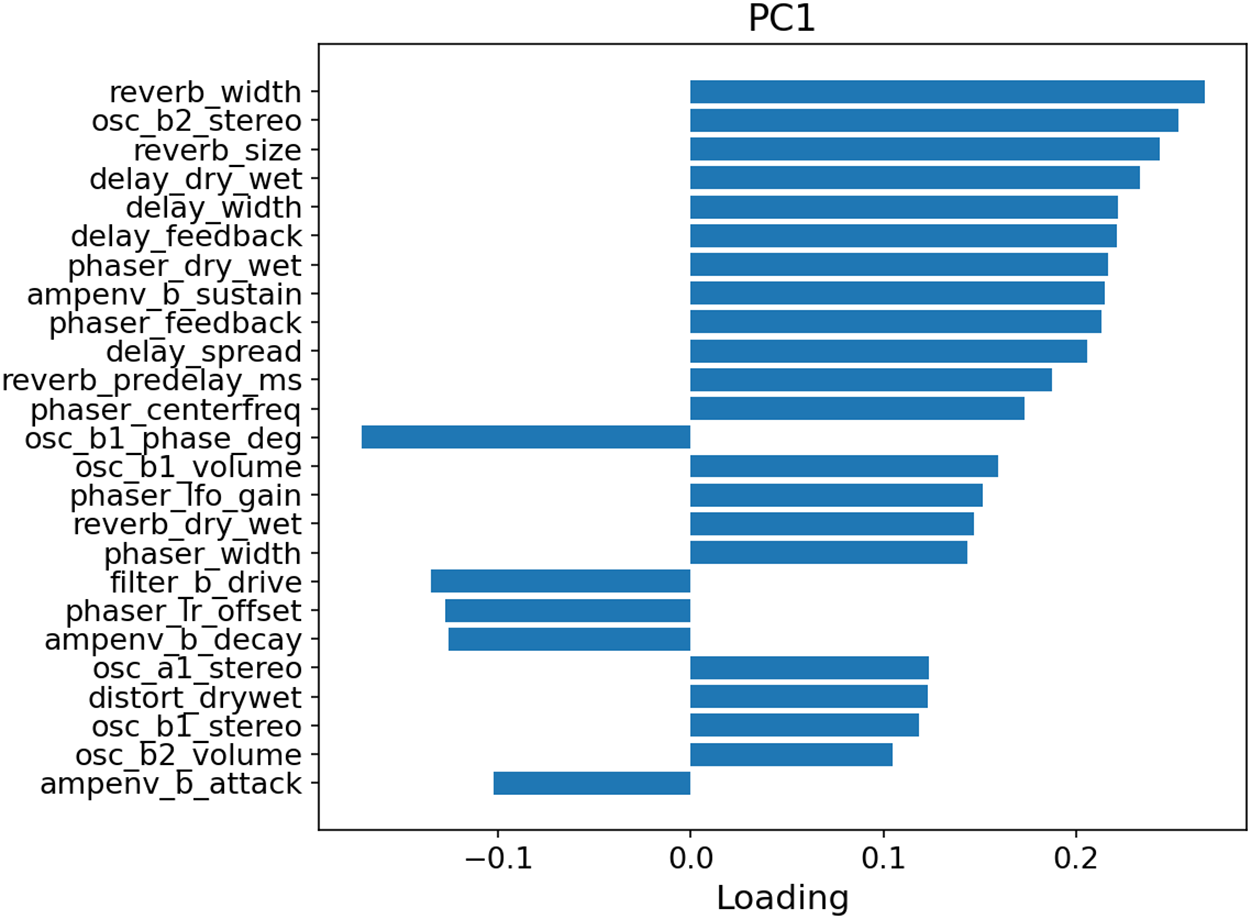
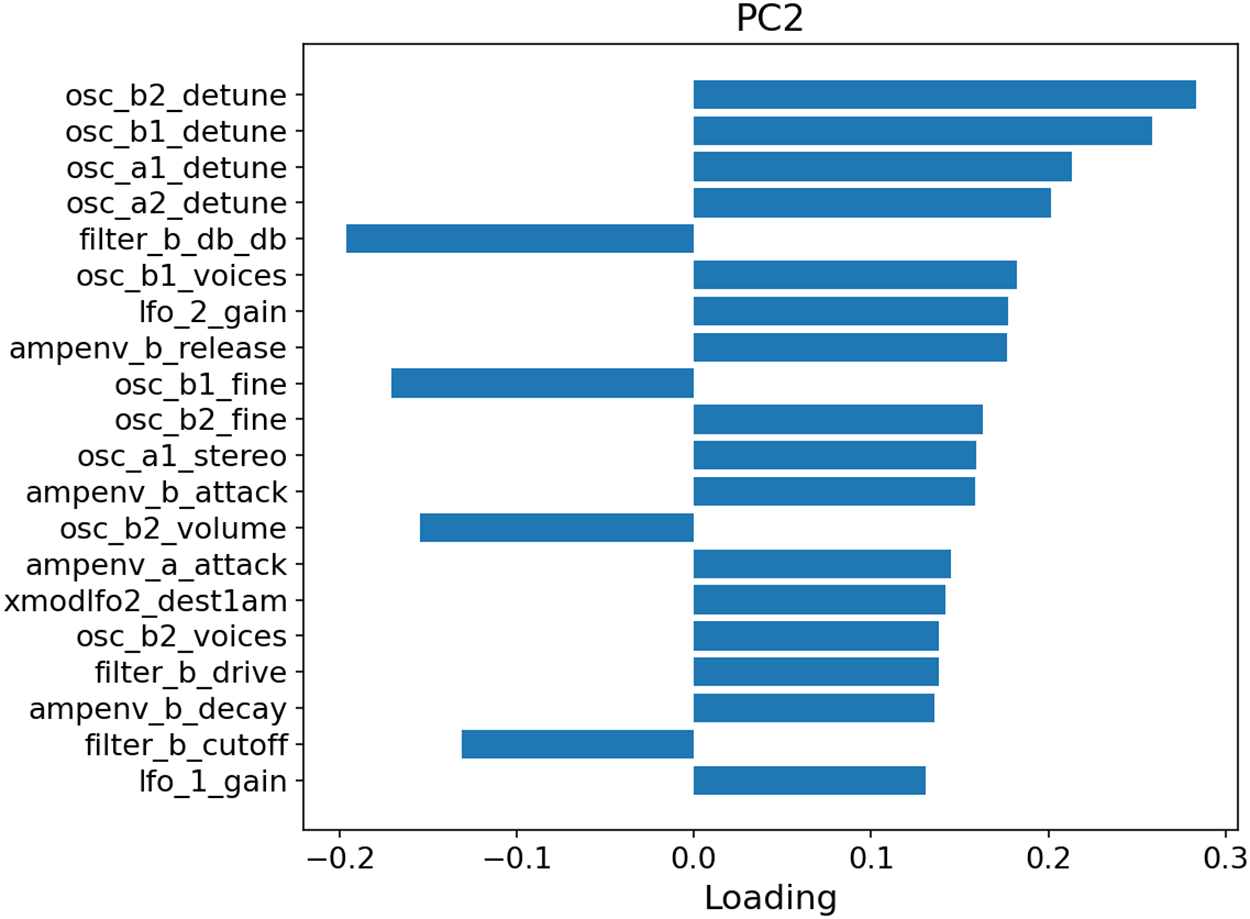
Figure 7
Top parameter loadings for PC1 (top) and PC2 (bottom). PC1 is dominated by reverb, delay, phaser, and envelope parameters, while PC2 is dominated by oscillator detune, voice count, and filter slope.
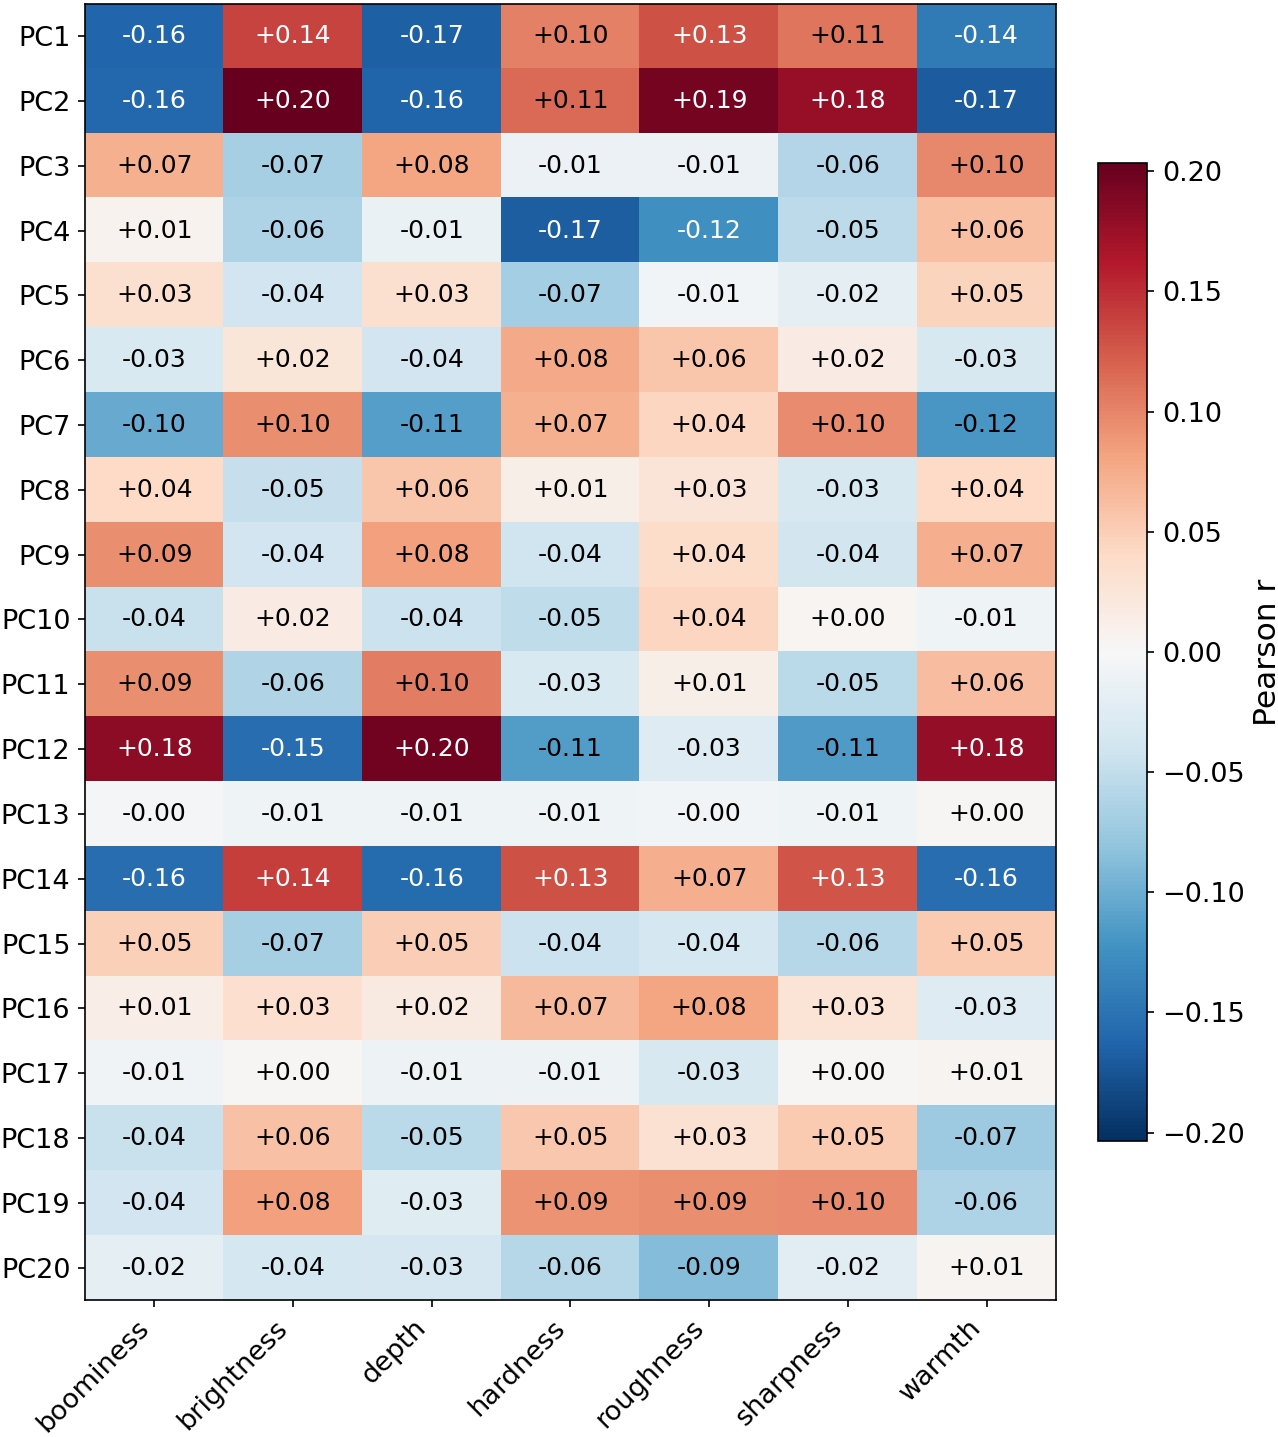
Figure 8
Correlation matrix between the first 20 principal components (rows) and the 7 AudioCommons timbral models (columns), with per‑cell Pearson’s annotated. The diverging color scale is normalized to the observed correlation range (; deep red strongest positive, deep blue strongest negative) rather than the theoretical .
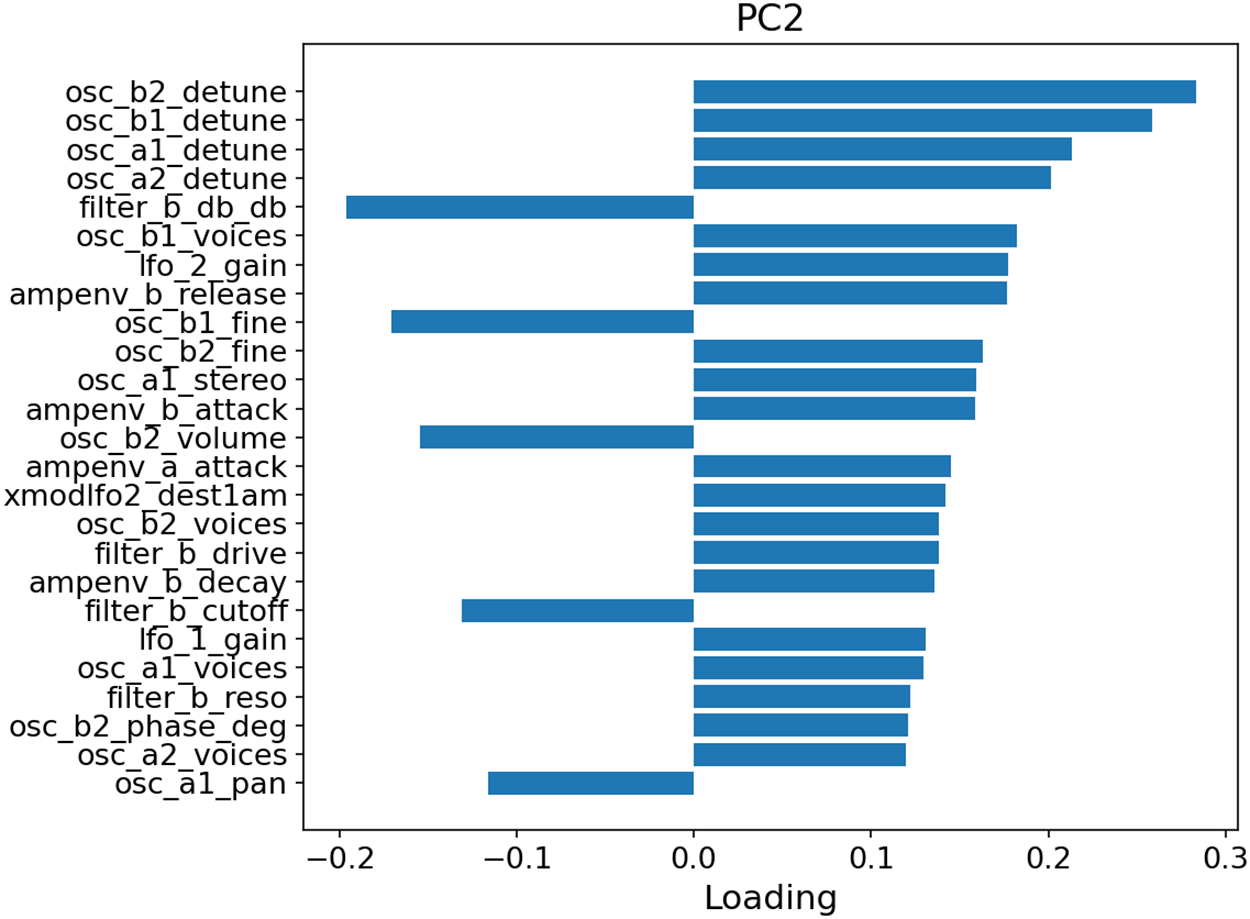
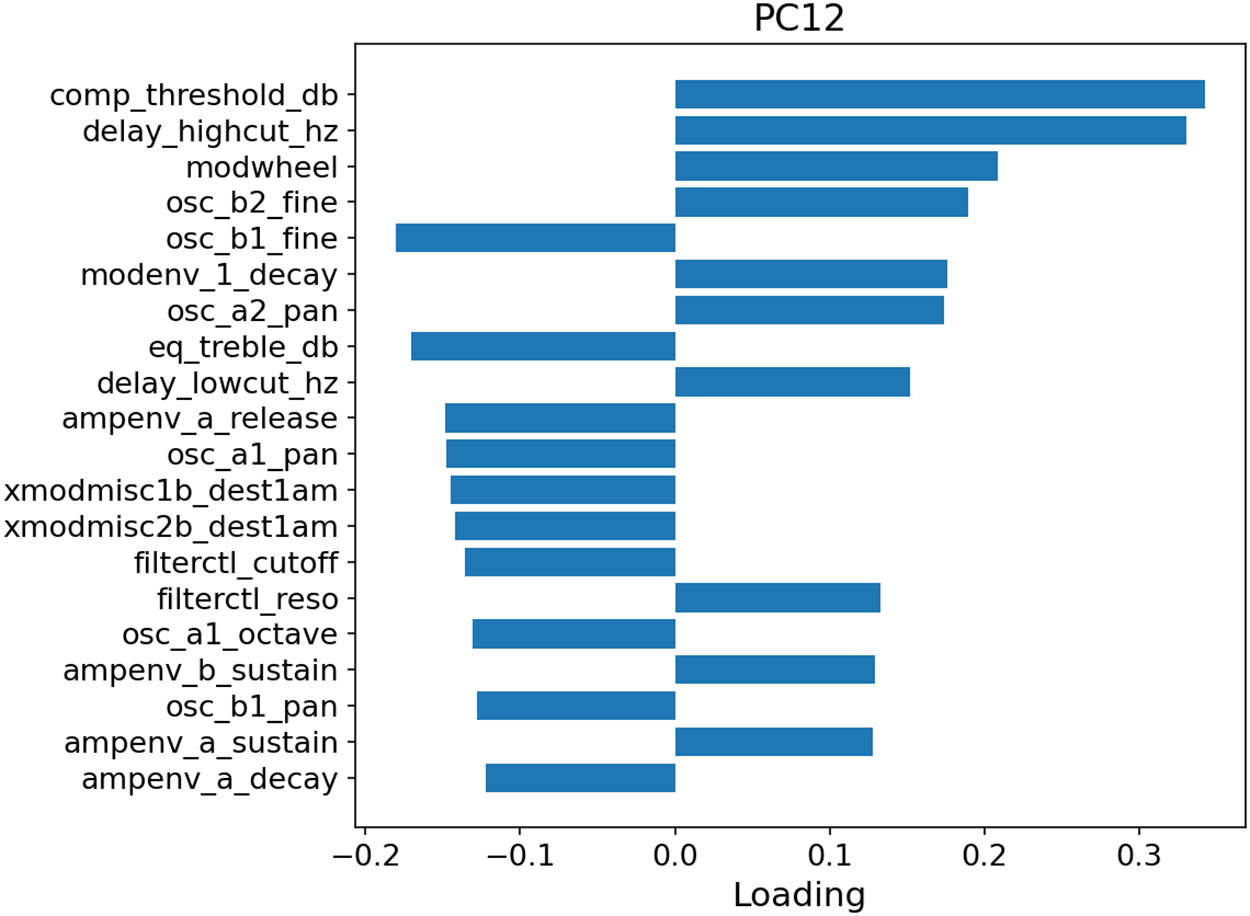
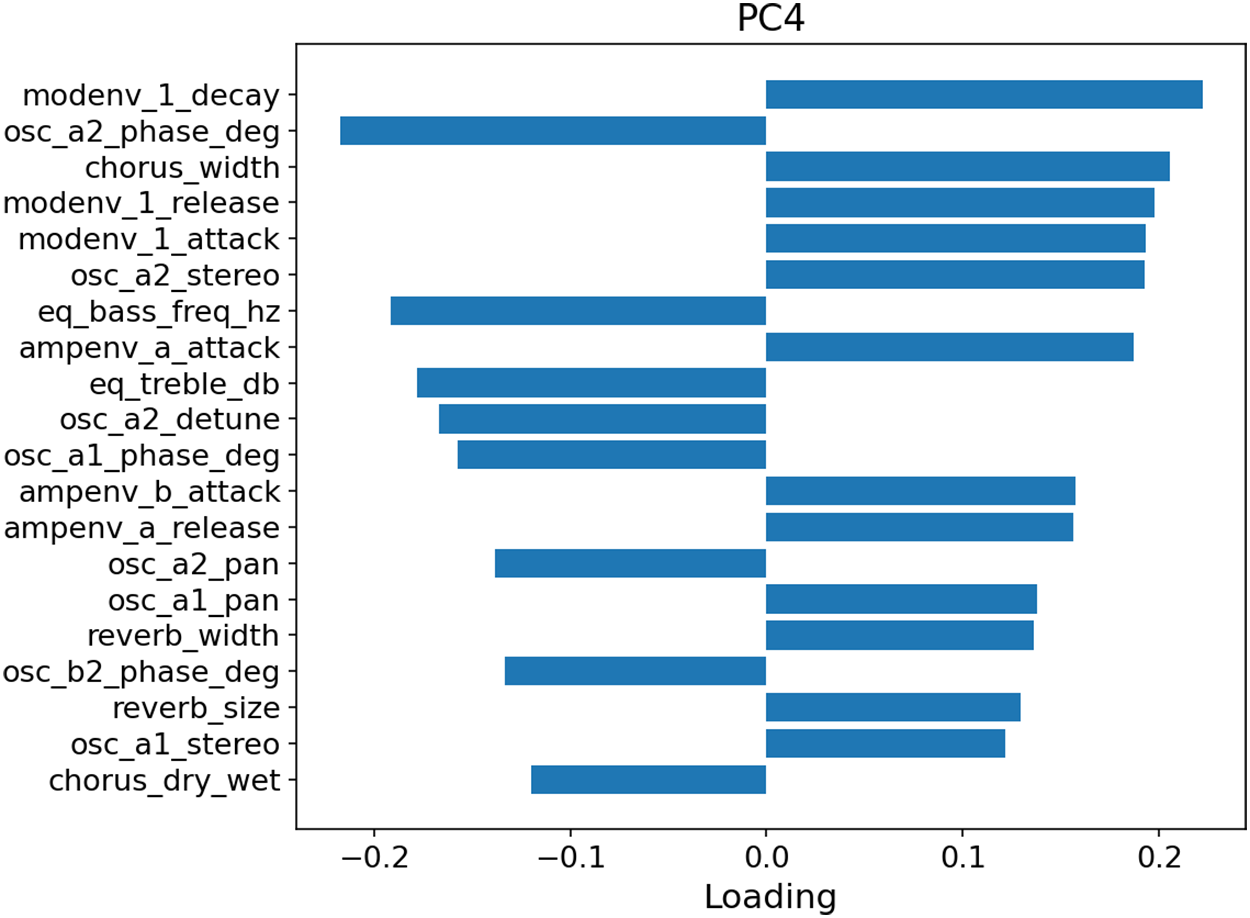
Figure 9
Top 20 parameter loadings for the 3 principal components most strongly correlated with the AudioCommons descriptors: PC2 (top; strongest for brightness, also drives sharpness and roughness), PC12 (middle; strongest for warmth, also drives depth and boominess), and PC4 (bottom; strongest for hardness).
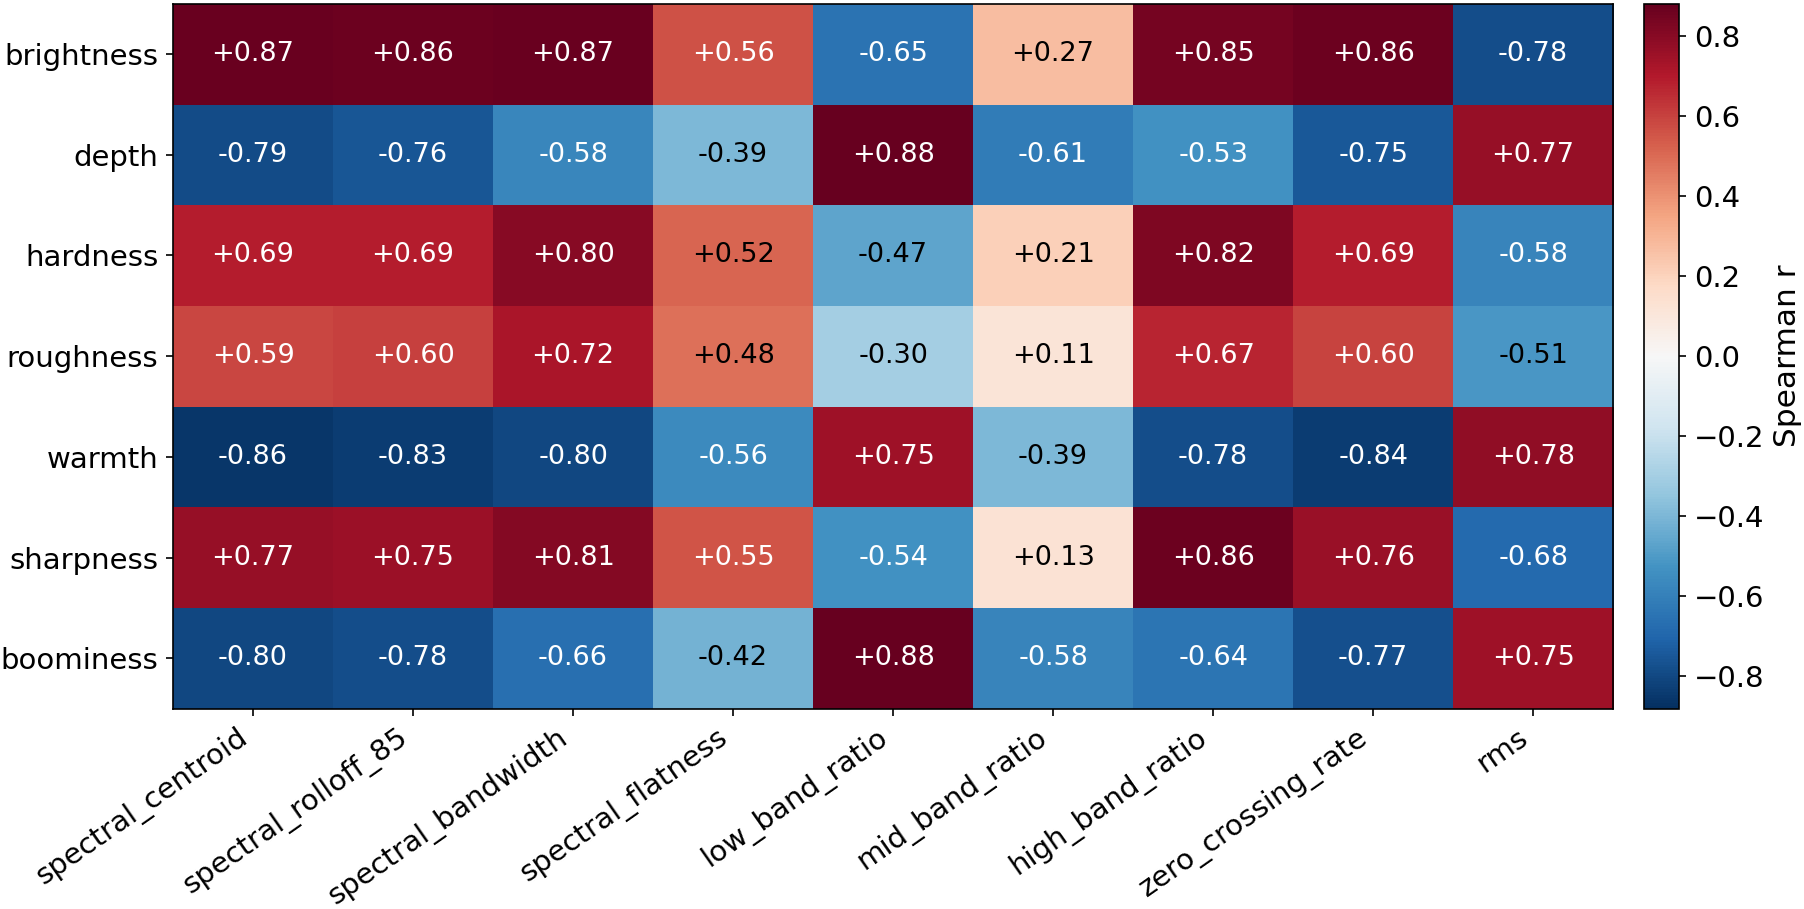
Figure 10
Spearman rank correlations between the 7 AudioCommons descriptors (rows) and 9 simple librosa acoustic features (columns) over all 9,998 random preset renders. Cells annotated with ; the diverging color scale is normalized to the observed correlation range (; deep red strongest positive, deep blue strongest negative). Brightness, depth, boominess, warmth, and sharpness show strong correlations with their expected acoustic predictors; roughness is the only descriptor without a dedicated psychoacoustic predictor in this feature set (see text).
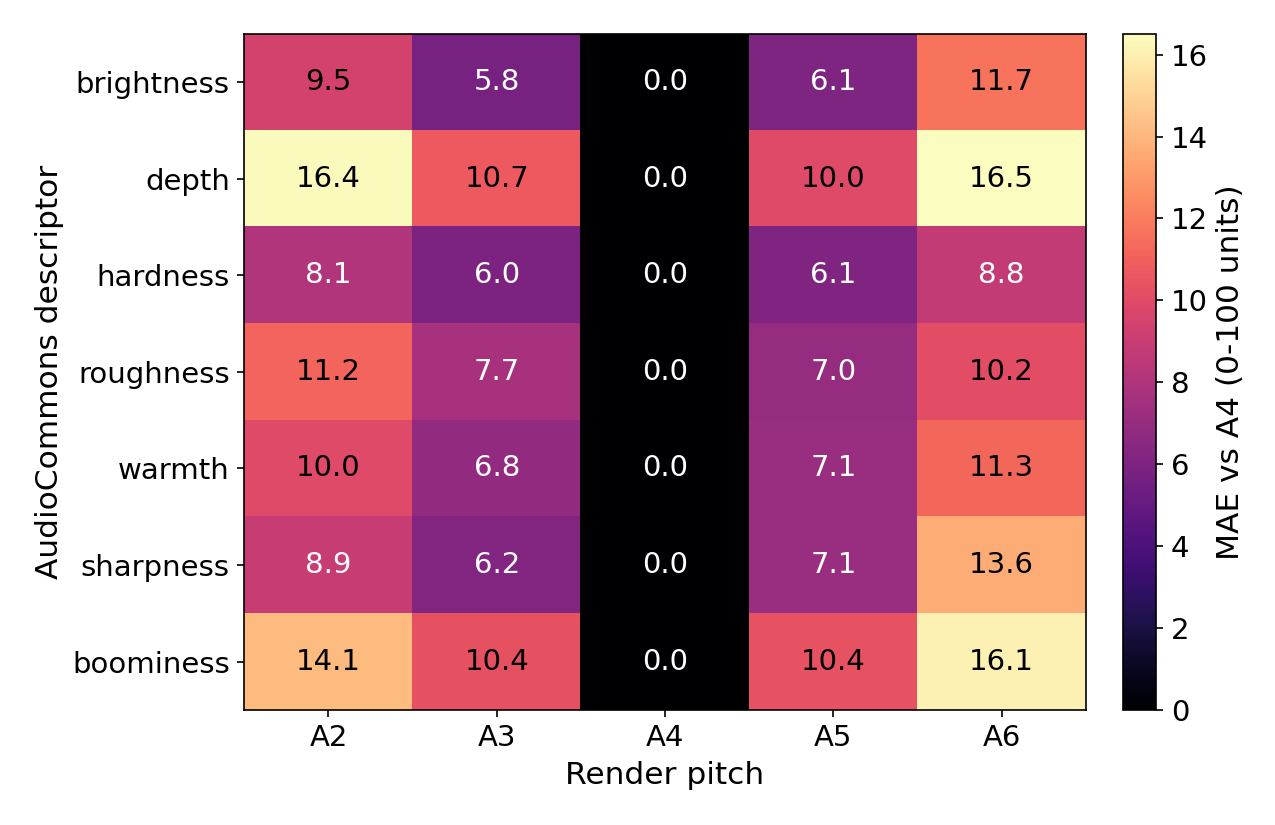
Figure 11
Mean deviation from A4 per (descriptor, pitch) on the 0–100 AudioCommons scale, for the stratified n = 200 multipitch subset. Cells are annotated with the numerical value; the color scale spans the observed min/max. Depth and boominess shift the most (16 units at extremes); hardness is the most pitch‑invariant.
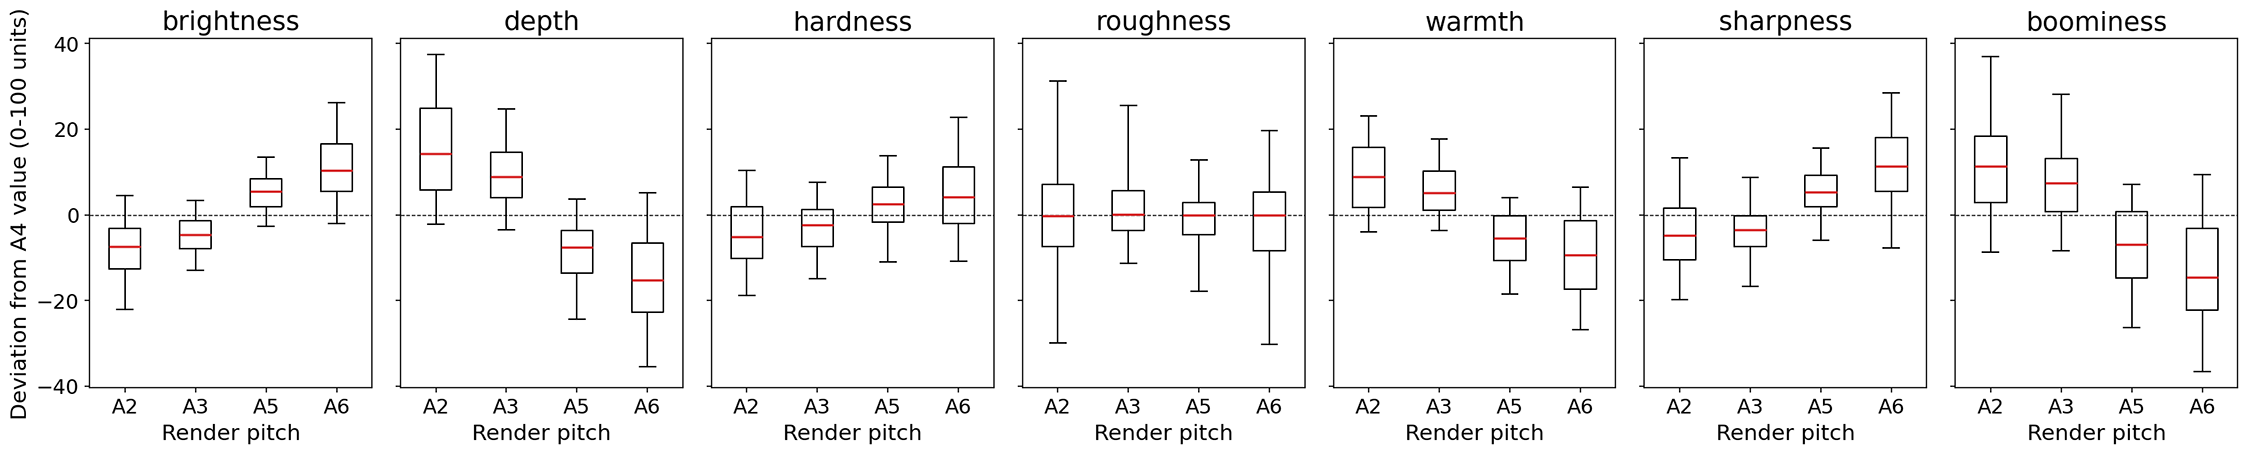
Figure 12
Per‑preset signed deviations from the A4 descriptor value at each render pitch (boxes: median and inter‑quartile range; whiskers: 5th–95th percentile; dashed line: no deviation), for the stratified multipitch subset. The shifts are directional: brightness and sharpness read lower at A2 and higher at A6, while depth, boominess, and warmth shift in the opposite direction; hardness and roughness are closest to symmetric about zero.
Table 2
Parameter descriptor regression on the test split (), per‑descriptor and macro MAE in 0–100 units. Lower is better. The mean predictor and ridge regression are deterministic; MLP cells report mean standard deviation over four training seeds (0–3). The MLP wins on every descriptor; roughness is the hardest, warmth the easiest. The lowest macro MAE and the lowest per‑descriptor MAE, both achieved by the MLP, are shown in bold.
| Method | bright. | depth | hard. | rough. | warm. | sharp. | boom. | macro |
|---|---|---|---|---|---|---|---|---|
| Mean predictor | 17.26 | 15.65 | 15.94 | 16.24 | 14.31 | 16.06 | 15.02 | 15.78 |
| Ridge | 12.78 | 11.83 | 12.26 | 12.89 | 10.36 | 12.76 | 11.81 | 12.10 |
| MLP | 11.160.19 | 10.570.10 | 10.740.17 | 12.050.28 | 8.910.08 | 11.290.23 | 10.760.19 | 10.780.12 |
Table 3
Descriptor parameter inversion on the test split (), per‑descriptor and macro round‑trip MAE in 0–100 units, along with audibility and validity rates. NN retrieval is fully deterministic and is reported from a single run; CVAE cells report mean standard deviation over four training seeds (0–3), with the audibility rate seed‑averaged. Validity was 100% for every method at every seed. NN retrieval sits at the pipeline noise floor on every descriptor; the CVAE is provided as released training infrastructure for future work and does not match the retrieval anchor on this single‑sample metric at any seed. The lowest macro MAE and the lowest per‑descriptor MAE, both achieved by NN retrieval, are shown in bold.
| Method | bright. | depth | hard. | rough. | warm. | sharp. | boom. | macro | audible |
|---|---|---|---|---|---|---|---|---|---|
| NN retrieval | 2.43 | 3.18 | 3.65 | 3.41 | 2.22 | 2.87 | 2.79 | 2.94 | 100.0% |
| CVAE () | 14.420.26 | 11.530.39 | 15.100.35 | 17.520.71 | 10.960.20 | 15.290.27 | 12.100.55 | 13.850.32 | 100.0% |
| CVAE () | 17.413.56 | 16.865.42 | 18.134.75 | 21.759.58 | 12.892.69 | 15.733.74 | 15.793.10 | 16.942.33 | 90.6% |