
1 Introduction
Preset‑based sound design is a cornerstone of modern music production, yet research on synthesizer presets remains limited by a lack of structured, machine‑readable data. Commercial software instruments such as Sylenth1,1 Serum,2 Massive,3 and Diva4 ship with hundreds to thousands of factory presets designed by expert sound designers (e.g., 512 for Sylenth1; over 1,200 for Diva), but these resources are rarely used as systematic corpora for research in Music Information Retrieval (MIR), machine learning, or timbre understanding. While the MIR community has made significant advances in modeling timbre and synthesizer characteristics from audio (e.g., NSynth (Engel et al., 2017), DDSP (Engel et al., 2020), AudioCommons (Pearce et al., 2017b; 2019)), there remains a fundamental gap: the direct relationship between synthesizer parameters, preset structure, and resulting timbre has not been extensively explored at scale.
This article introduces Sylenth1‑10KPresets,5 a dataset of 10,292 synthesizer presets for Sylenth1: 10,000 statistically generated random presets combined with 292 original factory presets, each annotated with AudioCommons timbral model predictions computed from a rendered A4 note. The dataset ships the full parameter dictionary for each preset, enabling reproducible synthesis from parameters alone, alongside the rendered A4 audio for both factory and random subsets. The presets are produced by a factory‑conditioned randomization pipeline that samples from kernel density estimation (KDE) distributions fitted on factory parameter values, controls sparsity for categorical and numeric controls, prevents silent or low‑energy patches, and pairs each preset with the seven AudioCommons timbral descriptors (brightness, hardness, warmth, roughness, depth, sharpness, boominess).
The scope of this release is deliberately narrow in one important respect: all presets, renders, and annotations come from a single subtractive synthesizer (Sylenth1), rendered at a single pitch (A4). This focus buys properties that multi‑instrument audio corpora cannot provide: exact parameter‑level ground truth, a uniform rendering and normalization chain, and controlled comparability across all 10,292 entries. The cost is generality across synthesis architectures and pitch registers. We state this scope up front so that the analyses and baselines that follow can be weighed accordingly; Section 7 treats the resulting limitations in full.
By coupling parameter‑level synthesis data with perceptual timbre descriptors, Sylenth1‑10KPresets supports research at the intersection of MIR, synthesis, timbre modeling, and generative machine learning. Unlike NSynth or AudioSet‑derived resources, which treat timbre as an emergent property of waveform data, this dataset exposes the ground‑truth parameter space from which different types of timbres occur, enabling parameter–descriptor inference, predictive models from parameter settings, generative models conditioned on human‑readable semantic features rather than low‑level spectral coefficients, large‑scale statistical analysis of preset structures, interactive synthesizer interfaces, and studies of the distributional differences between factory and algorithmically generated presets.
Contributions. This work makes the following contributions:
A publicly available dataset of 10,292 synthesizer presets for Sylenth1, including full parameter configurations and AudioCommons timbral descriptor annotations for both the 292 factory presets and the 10,000 parametrically sampled random presets, with rendered audio for both subsets.
A reproducible preset generation framework, including parameter sampling, silent‑patch avoidance, and descriptor annotation code.
A statistical analysis of parameter distributions, preset diversity, and timbre characteristics across both factory and randomized presets, including principal component analysis (PCA) of numerical parameters and descriptor relationships, together with two empirical analyses of the released annotations themselves: a convergent‑validity check of the AudioCommons labels against simple acoustic features computed directly from the rendered audio (Section 5.4), and a multi‑pitch sensitivity study that quantifies how the AudioCommons descriptors shift across four octaves (Section 5.5).
Three released baseline implementations on a single set of recovery‑based, leakage‑free train/validation/test splits (Section 6.1): a parameter‑to‑descriptor regression baseline, a descriptor‑to‑parameter nearest‑neighbor retrieval baseline, and a conditional variational autoencoder (CVAE) for descriptor‑to‑ parameter inversion, evaluated by re‑rendering generated patches through the same pipeline that built the dataset.
An explicit treatment of the dataset’s limitations, including the scope of AudioCommons label validity on synthesized audio, the pitch‑dependence of the released annotations, and the constraints inherited from focusing on a single subtractive synthesizer (Section 7).
A discussion of research applications in MIR, music AI, semantic sound synthesis, dataset construction, and creative tooling.
By releasing the dataset, the accompanying analysis toolchain, and the three baseline implementations on a single set of splits, we aim to support future work on timbre‑conditioned generative models, interpretable synthesis systems, and human–AI collaboration for sound design.
2 Background and Related Work
Musical timbre modeling and synthesizer sound generation have become active topics in MIR and audio research. Early approaches to automatic synthesizer programming often relied on heuristic or evolutionary strategies, but recent work leverages machine learning to map between audio, semantic descriptors, and synthesizer parameters. In this section, we review prior efforts on timbre modeling for synthesizers, relevant datasets, and interactive semantic control of sound, highlighting how our work builds upon and differs from these.
2.1 Timbre modeling and synthesizer sound generation in MIR
Neural audio synthesis models have opened new possibilities for representing and generating musical timbres. NSynth by Engel et al. (2017) introduced a large dataset of categorized musical notes and a WaveNet‑based autoencoder to learn continuous timbre embeddings, demonstrating that neural models can learn timbre manifolds supporting realistic sound morphing across over 300,000 notes from 1,006 instruments. Differentiable Digital Signal Processing (DDSP) by Engel et al. (2020) combined deep learning with parametric synthesizer elements, using differentiable oscillators and filters as autoencoder components to produce high‑quality instrument audio with interpretable control. Our work is inspired by such approaches that fuse explicit synthesizer control with learned representations. However, whereas DDSP focuses on training end‑to‑end models for audio generation, our goal is to provide a dataset that links audio and semantics to actual synthesizer parameters, facilitating research on parameter inference and timbre control.
Researchers have also explored variational autoencoders (VAEs) for synthesizer sound design. Esling et al. (2020) introduced the Flow Synthesizer, using a VAE with normalizing flows to learn invertible mappings between audio and synthesizer presets. Follow‑up work extended these models to complex commercial synthesizers, including auto‑programming a Yamaha DX7 with 144 parameters by encoding presets in VAE latent space (Vaillant et al., 2021). These advances show that deep generative models can capture high‑dimensional parameter spaces and enable perceptually meaningful preset interpolation. Our work contributes to this line of research by providing a new dataset to train and evaluate these models, one that includes semantic descriptors to tie latent space to human‑understandable timbre qualities.
Another closely related effort by Yutani et al. (2024) proposes a CVAE for wavetable synthesis, allowing timbre control via semantic labels (‘bright,’ ‘warm,’ ‘rich’). This demonstrates the feasibility of semantic control in synthesis, where users morph timbre using perceptual terms rather than tweaking low‑level knobs. Our work shares this motivation, leveraging timbral descriptors as a core dataset component. In contrast to Yutani et al.’s work (specific to wavetable synthesis with three labels), our dataset provides broader synthesizer coverage with seven semantic timbre labels, suitable for training more generalizable models.
2.2 Datasets for timbre and synthesizer sounds
Large‑scale datasets have been crucial in advancing audio and MIR research. AudioSet (Gemmeke et al., 2017) provides over 2 million 10‑second clips covering 632 audio event classes, offering broad coverage of real‑world sounds but without fine‑grained control parameters or perceptual timbre annotations. For musical instrumental sounds, the NSynth dataset (Engel et al., 2017) serves as a large resource of labeled notes, providing audio and pitch labels from many instruments. However, NSynth does not include ground‑truth synthesizer parameters that produced those notes (when the source is synthetic), nor human descriptors of timbre. Thus, researchers training on NSynth treat it as audio‑only, without explicit links to controllable parameters.
To address paired audio‑parameter data, synth1B1 by Turian et al. (2021) created a massive corpus of one billion synthesized sounds using torchsynth, a GPU‑accelerated modular synthesizer. Each 4‑second sound is accompanied by exact synthesis parameters, providing virtually limitless paired training data. However, because it is generated automatically by random parameter settings, sounds are not curated for semantic qualities—many will be musically irrelevant or imperceptibly different to human ears. Our work takes a different approach: rather than brute‑force generation, we curate a manageable but rich dataset emphasizing perceptual relevance. Crucially, we include semantic timbral descriptors for each sound, information absent from synth1B1. This allows training models to not just replicate audio, but to understand and predict human descriptions of sounds.
2.3 Semantic descriptors and interactive sound synthesis
There is growing interest in using semantic audio descriptors for retrieval and control of sounds, motivated by both MIR applications and human–computer interaction (HCI) considerations. The AudioCommons project (Pearce et al., 2017b; 2019) was a significant effort in this direction. Pearce et al. (2017b) identified perceptually meaningful timbral attributes through user‑centered methodology combining literature review, workshops with sound designers, card‑sorting studies, and iterative validation in real‑world contexts. This ensured terms such as ‘brightness,’ ‘warmth,’ ‘roughness,’ and ‘boominess’ aligned with both perceptual psychology and professional sound‑design practice. The University of Surrey developed algorithms to automatically estimate these attributes from audio, yielding the AudioCommons timbral models (Pearce et al., 2019). They modeled eight timbral dimensions (hardness, depth, brightness, roughness, warmth, sharpness, boominess, and reverberation) with acoustic feature extractors and regression models. The toolset was integrated into an exploratory interface for Freesound (Pearce, 2019), allowing users to search sound effects via timbre adjectives, demonstrating the power of semantic descriptors in navigating sound libraries.
Our work leverages these AudioCommons timbral descriptors as a key component. By annotating synthesizer sounds with attributes predicted by AudioCommons models, we enable semantic query and control. This is particularly important for interactive sound design. Synthesizers present a usability challenge called the synthesizer programming problem (Kreković, 2019; Shier, 2021): they expose dozens or hundreds of technical parameters, powerful but daunting for many musicians. Studies show that most musicians rely heavily on presets. Seago et al. (2004) found 9 out of 10 Yamaha DX7 units contained only factory presets, pointing to a need for more intuitive, higher‑level interfaces.
Recent HCI research confirms this need. SynthScribe (Brade et al., 2024) provides multimodal tools for synthesizer sound retrieval, allowing users to search preset libraries using text descriptors or example sounds, and supports semantic transformations (e.g., ‘make this sound more mellow’) by highlighting relevant parameters. User studies found SynthScribe significantly helped musicians find and tweak sounds. Commercial products have also embraced semantic labeling: Arturia’s Analog Lab V (Arturia, 2025) tags presets with searchable attributes like ‘bright’ and ‘dark.’
Building on this foundation, by incorporating AudioCommons timbral attributes into a synthesizer dataset, we aim to support models that retrieve or generate synth patches from semantic timbre descriptions, which is the inverse‑mapping direction that AudioCommons targeted for sound libraries (Pearce, 2019) and that Yutani et al.’s semantic CVAE demonstrates on a smaller scale. Our dataset is therefore positioned at the intersection of the technical and human‑centric representations advanced by DDSP, Flow Synthesizer, NSynth, AudioCommons, synth1B1, and SynthScribe.
3 Dataset Generation Method
This section details the complete pipeline used to construct the Sylenth1‑10KPresets timbre‑focused dataset, comprising 10,292 presets (292 factory preset patches and 10,000 randomized preset patches). Each preset is represented as a structured JSON entry containing (1) the complete parameter configuration for every editable Sylenth1 control, and (2) a set of seven AudioCommons timbral descriptor model values (brightness, warmth, depth, hardness, sharpness, roughness, boominess) (Pearce et al., 2017b; 2019) computed via audio rendered from the preset’s A4 note (440 Hz, MIDI note pitch of 69). All stages, from preset extraction and parameter normalization to audio rendering and descriptor computation, were implemented within a custom Python application built around the Pedalboard plugin‑hosting library developed by Spotify (Sobot, 2023). Pedalboard provides low‑level access to Sylenth1’s VST3 parameters, enabling a reproducible and fully scriptable interface for sound generation at scale.
3.1 Why Sylenth1?
We chose Sylenth1 (LennarDigital, 2007) for four reasons. Its 512 factory presets, refined over many years by professional sound designers, provide a musically validated parameter set for studying parameter–timbre relationships (Figure 1 shows the initial preset interface). Its subtractive architecture—with clear oscillator, filter, envelope, low‑frequency oscillator (LFO), and modulation routing controls—yields a moderately sized, human‑interpretable, architecturally stable parameter space that maps directly to the timbral dimensions targeted by the AudioCommons models, unlike many modern wavetable, granular, or FM synthesizers. It is well‑supported by Spotify’s Pedalboard library (Sobot, 2023), enabling deterministic rendering and consistent plugin hosting across thousands of automated randomization cycles. Furthermore, confining the dataset to a single industry‑standard synthesizer makes the resulting timbre space cohesive, as researchers can analyze structure, correlations, and generative pathways within a fixed synthesis topology rather than across heterogeneous instrument families. A full description of all included parameters is available in the dataset repository6 (Figure 1).
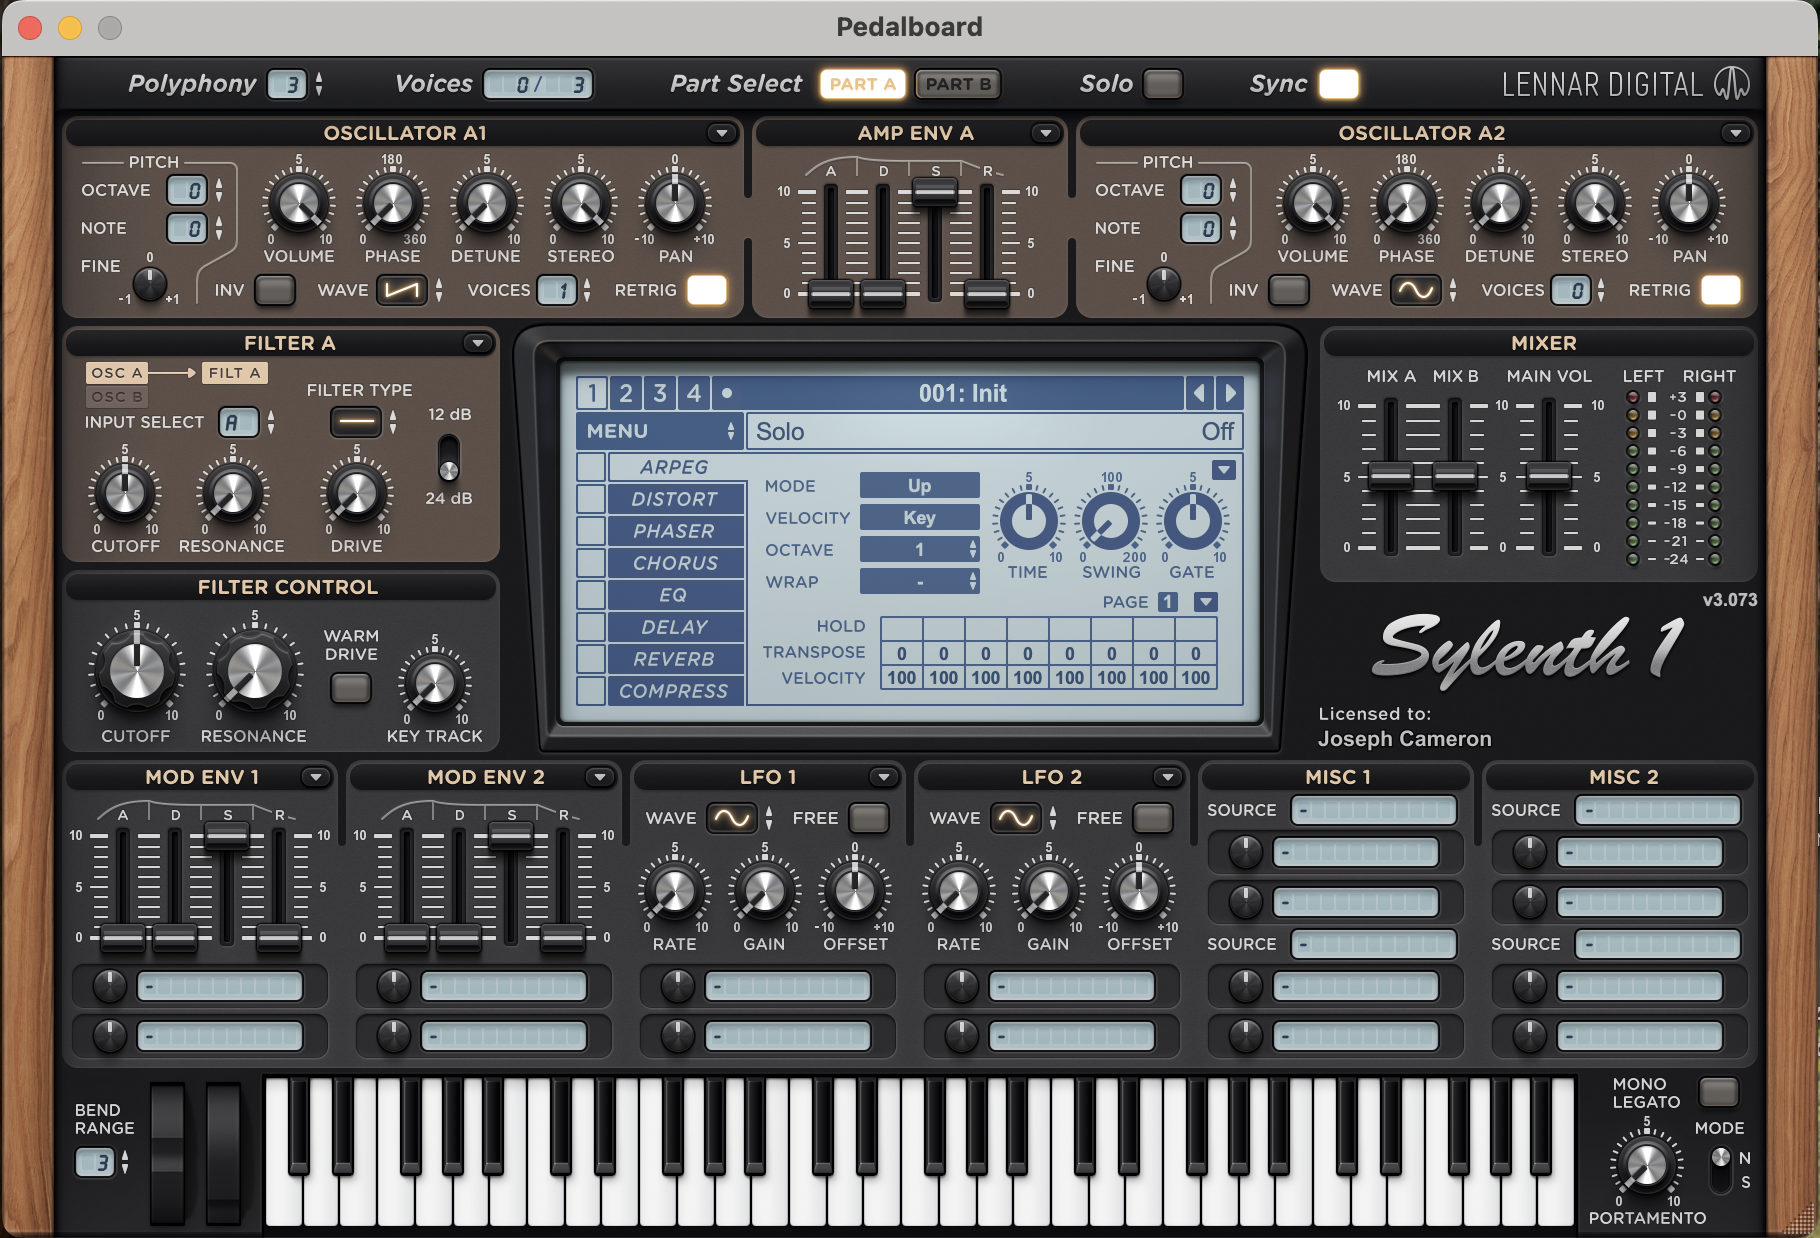
Figure 1
The initial preset of Sylenth1 (LennarDigital, 2007).
3.2 Preset generation system overview
All dataset generation was conducted using a custom Python application built around Spotify’s Pedalboard library, which provides Python bindings for loading VST3/AU plugins, querying their parameter surfaces, and rendering audio with sample‑accurate control. This custom Python interface, which can be seen in Figure 2, was used to: (1) load Sylenth1 via the VST3 interface; (2) enumerate all parameter IDs, parameter names, parameter ranges, and categorical parameter options; (3) update parameter values programmatically; and (4) temporarily render audio directly from the Sylenth1 plugin into Python to perform timbral descriptor analysis on Sylenth1 presets by calculating AudioCommons timbral model values from rendered audio. The Pedalboard layer ensures that each preset is represented faithfully as a reproducible set of parameter values that fully determines the resulting sound (Figure 2).
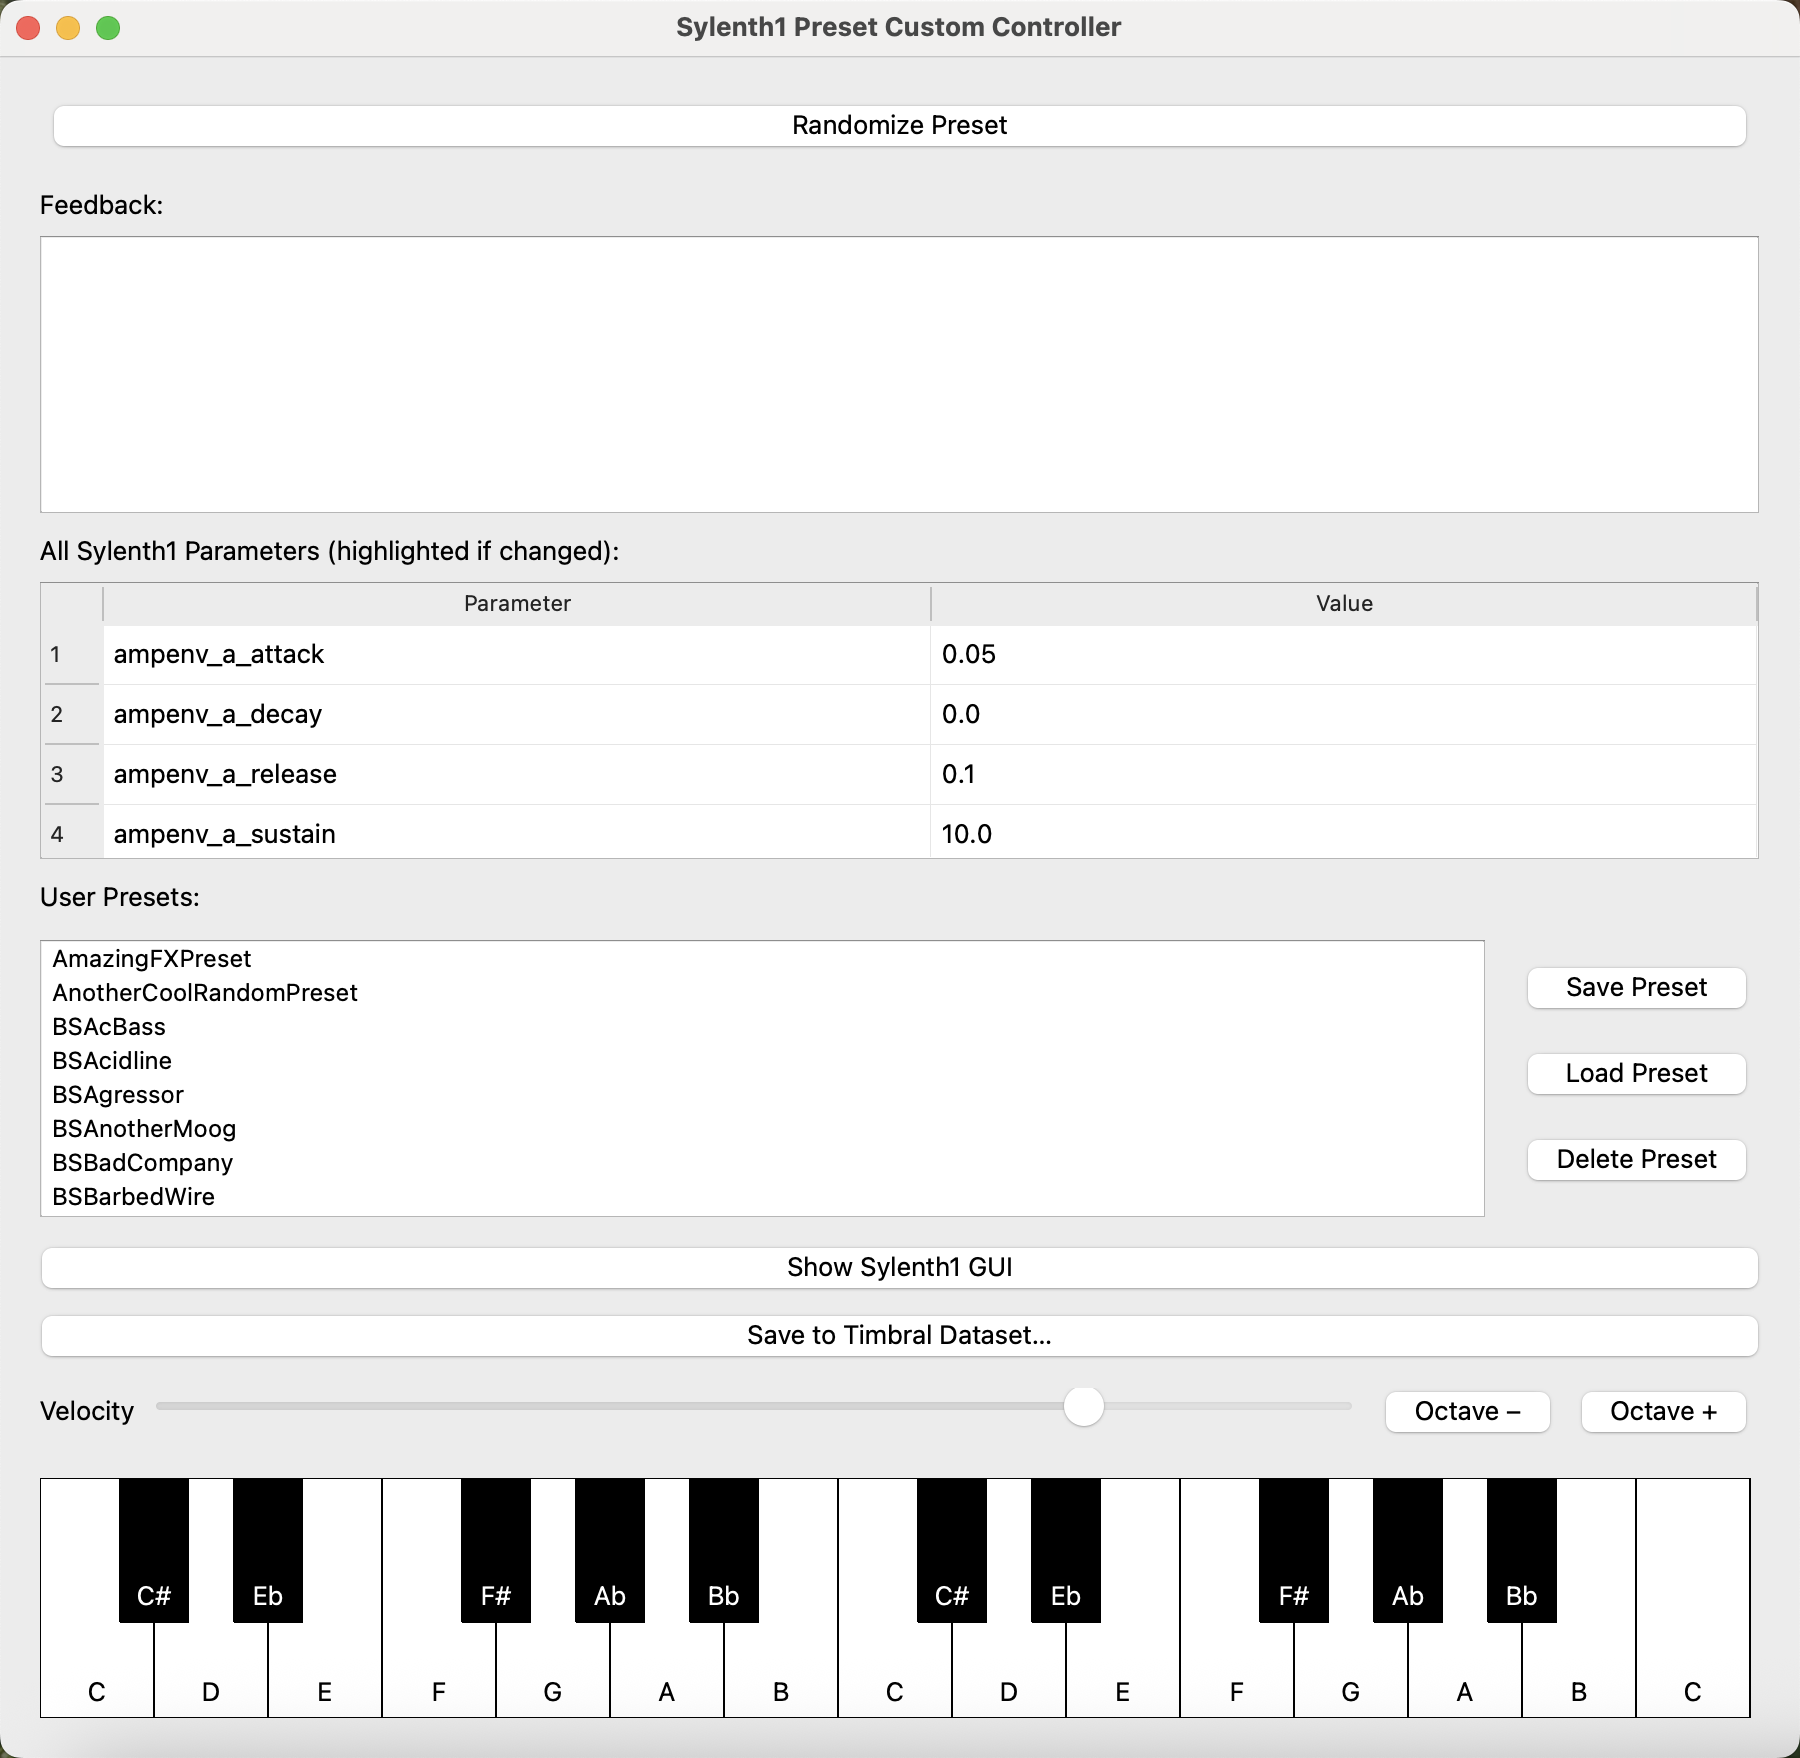
Figure 2
The interface of the custom Python application for interacting with Sylenth1.
3.3 Extracting and normalizing factory presets from Sylenth1
A total of 292 of all 512 factory presets that are shipped by default with Sylenth1 were imported directly via the custom Python app. In curating this subset, we deliberately omitted the remaining factory presets because they are primarily arpeggiator‑driven patches. These presets rely heavily on Sylenth1’s built‑in arpeggiator, which modulates pitch sequences rather than timbre. Since the objective of the present dataset is to study the mapping between static parameter configurations and steady‑state timbral attributes, we excluded any presets whose audible characteristics arise from note‑pattern generation, pitch cycling, or tempo‑synchronized stepping rather than from a stable synthesis configuration. Including arpeggiator‑focused patches would have introduced confounding variability tied to melodic motion and rhythmic articulation—dimensions orthogonal to timbre—and would have rendered the AudioCommons descriptor analysis incomparable across presets. Thus, only the non‑arpeggiator factory presets were retained, yielding a stable and timbrally meaningful ground‑truth set of 292 professionally designed patches.
All 292 Sylenth1 factory presets were imported into the application as user presets and then serialized to the dataset format. During this process, several deliberate normalization choices were made to ensure parameter comparability across presets.
First, the ‘sync’ parameter was always forced to ‘ON’ for every factory preset. Likewise, the ‘lfo_1_free’ and ‘lfo_2_free’ switches were consistently set to ‘OFF.’ These decisions remove absolute‑time modulation behaviors and instead anchor all time‑based parameters (e.g., LFO rates and delay times) to the plugin’s tempo‑synchronized units. This yields a uniform temporal reference frame across presets, avoiding unwanted heterogeneity caused by factory patches that mix free‑running (Hz‑based) and tempo‑synced (note‑value‑based) modulation rates.
Second, the 54 arpeggiator parameters (including the per‑step xarp_hold_* switches and the global sw_arponoff toggle) were intentionally omitted. These parameters alter note sequencing and fundamental pitch rather than timbre, and thus fall outside the scope of a timbre‑focused dataset. A parallel rationale guided the omission of the ‘pitch_bend,’ ‘pitchbend_range,’ ‘porta_mode,’ and ‘porta_time_ms’ parameters, as these parameters modulate pitch trajectories, not spectral or envelope structure, and including them would confound a strictly timbral embedding.
Finally, the ‘main_volume’ and ‘bypass’ controls were excluded, as they manipulate overall amplitude or activate/deactivate Sylenth1’s factors that are similarly orthogonal to timbral content. By removing parameters whose effects lie outside timbre, the dataset presents a clean space of timbre‑relevant controls that is well‑suited for both statistical analysis and machine‑learning‑based modeling.
For full transparency, we summarize the resulting parameter accounting in Table 1. The Sylenth1 VST3 host exposes 246 individual parameters; removing the arpeggiator family, pitch and portamento controls, global amplitude and bypass, the program/sync indices, and three factory‑only modulation flags (lfo_1_free, lfo_2_free, solo) leaves a canonical schema of 179 timbre‑relevant parameters (106 continuous, 55 categorical, 18 binary). All 106 continuous parameters vary across the dataset (none is constant); the PCA in Section 5.3 therefore operates on these 106 augmented with the 15 ordered‑numeric enums (e.g., the compressor ratio and LFO synced rates) whose stored values parse as scalars, yielding 121 numeric features under the analysis script’s selection rule.
Table 1
Parameter accounting for the Sylenth1‑10KPresets Dataset. The canonical 179‑dimensional schema arises by removing the 67 controls listed in this section from the 246 the plugin exposes; factory entries additionally carry the three modulation flags listed below but these are dropped from analysis so that factory and random entries share an identical schema.
| Parameter Group | Count |
|---|---|
| Raw plugin parameters (VST3 host) | 246 |
| Excluded (arp/pitch/volume/bypass) | 67 |
| Canonical timbre‑relevant parameters | 179 |
| of which float (all non‑constant) | 106 |
| of which enum | 55 |
| of which bool | 18 |
| Factory‑only retained keys (lfo_1_free, lfo_2_free, solo) | 3 |
| Per‑row schema, factory entries | 182 |
| Per‑row schema, random entries | 179 |
3.4 Randomized preset generation
The remaining 10,000 presets were generated through an automated randomization process designed to respect the musical plausibility embodied in the factory presets. Rather than sampling parameters naively from uniform distributions (an approach known to frequently produce silent or unusable synthesizer preset patches for audio analysis (Esling et al., 2020)), the system employs a factory‑conditioned parametric sampling strategy.
For each random preset, the system first loads a randomly selected factory preset from the 292 factory presets. Using a reference file of default Sylenth1 parameter values from the ‘Init’ preset, the application identifies all ‘active’ parameters: —those parameters actively contributing to the character of the base preset by differing from default settings. A random integer is drawn, and a subset of size is selected uniformly. Each selected parameter in is then assigned a new random value sampled from statistical distributions estimated from the 292 factory presets: numerical parameters are sampled from KDE distributions fitted on factory values, while categorical parameters are sampled proportionally to category frequencies. This creates musically plausible parameter mutations grounded in real synthesizer programming practice.
After generation, an audibility check renders a short A4 note via Pedalboard and measures its RMS; if , the randomization is repeated with a new factory seed (up to three retries). After three consecutive silent attempts, a corrective heuristic is applied as a last‑resort guard. This corrective heuristic forces filter inputs away from ‘None,’ sets filter cutoffs to a mid‑range value (40%–60%), and raises the mix_a and mix_b parameters to audible midpoints. Following this corrective heuristic, the preset then proceeds to descriptor analysis. Two design points deserve justification. First, the heuristics are last‑resort by construction: each of the three retries is a fresh, independent factory‑conditioned mutation rather than a repair of the failed patch, so the heuristic only fires when three independent draws are all silent. Because the draws are independent, raising the retry count further (to 10 or 100) offers rapidly diminishing returns: if the per‑draw silence probability is , the probability of reaching the heuristic falls as , which is already small for factory‑conditioned mutations, while every additional retry costs a plugin render. Three retries therefore trade a small residual heuristic‑usage rate against generation throughput. Second, we acknowledge that heuristic invocations were not logged during the original generation run, so neither the exact number of affected presets nor their identities can be reconstructed post hoc; the heuristic touches at most seven controls (two filter inputs, three filter cutoffs, and the two mixer levels), leaving the remaining controls of the affected preset factory‑anchored. We flag this as a limitation in Section 7, and a re‑generation with full per‑preset provenance logging (retry counts and heuristic invocations) is planned future work. Throughout the paper we use ‘random presets’ to refer to these parametrically sampled presets, emphasizing that they are not the result of naive or uniform random sampling.
3.5 Audio rendering and descriptor computation
For every valid preset, factory or random, the application renders a 0.5 s mono A4 note at 44.1 kHz using a fixed MIDI velocity of 100. Audio is mono because the AudioCommons timbral models internally down‑mix stereo to mono before feature extraction (Pearce et al., 2019). The rendered signal is loudness‑normalized to LUFS via pyloudnorm so that descriptor values reflect timbre rather than loudness variance. The seven AudioCommons models (brightness, depth, hardness, roughness, warmth, sharpness, boominess) are regression models trained on human ratings: each maps a fixed‑length acoustic‑feature vector (combinations of MFCCs, spectral statistics, modulation‑spectrum features, and envelope statistics) to a single 0–100 perceptual score (Pearce et al., 2019). We apply them to the normalized mono signal to obtain the seven descriptor values stored per preset.
3.6 Summary of design principles
Three deliberate constraints shape the dataset: a strict timbre focus that removes loudness, pitch‑sequencing, and bypass controls; a uniform tempo‑synced time unit that avoids mixed absolute/relative modulation rates; and a factory‑conditioned randomization that informs the priors for controlled mutation, ensuring audibility and structural validity.
4 Dataset Content and Format
Each entry of the released dataset5 records the full set of included Sylenth1 control parameters6, along with the corresponding AudioCommons timbral descriptor values computed from a rendered A4 note (see Section 3.5). The dataset repository ships parameter–descriptor pairs as JSON together with the rendered A4 audio for all 10,292 entries, so that downstream work can either re‑synthesize from parameters or operate directly on the released audio.
4.1 JSON structure
Each preset is represented as a single JSON dictionary with the following high‑level keys:
id: A unique, stable identifier automatically generated by the app (e.g., ‘19fd8e00’).
name: A user‑assigned or factory‑assigned preset name (factory presets retain their original names; random presets default to ‘Preset’).
sound_type: Free‑form label describing preset class (blank for random presets).
tags: A list of stylistic tags, typically empty for random presets but sometimes populated when the user categorizes presets manually.
description: Optional free‑text description. Included for extensibility.
models: A dictionary containing the seven AudioCommons timbral attributes: brightness, depth, hardness, roughness, warmth, sharpness, boominess, each stored as floating‑point values.
params: A dictionary of Sylenth1 parameters included in the dataset (see Section 3.3 for inclusion/exclusion criteria). These parameters retain plugin‑native scales and units: floats (e.g., envelope times in musical units, oscillator pan in 0–10, etc.), enumerated strings (e.g., ‘TriSaw,’ ‘Random,’ ‘1/2T’ for synced rates, ‘Highpass’), boolean‑like strings (‘True’/‘False’), integer‑like floats (e.g., number of voices, octave offsets).
note_midi and note_name: Always 69 and ‘A4’ respectively, indicating the analysis note used for timbral model computation.
program: The raw identifier of the preset slot (factory presets may store a program number; random presets usually set this to null).
created_at: An ISO 8601 timestamp marking when the preset was generated and analyzed.
source: Indicates whether the preset originated from the factory bank (‘factory’) or was generated by the user/randomization mechanism (‘user’).
All dataset entries can be found in the dataset repository5.
This structure ensures full traceability from parameter space to perceptual descriptor space, while allowing downstream systems to regenerate audio for listening tests, synthesis modeling, or machine‑learning experiments. The dataset contains all non‑tempo‑dependent, non‑pitch‑modifying, and non‑amplitude‑specific parameters from Sylenth1 relevant to timbre synthesis. This dataset structure ensures that presets are loaded truthfully into Sylenth1 following initialization. Furthermore, each parameter is guaranteed to fall within plugin‑validated ranges via the clamp‑and‑validate logic in the host application, preventing invalid configurations that might arise during randomization.
Because AudioCommons models operate on short monophonic rendered audio, each descriptor is a deterministic function of the preset’s parameters, making the dataset suitable for parameter‑to‑timbre regression and timbre‑to‑parameter inversion tasks.
4.2 File organization
The repository ships three JSON manifests (factory subset, random subset, and the combined release) and two directories of A4 audio renders:
Sylenth1_Full_Factory_Presets_AC_A4.json—the 292 factory presets with their AudioCommons descriptor values.
Full_Random_Presets.json—the 10,000 factory‑conditioned random presets (Section 3.4) with their descriptor values.
FINAL_timbral_dataset_audiocommons.json—the combined release used in all analyses in this paper.
random_preset_audio_snippets/ and factory_preset_audio_snippets/—the rendered A4 audio used to compute the descriptor values, one WAV per preset id, provided for verification and alternative feature extraction.
5 Statistical Analysis and Visualizations
This section presents a statistical characterization of the Sylenth1‑10KPresets Dataset, covering Sylenth1 factory preset and random (parametrically sampled) preset parameter distributions, descriptor–control correlations, and a global PCA of all 10,292 presets (292 factory + 10,000 randomly generated). Together, these analyses provide insight into the structure of the synthesizer’s control space, the coverage achieved by our randomization procedure, and the relationship between Sylenth1 parameters and perceptual timbral dimensions. Throughout, we emphasize how the dataset supports the development of data‑driven models for timbre manipulation.
5.1 Marginal distributions of parameters and timbral descriptors
Figure 3 shows the marginal distributions of the 7 AudioCommons descriptors over all 10,292 presets. Coverage is non‑uniform: some attributes occupy narrow bands of the 0–100 scale while others spread broadly, and extreme values (near 0 or 100) are comparatively rare. One striking pattern is the strong clustering of presets at roughness , reflecting how the AudioCommons roughness model behaves under Sylenth1’s clean subtractive architecture and monophonic rendering, where partial beating is minimized (Pearce et al., 2017a; Vassilakis, 2007) (Figure 3).
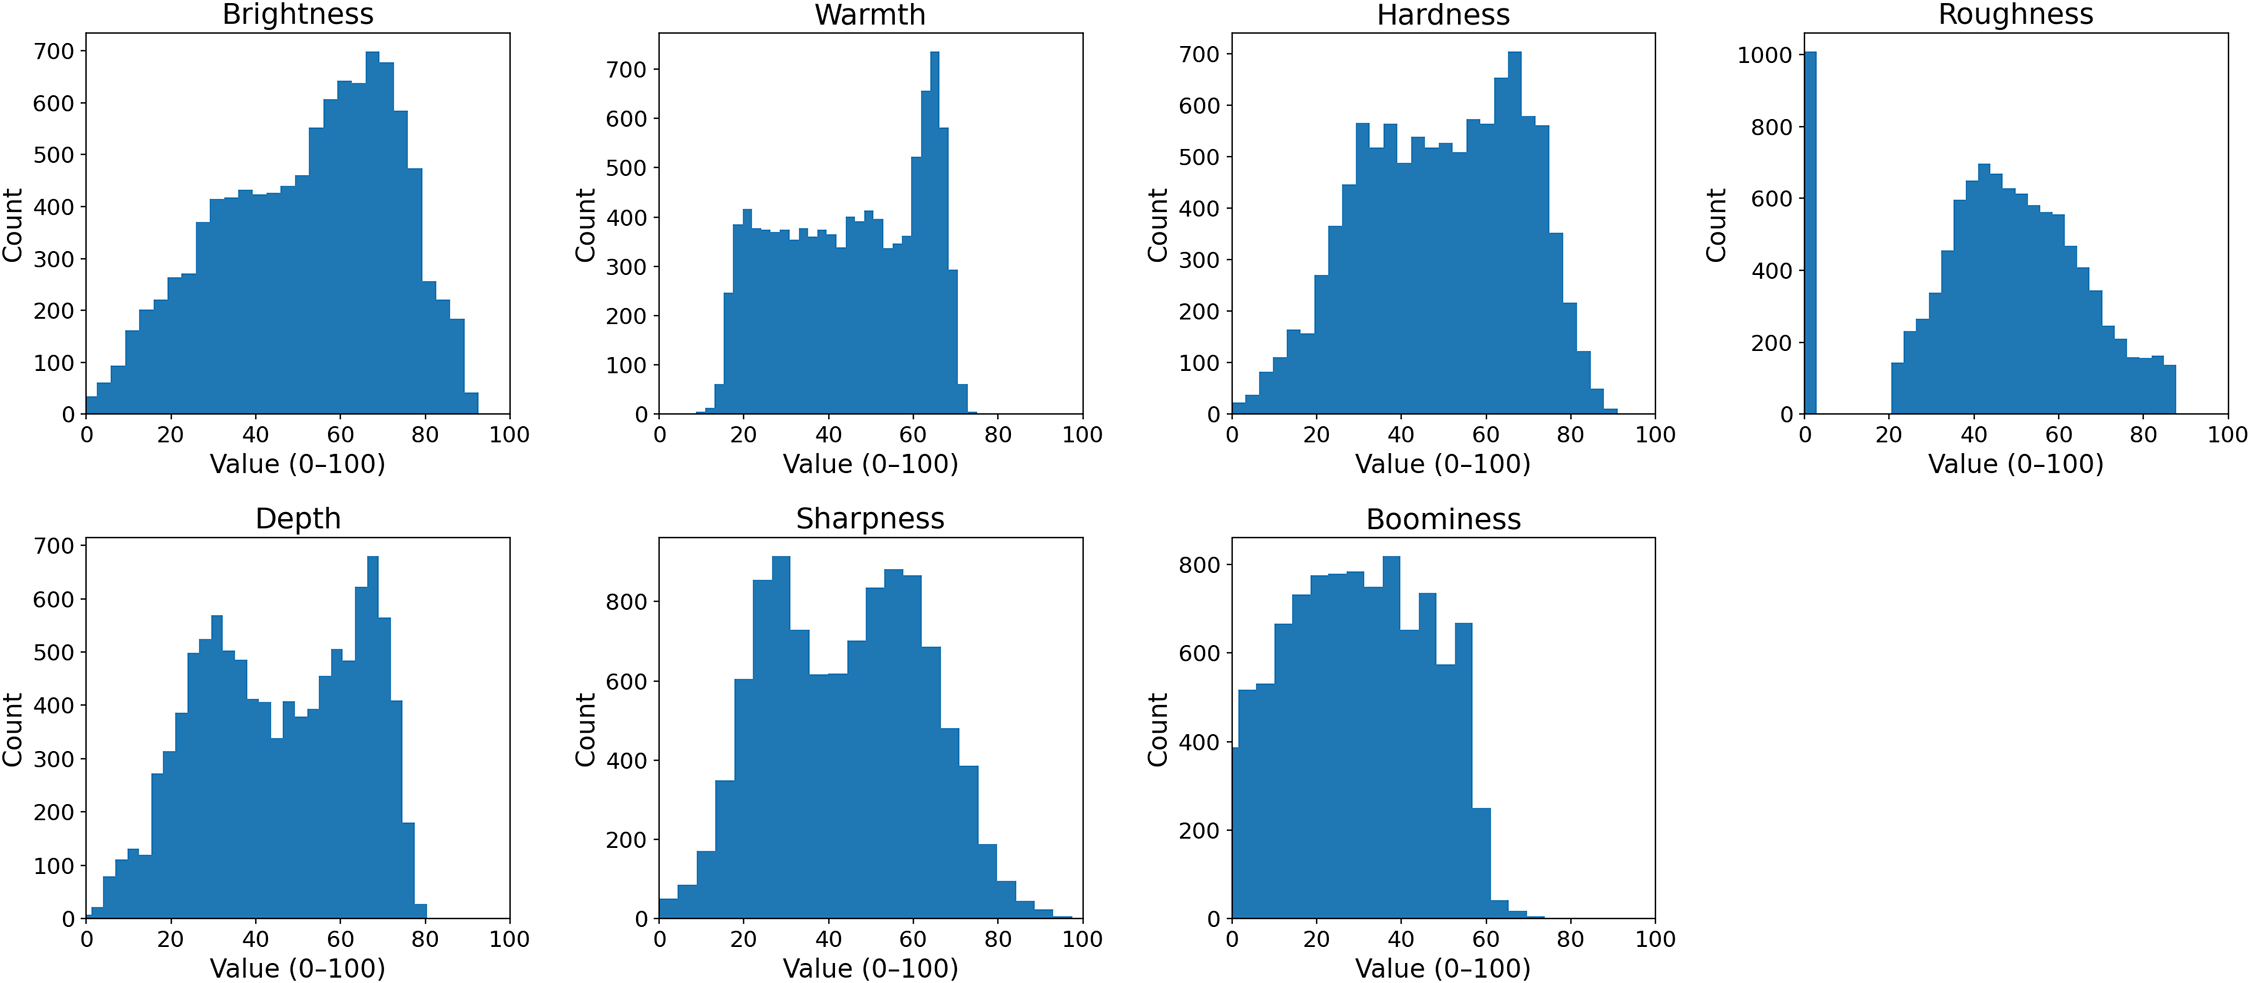
Figure 3
Distributions of the 7 AudioCommons timbral models over all 10,292 presets. Each panel shows a histogram on the common 0–100 scale.
Turning to the synthesizer’s control space, Figure 4 consolidates the factory‑versus‑random comparison for seven representative parameters spanning filtering, envelope shaping, oscillator detuning, effects, and a categorical waveform control. Across these and other examined parameters, a consistent pattern emerges: factory presets occupy a narrow, structured subset of the synthesizer’s full parameter space—bimodal filter cutoff distributions (low for bass sounds, mid‑high for bright patches), amplitude envelope decays concentrated in the 0–2 range, modest oscillator detuning, subtle reverb (15%–40% dry/wet), and a pronounced dominance of the Saw waveform. The random presets respect these factory‑conditioned priors but expand coverage across the parameters’ full ranges, populating mid‑range and boundary cases that are sparse in factory data: a broader continuum of filter cutoffs, many more mid‑range envelope values, near‑full‑range detuning, extreme reverb settings, and substantially higher prevalence of less common waveforms (Noise, Triangle, TriSaw) while preserving the overall categorical ordering. The combined dataset therefore couples human‑curated structure with algorithmically driven exploration.
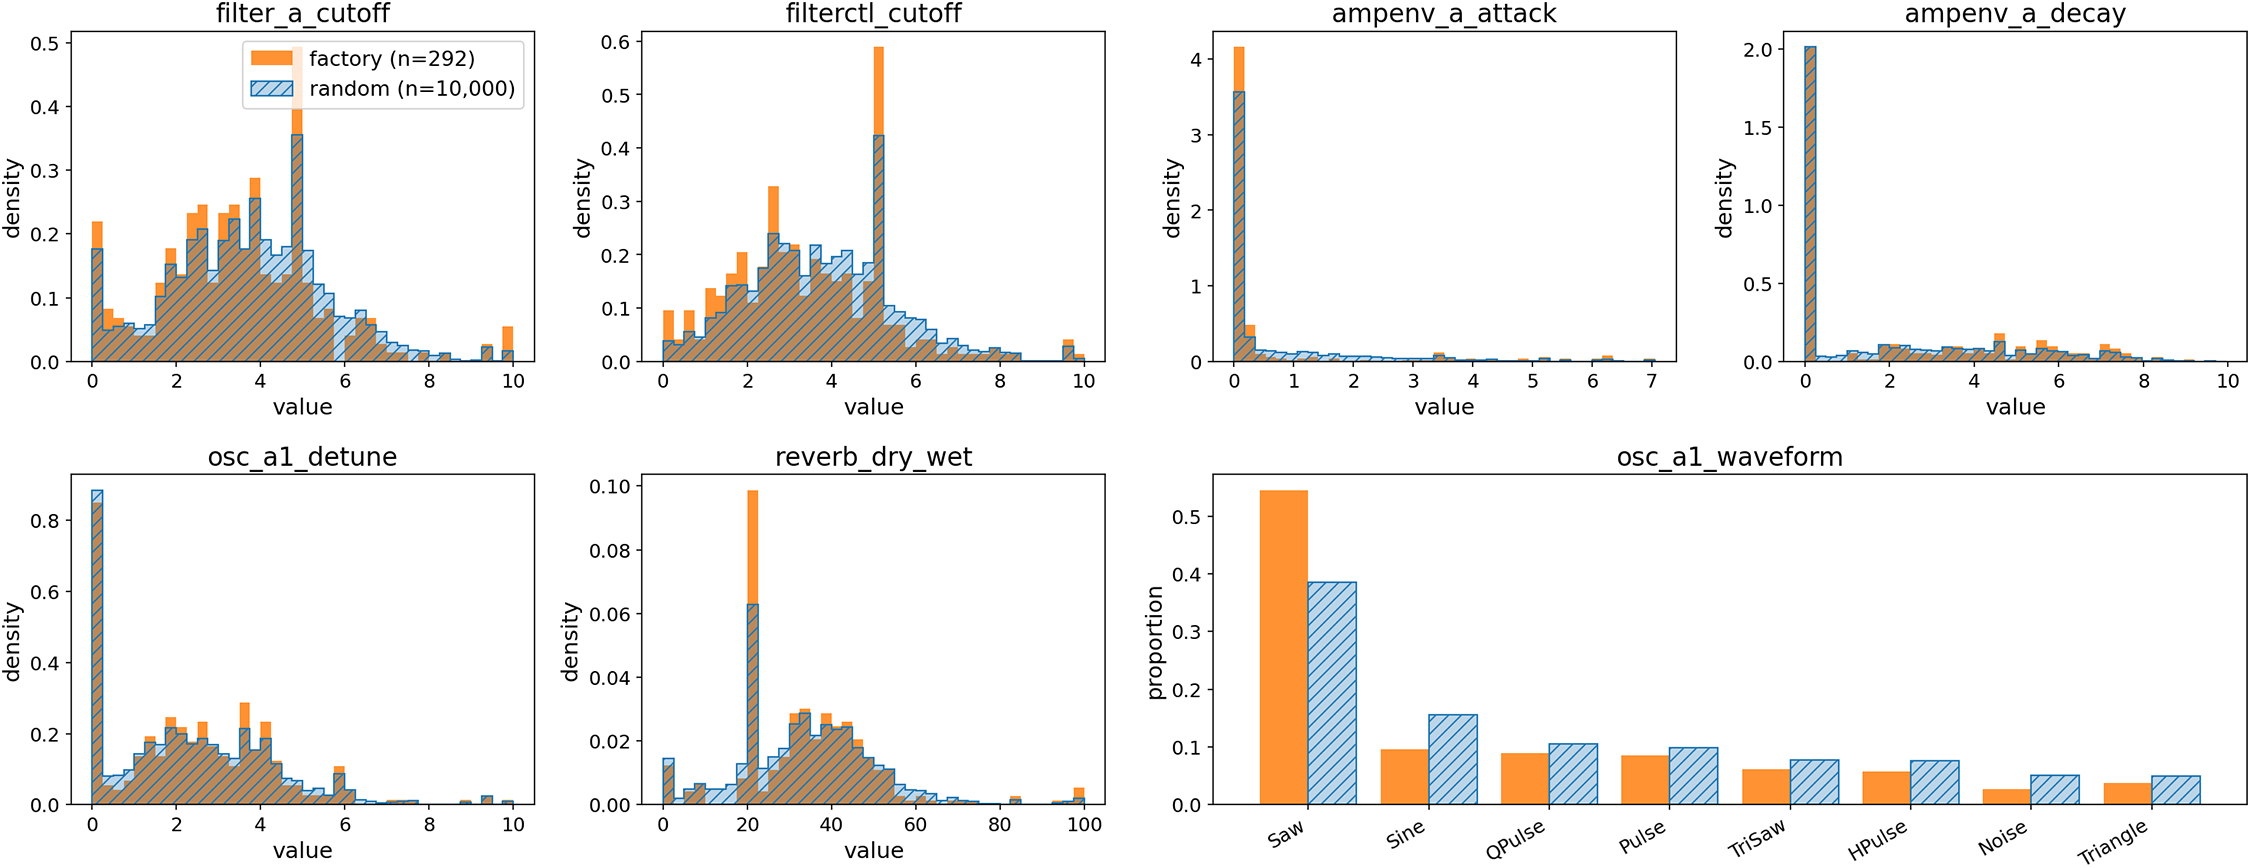
Figure 4
Factory versus random distributions for seven representative Sylenth1 parameters, grouped by function (filtering, envelope shaping, oscillator, effects, categorical waveform). Numeric panels overlay density‑normalized histograms of the factory presets (solid orange, ) and the random presets (blue diagonal hatching, ) on shared axes, so the two populations are directly comparable despite the order‑of‑magnitude size difference; where the random density falls below the factory density, the hatching remains visible over the taller orange bar. The categorical waveform panel uses side‑by‑side proportion bars with the same encoding. Distributions for the remaining parameters follow the same pattern and are provided in the dataset repository.
5.2 Correlations between parameters and AudioCommons descriptors
To complement the distributional and PCA analyses, we computed pairwise Pearson correlations between all 7 AudioCommons timbral descriptors and the 121 numeric Sylenth1 parameters (the same numeric selection used for the PCA in Section 5.3; see Table 1). Overall, correlations between individual parameters and perceptual descriptors are low in magnitude, generally falling within , with the largest magnitudes reaching . This behavior is expected for three reasons: (1) timbre is multidimensional and rarely attributable to a single control; (2) many Sylenth1 parameters interact non‑linearly (e.g., oscillator mix interacts with filter routing and modulation); and (3) the AudioCommons regression models operate on audio features, not parameter values directly, so a loose mapping is expected.
Despite the low magnitudes, several interpretable trends emerge from the full correlation matrix in Figure 5 that align with synthesis practice and psychoacoustic theory. The largest‑magnitude correlations in the matrix involve osc_a1_octave ( with depth, with boominess, with warmth, and with brightness) and filterctl_cutoff ( with brightness and with warmth). The octave correlations are intuitive: raising the oscillator register drains low‑frequency energy and raises the spectral centroid. At the other extreme, most modulation‑routing and stereo parameters correlate near zero with every descriptor. Oscillator detune and filter‑cutoff parameters are the most influential families across descriptors: brightness, hardness, and sharpness all correlate positively with detune and cutoff (detune introduces spectral spreading; higher cutoffs raise spectral centroid), while warmth and depth correlate inversely with the same controls. Boominess correlates positively with LFO settings and EQ bass gain (eq_bass_db, osc_*_octave); roughness correlates with distortion (distort_amount), cutoff, and detune, consistent with the AudioCommons roughness model responding to modulation artifacts (AM/FM beating) that are rare in this dataset (Section 5.1). Stereo‑related controls (*_width, *_stereo, *_pan) appear in the matrix even though all renders are mono and the AudioCommons models down‑mix to mono before feature extraction: their non‑zero correlations reflect joint co‑occurrence with other timbral controls in factory programming (e.g., wide‑pad presets bundling broader stereo spread with deeper modulation and longer envelopes) rather than direct influence on a mono signal. These results demonstrate that while individual parameters have weak linear relationships with perceptual descriptors, families of related controls systematically contribute to timbral qualities in expected ways, providing interpretable structure that can guide synthesis applications and model design.
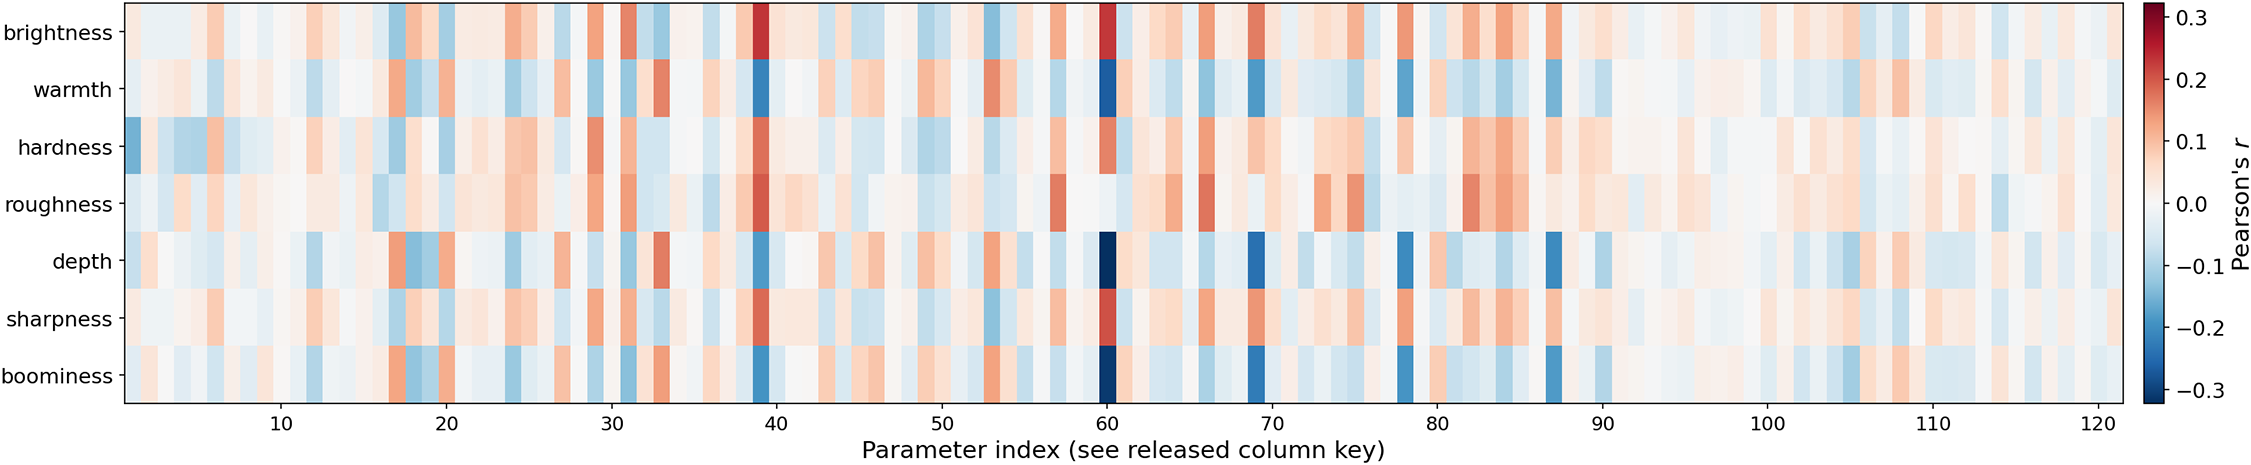
Figure 5
Pearson correlations between the 121 numeric Sylenth1 parameters (columns, indexed alphabetically; the full index‑to‑ name key is released in the dataset repository) and the 7 AudioCommons timbral models (rows) over all 10,292 presets. The color scale is normalized to the observed correlation range (deep red strongest positive, deep blue strongest negative, ) rather than the theoretical . The strongest correlates are named in the text.
5.3 Principal component analysis of the control space
To obtain a more compact view of the dataset’s continuous control space, we applied PCA to the 121 numeric Sylenth1 parameters across all 10,292 presets: the 106 float controls together with 15 ordered‑numeric enums (e.g., comp_ratio, the LFO synced rates, oscillator note/octave/voice counts, polyphony) whose stored values parse as scalars under the analysis script’s selection rule. Before PCA, each parameter was standardized to zero mean and unit variance, so that components reflect covariation in control patterns rather than absolute scale.
5.3.1 Global structure of the control space
The scree plot in Figure 6 shows the explained variance ratio of the first 20 principal components (PCs). PC1 accounts for just under 4% of the total variance, with subsequent components each explaining between roughly 1.2% and 3.3%. The curve decays smoothly without a sharp ‘elbow,’ indicating that there is no small set of components that fully dominates the variance; instead, structure is spread across many moderately informative directions. Taken together, the first 20 PCs capture on the order of one third of the total variance, providing a useful low‑dimensional summary while still leaving substantial residual structure for more specialized analyses.
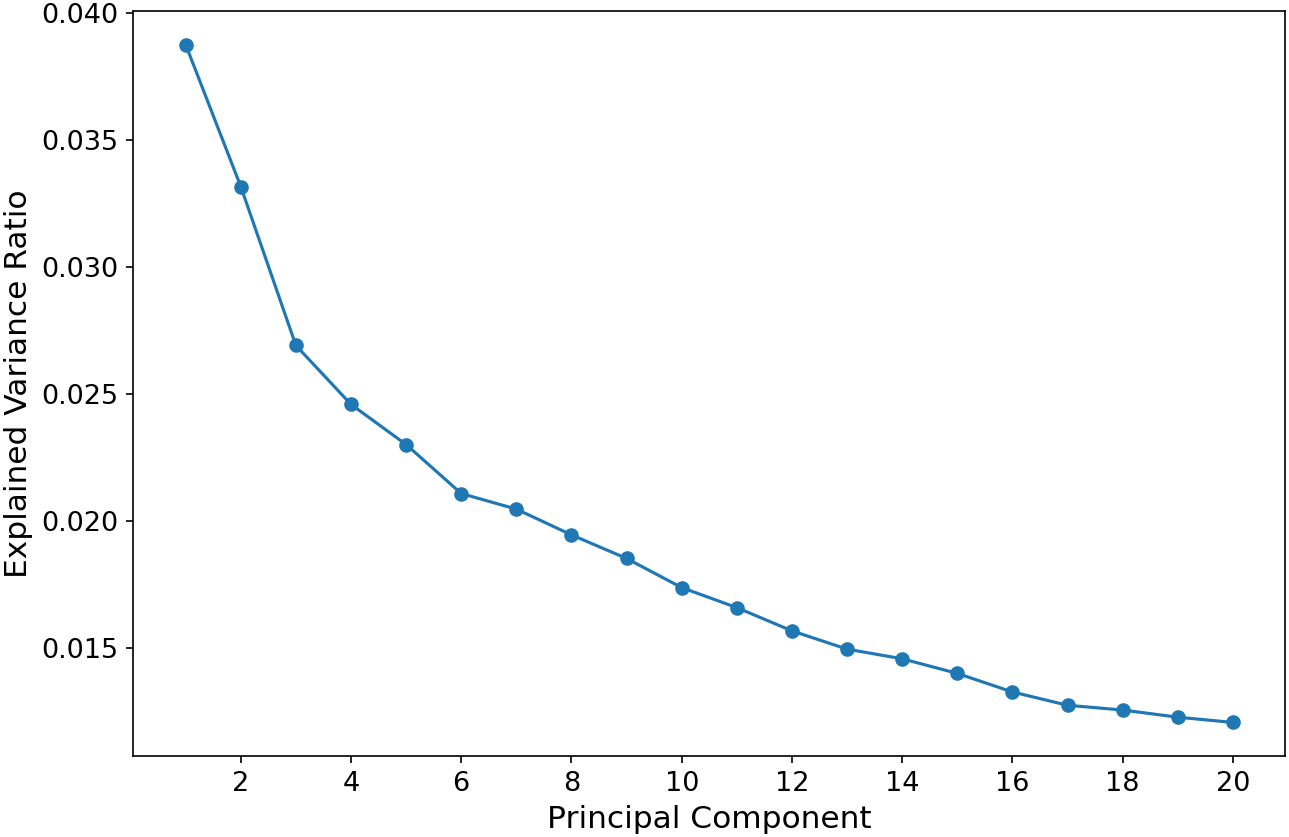
Figure 6
PCA scree plot showing explained variance ratio for the first 20 principal components computed over all 10,292 presets.
The PC1 and PC2 loading patterns (Figure 7) reveal two broad axes of variation that recur across factory and random presets. PC1 is dominated by reverb, delay, and phaser parameters together with part‑B amp envelope sustain/decay—an ‘effects saturation/spaciousness’ axis from dry envelope‑dominated presets to heavily effected, spacious sounds. PC2 is dominated by oscillator detune (osc_*_detune) and voice‑count parameters together with filter‑slope settings (filter_b_db_db) and amp‑envelope attack/decay—a ‘spectral thickness/ensemble detune’ axis from thin undetuned sounds to wide multi‑voice detuned textures.
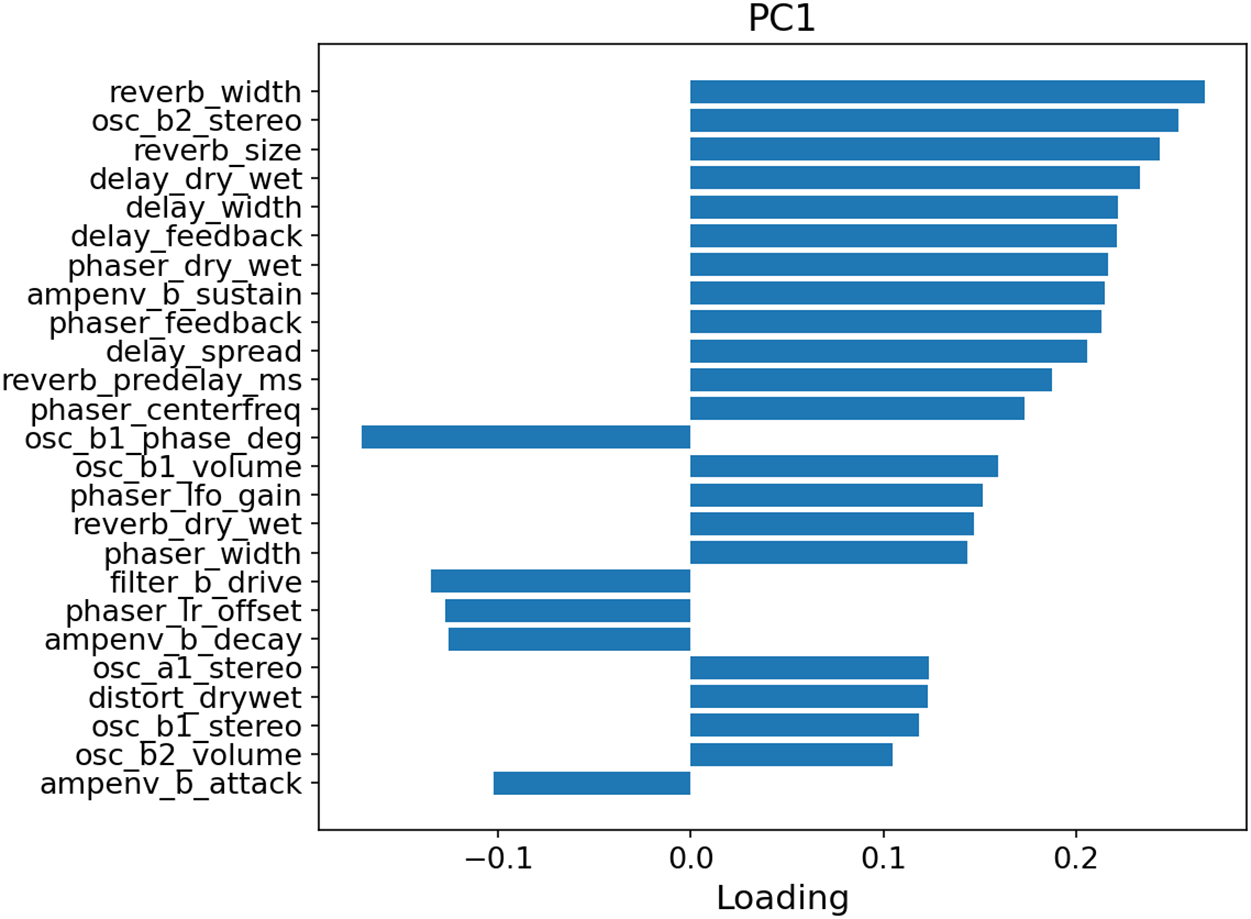
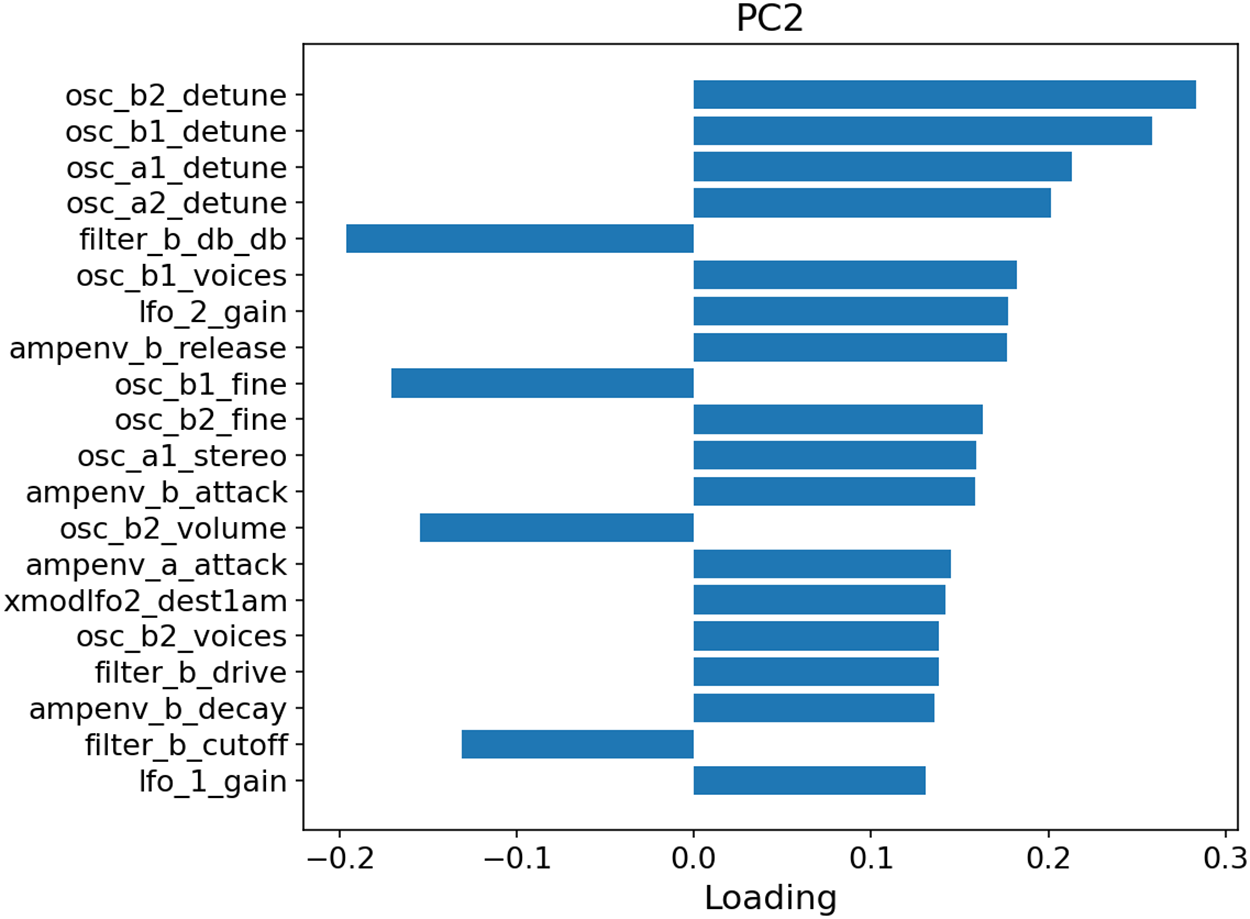
Figure 7
Top parameter loadings for PC1 (top) and PC2 (bottom). PC1 is dominated by reverb, delay, phaser, and envelope parameters, while PC2 is dominated by oscillator detune, voice count, and filter slope.
These two components already suggest that, despite the combinatorial space of possible patches, a large proportion of practical variation in presets lies along interpretable dimensions related to effects usage and oscillator configuration.
5.3.2 Linking principal components to AudioCommons descriptors
To connect this control–space structure to perceptual descriptors, we correlated the scores of each principal component with the seven AudioCommons timbral models. Figure 8 summarizes the correlations as a PC–descriptor heatmap; a per‑descriptor view of the same information, sliced into one panel per descriptor, is provided in the Supplementary File (Figure S1). Although most correlations are modest in magnitude, three groupings emerge: brightness, sharpness, and roughness all peak on PC2; warmth, depth, and boominess all peak on PC12; hardness peaks on PC4.
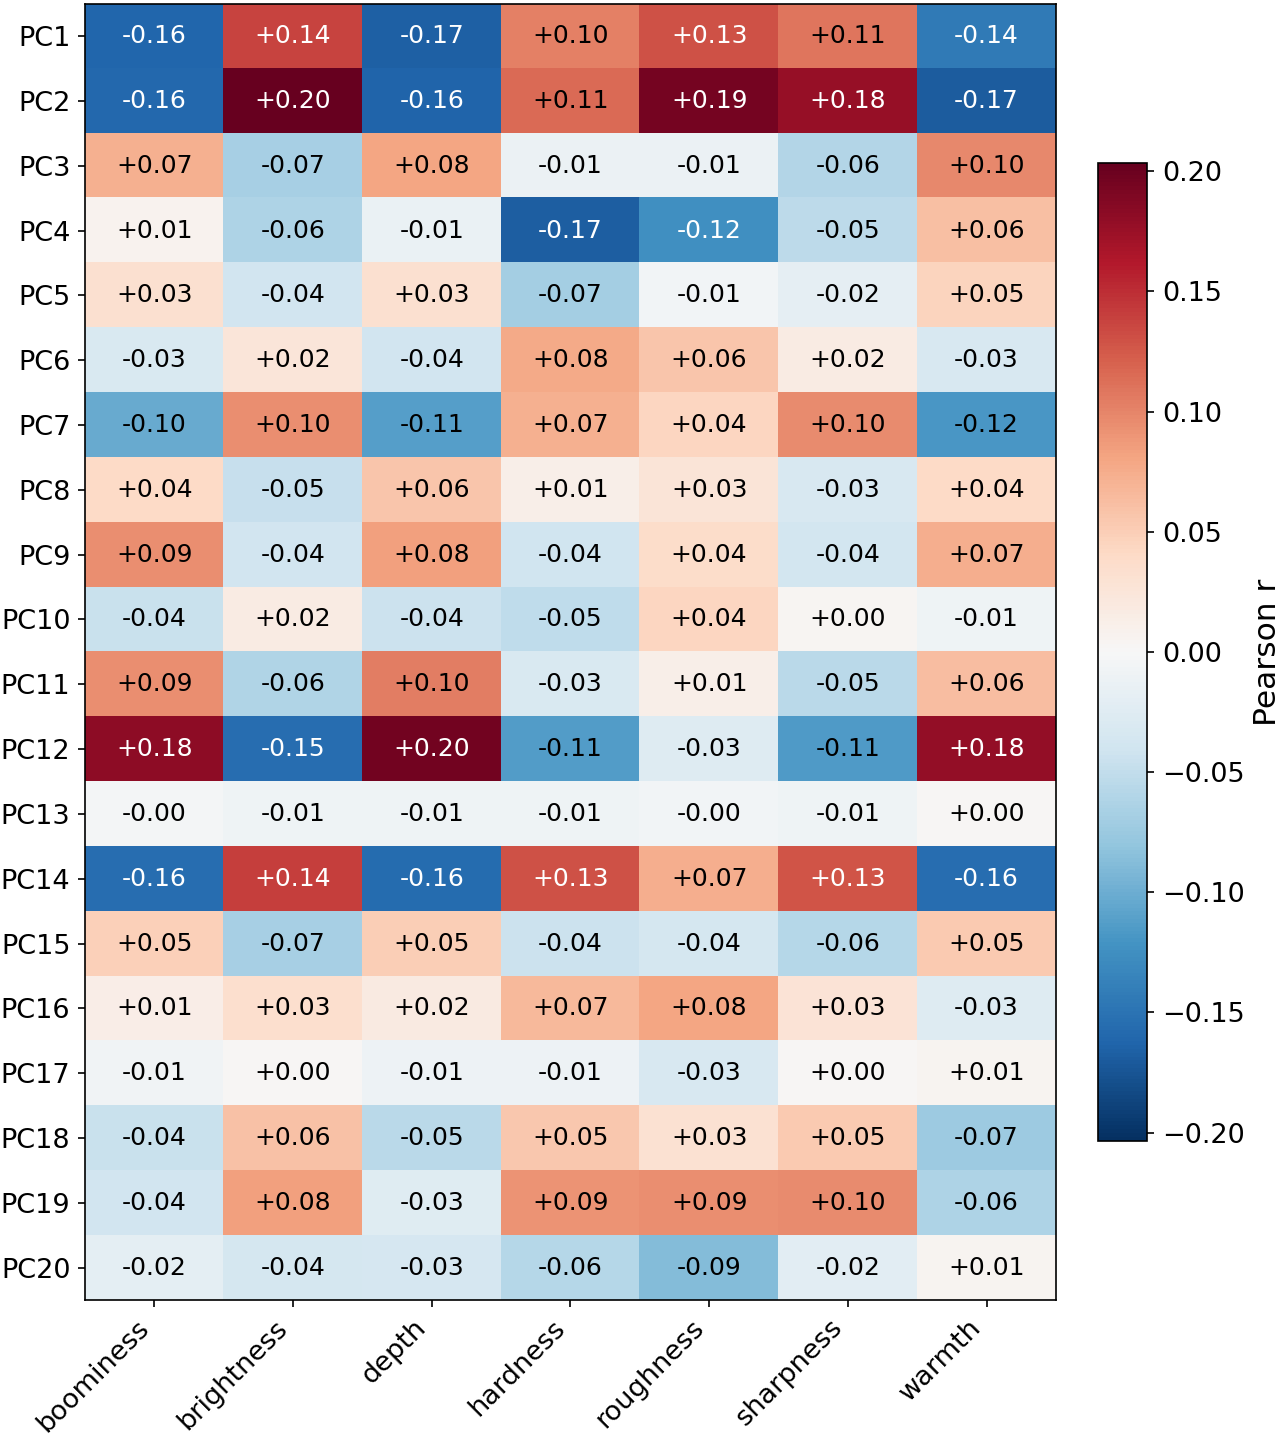
Figure 8
Correlation matrix between the first 20 principal components (rows) and the 7 AudioCommons timbral models (columns), with per‑cell Pearson’s annotated. The diverging color scale is normalized to the observed correlation range (; deep red strongest positive, deep blue strongest negative) rather than the theoretical .
The three loading panels in Figure 9 (one per group, for the descriptor whose correlation with its PC is strongest) reveal the synthesis controls behind each grouping. PC2 is dominated by oscillator detune (osc_*_detune) and voice‑count parameters together with filter‑slope settings, consistent with stacked‑detuned‑oscillator architectures producing the brilliant, cutting, and beating timbres that brightness, sharpness, and roughness respectively capture. PC12 weights low‑frequency EQ and filtering (eq_treble_db, delay_lowcut_hz, filterctl_cutoff/reso), envelope sustain/release and oscillator fine‑tuning; the structured combination of spectral tilt, low‑cut filtering, and sustained low‑frequency content that AudioCommons reads as warmth, depth, and boominess. PC4 emphasizes chorus and stereo parameters together with amplitude‑envelope attack times, consistent with hardness capturing fast, percussive onsets spread spatially by modulation.
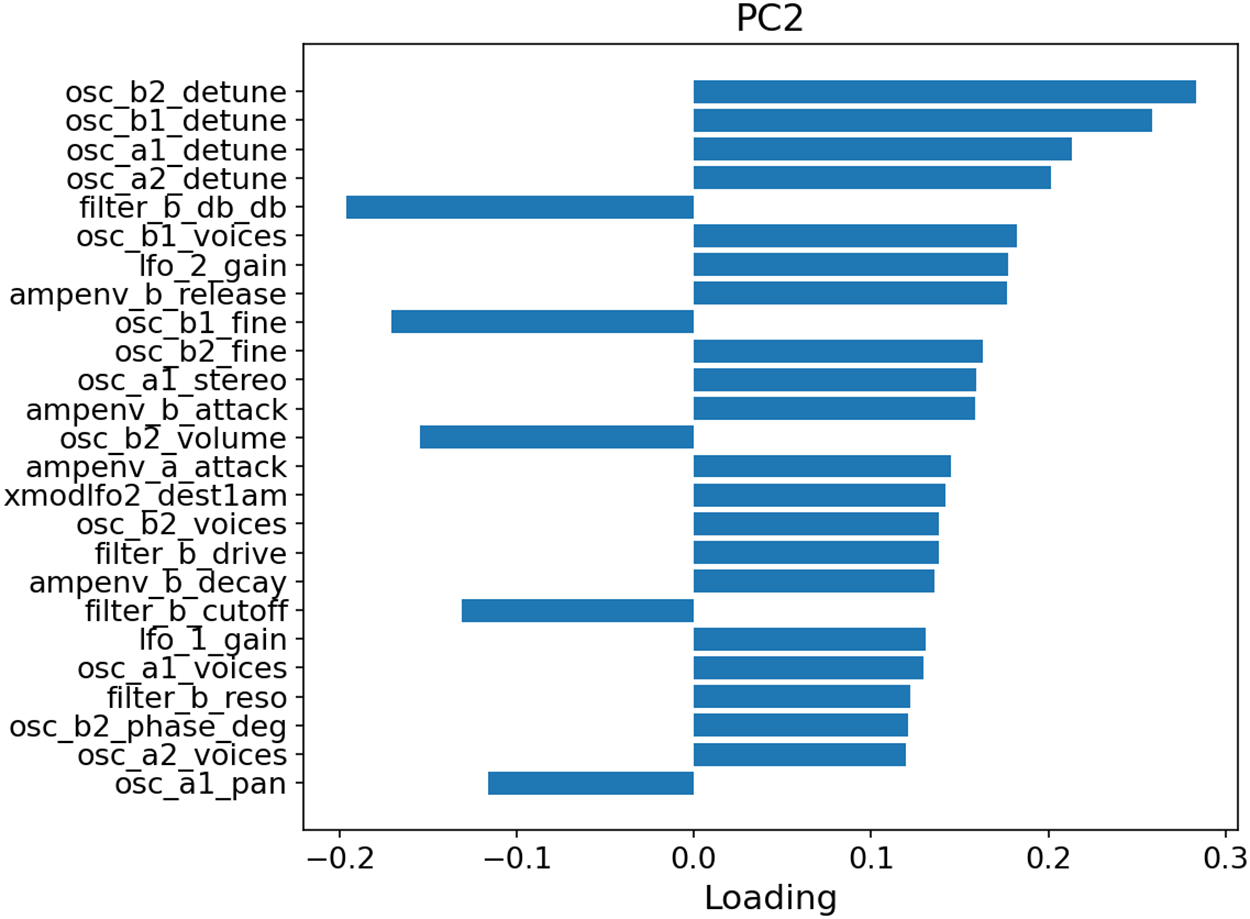
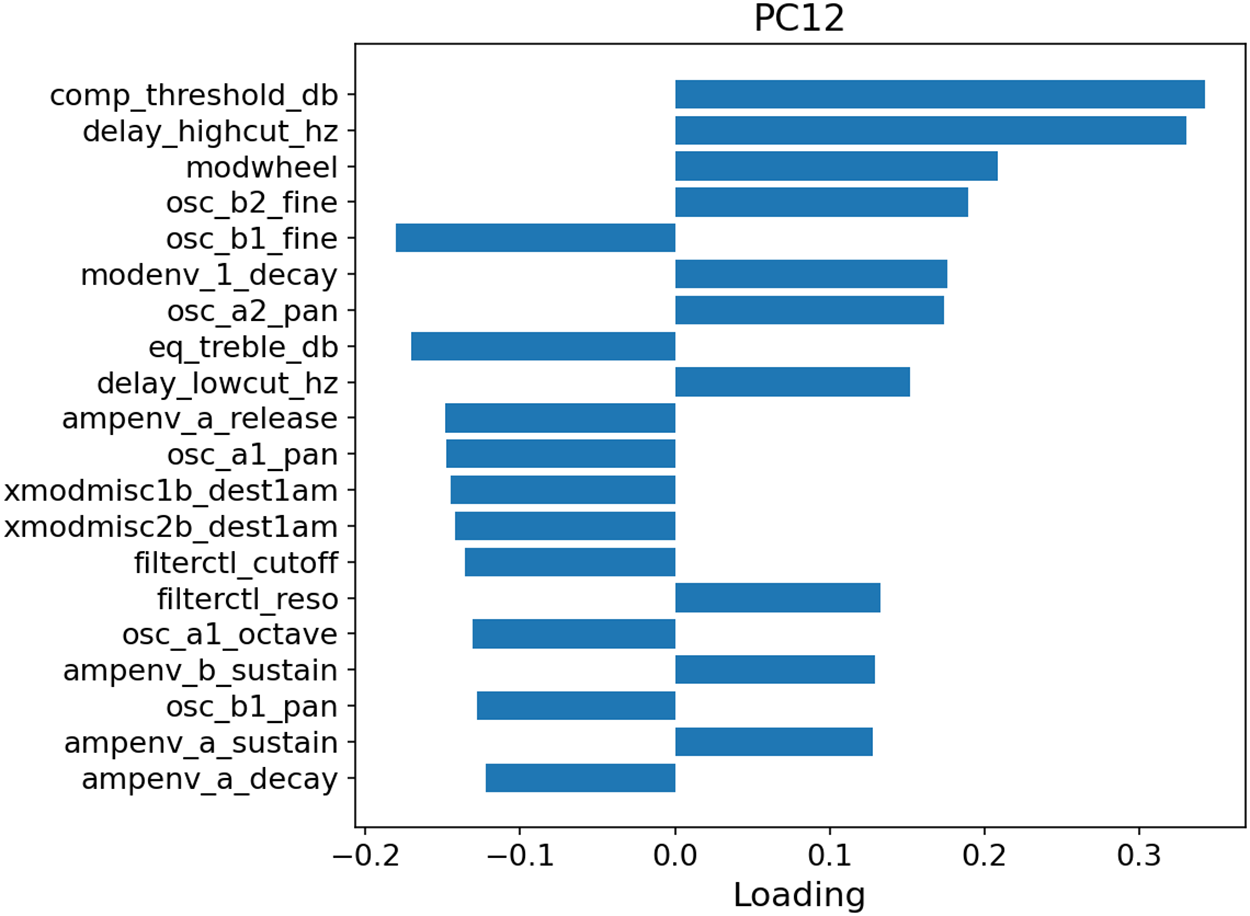
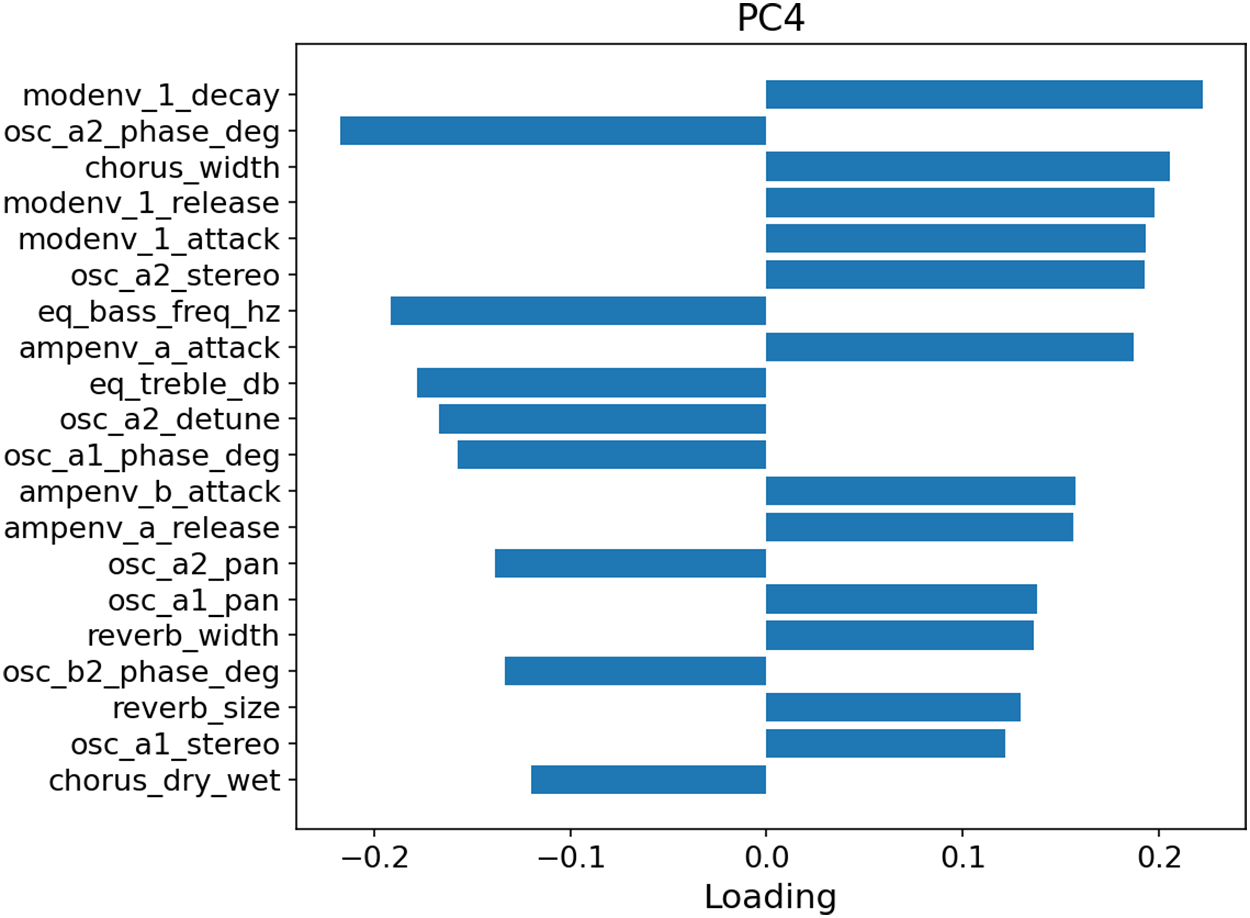
Figure 9
Top 20 parameter loadings for the 3 principal components most strongly correlated with the AudioCommons descriptors: PC2 (top; strongest for brightness, also drives sharpness and roughness), PC12 (middle; strongest for warmth, also drives depth and boominess), and PC4 (bottom; strongest for hardness).
Overall, no single principal component maps cleanly onto a single semantic descriptor: each AudioCommons model draws on a mixture of low‑variance directions, with the three groupings above (PC2, PC12, PC4) capturing the dominant associations. The implication for subsequent modeling is that learning timbre controls requires multi‑dimensional latent spaces; PCA nonetheless provides a useful design scaffold for higher‑level controls and for regularizing generative models in ways that respect the underlying control structure.
The PCA latent space also affords a direct comparison of the factory and random subsets: projected into the PC1–PC2 plane, factory presets form tight clusters along a curved manifold embedded as concentrated islands inside the far broader (but still non‑uniform) random‑preset cloud, consistent with the factory‑conditioned generation procedure described in Section 3.4. As this distributional relationship is expected by construction, the full comparison is provided in the Supplementary File (Section S2, Figures S2–S3).
5.4 Validity of AudioCommons descriptors on synthesized audio
The AudioCommons timbral models were developed and validated primarily on real‑world audio and musical instrument samples (Pearce et al., 2019); their behavior on synthesized audio, and on the specific subset of synthesized audio produced by Sylenth1 at a single pitch, has not previously been quantified. To provide evidence that the AudioCommons labels are doing something perceptually sensible on this audio distribution, rather than producing arbitrary out‑of‑domain outputs, we conduct a convergent‑validity analysis on the full set of 10,000 random preset renders. For each preset’s released A4 WAV, we compute a suite of standard acoustic features via librosa (spectral centroid, spectral rolloff at 85%, spectral bandwidth, spectral flatness, the fraction of spectral power in three bands at 0–250 Hz/250 Hz–2 kHz/above 4 kHz, zero‑crossing rate, and RMS) and compute Spearman rank correlations between each of these features and each of the seven AudioCommons descriptor values stored in the dataset.
Figure 10 reports the full correlation matrix between the seven descriptors and the nine acoustic features, with per‑cell values annotated. Five of the seven descriptors achieve with their expected acoustic predictor: brightness with spectral centroid (), depth and boominess with the low‑band energy ratio ( in both cases), warmth with the high‑band energy ratio (), and sharpness with spectral centroid (). Hardness shows a moderate relationship with zero‑crossing rate () and a weaker one with spectral flatness (). The matrix also contains an interpretable strong positive/negative contrast pair on a single feature: spectral centroid correlates at with brightness and at with warmth, matching the psychoacoustic opposition between the two descriptors. These results indicate that the AudioCommons labels, for these six descriptors, track the same spectral structure that simple, well‑understood acoustic features capture on Sylenth1 output; the convergent‑validity evidence supports their use as ground‑truth annotations for the dataset.
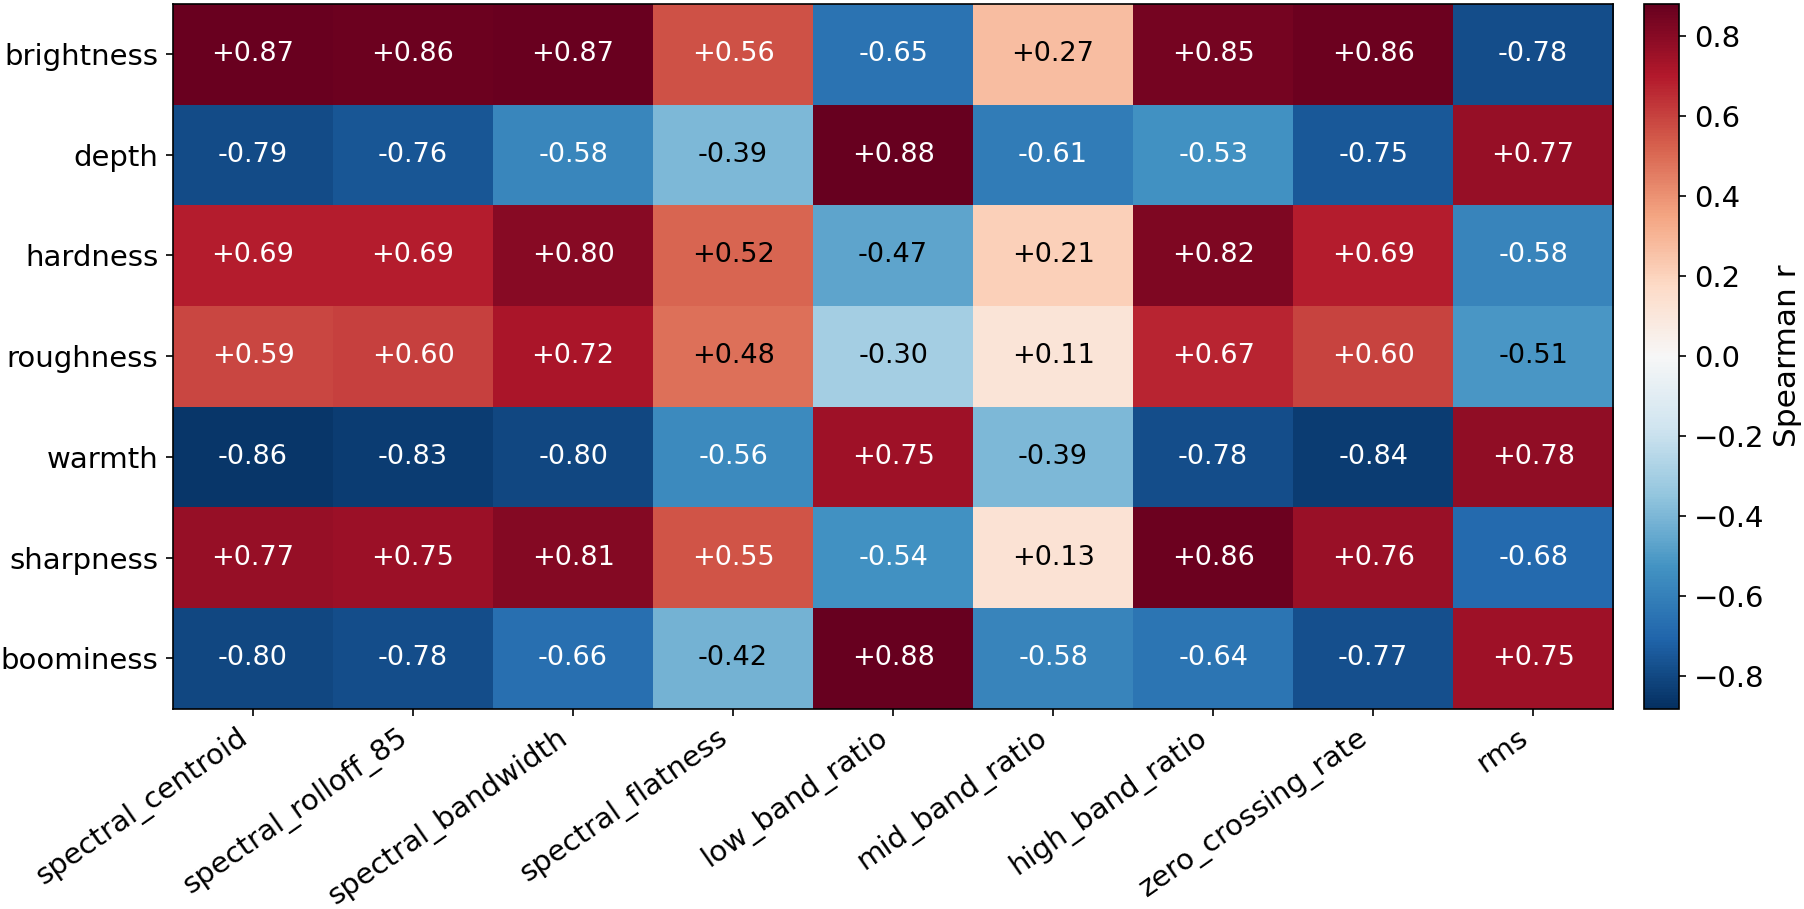
Figure 10
Spearman rank correlations between the 7 AudioCommons descriptors (rows) and 9 simple librosa acoustic features (columns) over all 9,998 random preset renders. Cells annotated with ; the diverging color scale is normalized to the observed correlation range (; deep red strongest positive, deep blue strongest negative). Brightness, depth, boominess, warmth, and sharpness show strong correlations with their expected acoustic predictors; roughness is the only descriptor without a dedicated psychoacoustic predictor in this feature set (see text).
Roughness, in contrast, is the one descriptor without a dedicated psychoacoustic predictor in this feature set: perceptual roughness is driven primarily by amplitude‑modulation and beating cues, and none of the nine features measure modulation content. The strongest correlations roughness does exhibit ( with spectral bandwidth and with the high‑band energy ratio) involve the same generic spectral features that predict brightness, sharpness, and hardness, suggesting that on this corpus the AudioCommons roughness model output tracks overall spectral brashness rather than a roughness‑specific cue. We note that the feature set here is deliberately small and standard; it is entirely possible that a dedicated modulation‑spectrum or psychoacoustic‑roughness feature outside this set would explain the roughness labels better. Combined with the strong clustering of presets at roughness already noted in Section 5.1, this places roughness as the AudioCommons descriptor whose label‑perception agreement on Sylenth1 audio is least supported by the present evidence; we accordingly flag it in Section 7 as the descriptor whose use requires the most caution. A perceptual study would be needed to convert the present convergent‑validity evidence into a direct measurement of perceptual agreement. We also provide a curated 44‑WAV listening‑audit set in the dataset repository, selected algorithmically by 11 complementary pathology criteria (convergent‑validity outliers per descriptor, contradictory descriptor pairs, roughness edge cases, statistical outliers, and presets maximally distant from any factory parent in parameter space), to support such studies.
5.5 Pitch sensitivity of timbral descriptors
The dataset’s A4‑only rendering convention is a deliberate simplification adopted for controlled comparability across presets; it also confines the released annotations to a single pitch and a single octave. To quantify the scope of this restriction rather than leave it as an unexamined assumption, we re‑render a stratified subset of 200 presets at 5 pitches spanning 4 octaves—A2, A3, A4, A5, A6 (MIDI 45/57/69/81/93)—through the identical normalization chain used to construct the dataset (peak normalization, integrated loudness normalization to LUFS, AudioCommons descriptor extraction). The subset is stratified by brightness quintiles to ensure coverage of the full descriptor range. This produces 1,000 plugin renders and 7,000 individual descriptor values.
Figure 11 reports, for each descriptor, the mean absolute deviation of the descriptor’s value at each pitch from its value at A4 for the same preset, with per‑cell values annotated. The shifts are substantial at register extremes and depend systematically on the descriptor: depth and boominess shift by approximately 16 units on the 0–100 AudioCommons scale at both A2 and A6; sharpness shifts by up to 14 units at A6; brightness, warmth, and roughness by 9–12; hardness is the most pitch‑invariant, with deviations of approximately 8 units at the extremes. Shifts are roughly symmetric around A4 across all descriptors, with intermediate‑pitch (A3, A5) deviations of 5–11 units.
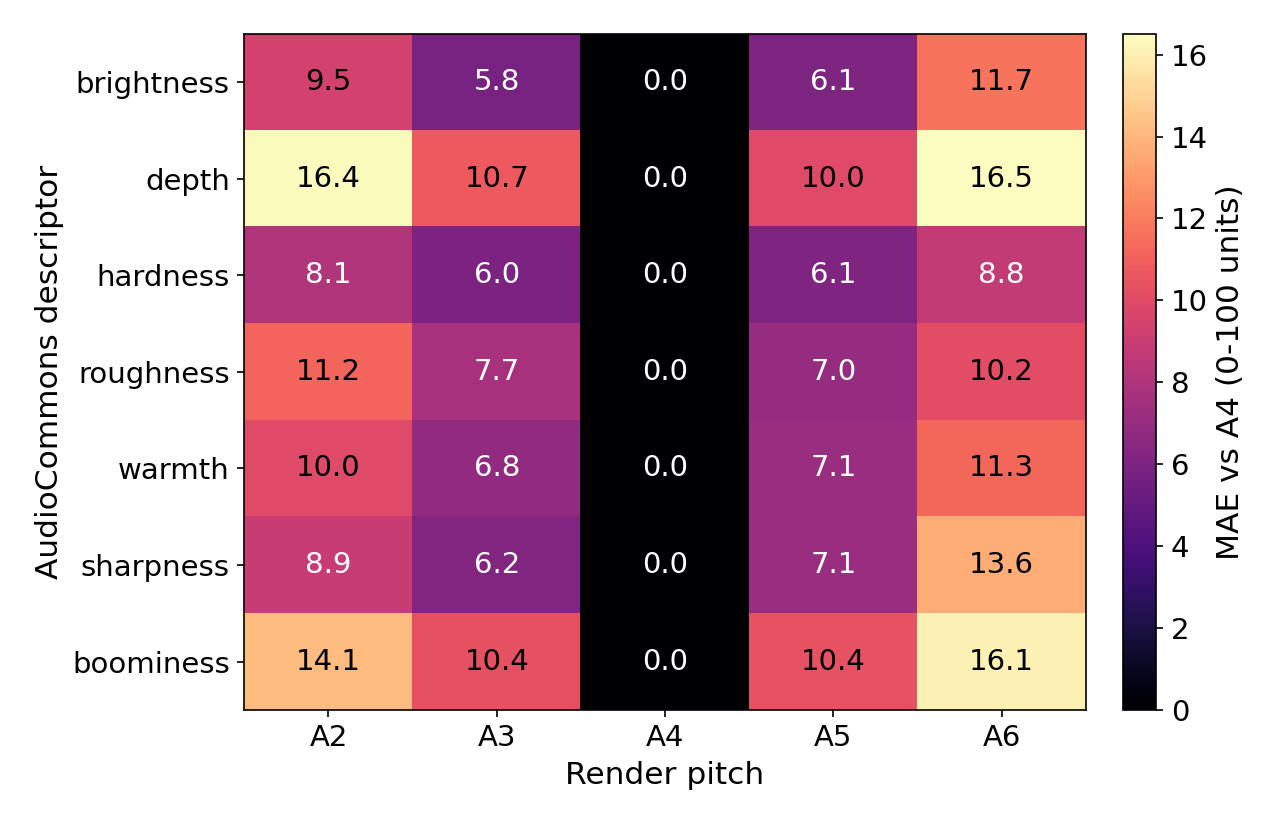
Figure 11
Mean deviation from A4 per (descriptor, pitch) on the 0–100 AudioCommons scale, for the stratified n = 200 multipitch subset. Cells are annotated with the numerical value; the color scale spans the observed min/max. Depth and boominess shift the most (16 units at extremes); hardness is the most pitch‑invariant.
Figure 12 complements these means with the full per‑preset distributions of signed deviations. Two properties emerge that the mean absolute deviations alone do not show. First, the shifts are directional: brightness and sharpness read systematically lower at A2 and higher at A6, while depth, boominess, and warmth shift in the opposite direction, consistent with register moving spectral energy relative to the descriptors’ preferred bands. Second, the spread across presets is substantial: per‑descriptor standard deviations of the absolute deviation reach 6–12 units at the register extremes (median absolute deviations 6–16), and individual presets deviate by up to 50 units. The released multipitch_sensitivity.csv reports the mean, standard deviation, median absolute deviation, and signed range for every (descriptor, pitch) cell.
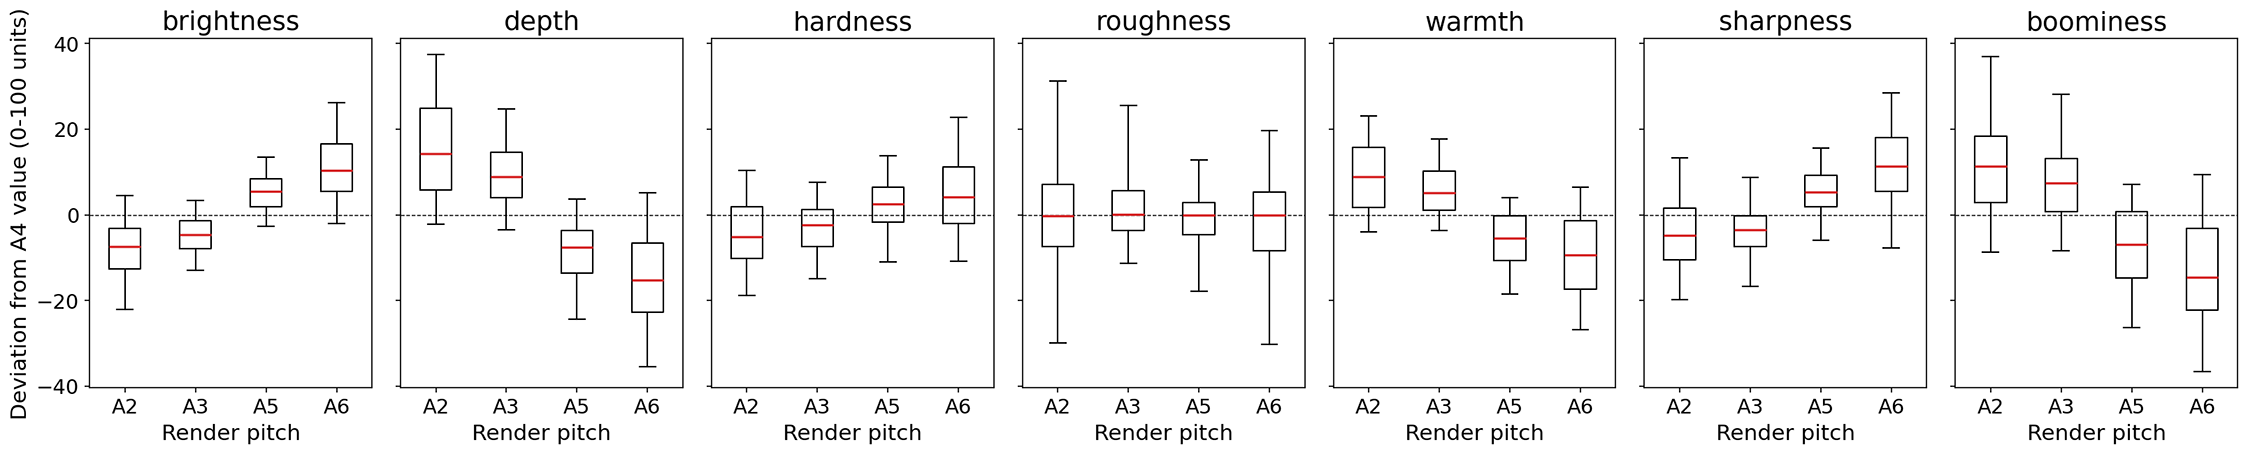
Figure 12
Per‑preset signed deviations from the A4 descriptor value at each render pitch (boxes: median and inter‑quartile range; whiskers: 5th–95th percentile; dashed line: no deviation), for the stratified multipitch subset. The shifts are directional: brightness and sharpness read lower at A2 and higher at A6, while depth, boominess, and warmth shift in the opposite direction; hardness and roughness are closest to symmetric about zero.
These results justify the A4 choice as a coherent benchmark at A4 but make explicit that the released descriptor annotations do not transfer linearly across registers: a preset’s brightness or depth value at A4 is not interchangeable with its value at A2 or A6. This finding is consistent with the broader literature on the pitch‑dependence of timbre‑semantic associations (Reymore et al., 2023). Section 7 carries this through as an explicit limitation of the present release.
5.6 Summary
Across the five preceding subsections the dataset exhibits coherent structure at every level: factory presets occupy narrow, curated regions of the 179‑parameter space while random presets expand coverage non‑uniformly under the synthesizer’s nonlinear constraints (§5.1; Supplementary File, Section S2); individual parameter– descriptor correlations are weak but form coherent families consistent with psychoacoustic theory (§5.2); PCA reveals strong low‑dimensional latent structure with each AudioCommons descriptor aligning with a distinct mixture of components (§5.3); the AudioCommons labels themselves track simple acoustic features sensibly on Sylenth1 output for six of seven descriptors, while roughness, which lacks a roughness‑specific acoustic correlate, remains the exception that future work should treat with caution (§5.4); and the A4 labels do not transfer linearly across register, with descriptor‑by‑pitch shifts of 8–17 units on the 0–100 scale at register extremes (§5.5). The dataset is thus structured enough to serve as a benchmark for timbre analysis and as a training resource for the conditional generative models and descriptor‑aware interfaces explored in the next section.
6 Applications and Use Cases
The Sylenth1‑10KPresets Dataset supports multiple MIR and HCI research directions, ranging from training conditional generative models that map perceptual descriptors to synthesizer parameters, to benchmarking descriptor prediction models with deterministic ground truth, to interpretable analysis of synthesizer control spaces, to the development of perceptually grounded interfaces for synthesizer control. To make these directions concrete, and to provide reference numbers against which future methods can be compared, we release three baseline implementations spanning the two principal directions of interest: parameter descriptor regression (the prediction direction) and descriptor parameter inversion (the generative direction). All three baselines share a single set of leakage‑free train/validation/test splits and a single, reversible parameter encoding; full code, trained model checkpoints, hyperparameters, and metric CSVs are released in the dataset repository5.
6.1 Recovery‑Based grouped splits
A naive row‑level train/test split of the dataset would place near‑duplicate mutant siblings in both partitions, since the 10,000 random presets are by construction few‑parameter mutations of the 292 factory progenitors (Section 3.4). The originating factory preset was not recorded at generation time, so we recover it post hoc by nearest‑factory assignment in the canonical 179‑parameter space, using a mixed distance that combines normalized over continuous and ordered‑numeric controls with Hamming over unordered categorical and boolean controls. Per‑feature normalization uses the inter‑quartile range of factory values, so that no single wide‑range parameter dominates the assignment.
We then split the 292 factory progenitors with a fixed seed and propagate the split label to each random preset via its assigned parent. The resulting partitions contain train ( factory, random), validation ( factory, random), and test presets ( factory, random); the random:factory ratio per split is close to but not exactly because progenitors carry different numbers of descendants. Random presets in the top of assignment distance (or whose nearest and second‑nearest factory differ by less than of the median runner‑up gap) are flagged as ambiguous in the released splits file; presets receive this flag. The full artifact is released alongside the dataset so that all reported numbers are reproducible.
For modeling we encode each preset’s 179 parameters into a fixed ‑dimensional vector via a reversible codec fitted on the training partition only: continuous parameters and 21 ordered‑numeric enums (compressor ratio, LFO/delay synced rates, oscillator note/octave/voice counts, polyphony, filter pole‑counts) are z‑scored, booleans become , and the remaining 34 categorical enums are one‑hot encoded with an extra UNK slot per block to handle unseen test‑time categories (yielding 145 numeric and 609 one‑hot dimensions). The decoder inverts each transform, snapping synced‑rate scalars to the nearest valid enum option and clamping continuous outputs to plugin‑validated ranges. We also establish the round‑trip metric’s noise floor by re‑rendering 20 random presets twice within a single plugin session: Sylenth1’s voice initialization is nondeterministic (initial oscillator phases, LFO state), so the within‑pipeline mean absolute deviation between paired renders is 1.0 for brightness/depth/warmth/boominess, 1.3 for roughness, 1.9 for hardness, and 2.0 for sharpness (1.5 macro), lower‑bounding the round‑trip error of any inversion method.
6.2 Baseline 1: Parameter descriptor regression
The simplest application enabled by the dataset is parameter‑to‑descriptor regression: given a preset’s 179‑key parameter dictionary, predict its seven AudioCommons descriptor values. Because the descriptors are themselves a near‑deterministic function of the parameters (via the rendering and feature‑extraction pipeline), this task acts as a sanity check on the encoding, the splits, and the dataset’s internal consistency. The absolute performance level also indicates which descriptors carry the most learnable signal from the parameter space alone.
We compare three models in increasing complexity. A mean predictor that always emits the training mean descriptor vector defines the floor. A ridge regression with characterizes the linearly recoverable signal in the encoded representation. An MLP regressor ( with ReLU activations, batch normalization, and dropout ) is trained with the Adam optimizer () and a smooth‑ loss on training‑standardized targets, with early stopping on validation MAE (patience 15 epochs). Targets are predicted on the standardized scale and converted back to native 0–100 units before metric computation.
Table 2 reports per‑descriptor and macro test MAE; following standard practice for nondeterministic methods, the MLP was trained with four different seeds, and its cells report mean standard deviation (the mean predictor and ridge regression are deterministic). The MLP wins on every descriptor at every seed and reduces macro test MAE from (mean predictor) and (ridge) to . The most predictable descriptor from parameters alone is warmth; the least predictable is roughness. Roughness’s position as the hardest descriptor to predict from parameters echoes its lack of a roughness‑specific acoustic correlate in Section 5.4 and its known ‑spike behavior discussed in Section 5.1; these three independent observations converge on roughness as the AudioCommons descriptor warranting the most careful handling in research building on this dataset.
Table 2
Parameter descriptor regression on the test split (), per‑descriptor and macro MAE in 0–100 units. Lower is better. The mean predictor and ridge regression are deterministic; MLP cells report mean standard deviation over four training seeds (0–3). The MLP wins on every descriptor; roughness is the hardest, warmth the easiest. The lowest macro MAE and the lowest per‑descriptor MAE, both achieved by the MLP, are shown in bold.
| Method | bright. | depth | hard. | rough. | warm. | sharp. | boom. | macro |
|---|---|---|---|---|---|---|---|---|
| Mean predictor | 17.26 | 15.65 | 15.94 | 16.24 | 14.31 | 16.06 | 15.02 | 15.78 |
| Ridge | 12.78 | 11.83 | 12.26 | 12.89 | 10.36 | 12.76 | 11.81 | 12.10 |
| MLP | 11.160.19 | 10.570.10 | 10.740.17 | 12.050.28 | 8.910.08 | 11.290.23 | 10.760.19 | 10.780.12 |
6.3 Baseline 2: Nearest‑Neighbor retrieval as inversion anchor
The inverse problem—given a target seven‑dimensional AudioCommons descriptor vector, return a preset whose render produces that timbre—is genuinely one‑to‑many: many distinct parameter configurations can realize the same perceptual profile. Before fitting any generative model, we therefore characterize what a non‑parametric memorization baseline already achieves, since this places a stringent lower bound on the round‑trip MAE any neural method must beat to claim improvement.
The nearest‑neighbor (NN) baseline indexes the random training presets together with the training factory presets by their stored AudioCommons descriptors. Given a test target descriptor vector, it returns the parameters of the training preset whose descriptors are closest in Euclidean distance (descriptors are z‑scored on the training partition before distance computation). The retrieved parameter dictionary is then passed through the same render‑and‑describe pipeline as the dataset itself was built with, and the recomputed descriptors are compared to the original target.
This baseline turns out to be extremely strong. On the full test partition (), NN retrieval achieves macro round‑trip MAE of (Table 3, first row), within – units on every descriptor (most accurate for warmth, least accurate for hardness). Comparing these numbers to the pipeline noise floor measured in Section 6.1 (per‑descriptor MAE –) shows that NN retrieval is at the noise‑floor ceiling on every descriptor; there is essentially no headroom in this metric for any other method to beat NN cleanly. We interpret this as a substantive finding about the dataset rather than a limitation of the metric: the dense, factory‑conditioned sampling makes within‑distribution descriptor‑to‑parameter retrieval effectively saturated by the dataset itself. Methods aiming to improve on NN must therefore either (i) substantially outperform retrieval on a metric that already approaches the synthesizer’s per‑render variance, or (ii) be evaluated under richer metrics that reward properties retrieval cannot capture such as generative diversity, conditional descriptor‑space coverage, or generalization to descriptor regions sparsely covered by the training partition.
Table 3
Descriptor parameter inversion on the test split (), per‑descriptor and macro round‑trip MAE in 0–100 units, along with audibility and validity rates. NN retrieval is fully deterministic and is reported from a single run; CVAE cells report mean standard deviation over four training seeds (0–3), with the audibility rate seed‑averaged. Validity was 100% for every method at every seed. NN retrieval sits at the pipeline noise floor on every descriptor; the CVAE is provided as released training infrastructure for future work and does not match the retrieval anchor on this single‑sample metric at any seed. The lowest macro MAE and the lowest per‑descriptor MAE, both achieved by NN retrieval, are shown in bold.
| Method | bright. | depth | hard. | rough. | warm. | sharp. | boom. | macro | audible |
|---|---|---|---|---|---|---|---|---|---|
| NN retrieval | 2.43 | 3.18 | 3.65 | 3.41 | 2.22 | 2.87 | 2.79 | 2.94 | 100.0% |
| CVAE () | 14.420.26 | 11.530.39 | 15.100.35 | 17.520.71 | 10.960.20 | 15.290.27 | 12.100.55 | 13.850.32 | 100.0% |
| CVAE () | 17.413.56 | 16.865.42 | 18.134.75 | 21.759.58 | 12.892.69 | 15.733.74 | 15.793.10 | 16.942.33 | 90.6% |
6.4 Baseline 3: A CVAE for descriptor‑conditioned inversion
As a generative baseline we train a CVAE with output heads matching the codec block structure: the encoder maps the ‑dim encoded preset and the ‑dim descriptor to a ‑dim Gaussian latent posterior; the decoder emits MSE‑regressed numeric values, per‑block softmax distributions over one‑hot enums, and binary logits for booleans. The loss sums these reconstruction terms with a KL term whose weight anneals linearly from 0 to 0.5 over the first 25% of training. Adam (, batch size 256), validation reconstruction‑loss early stopping (patience 15). Descriptors are standardized on the training partition before conditioning.
At evaluation we generate one preset per test target under two sampling strategies: cvae_mean (, the prior center) and cvae_sample (). The decoder’s output is passed through the codec’s inverse transform—inverse‑standardizing and clamping numeric heads, snapping ordered‑numeric enums to valid options, argmax‑decoding one‑hot heads, and sigmoid‑thresholding booleans at 0.5—before rendering and re‑extracting descriptors. Table 3 reports per‑descriptor results; as with the regression baseline, the CVAE was trained with four different seeds and its cells report mean standard deviation, while NN retrieval is deterministic and reported from a single run. The two decoding modes behave very differently across seeds. Prior sampling (cvae_sample) is stable, reaching macro with 100% validity and audibility at every seed. The mode (cvae_mean) is markedly seed‑sensitive, at macro with per‑descriptor standard deviations up to , and with per‑seed audibility ranging from 67.1% to 100% (mean 90.6%): two of the four seeds produced decoders that emit near‑silent patches for a substantial fraction of targets. Both modes fall well short of the NN anchor (macro 2.94) at every seed. The descriptor‑level ordering mirrors the regression baseline, with warmth the easiest descriptor for all three methods and roughness the hardest for both CVAE modes (NN retrieval’s least accurate descriptor is hardness).
Read together, the three baselines suggest two takeaways for future work. First, retrieval saturates the round‑trip metric on this dataset: meaningful neural inversion progress will require either substantially outperforming NN on single‑sample MAE (which itself sits at the synthesizer’s noise floor) or evaluation against diversity‑aware metrics that reward properties retrieval cannot capture. Second, roughness is consistently the hardest AudioCommons descriptor to model; it is the least predictable from parameters (Section 6.2), most poorly matched by both inversion methods (Table 3), and the one descriptor without a roughness‑specific acoustic correlate (Section 5.4). The full encoding codec, training scripts, trained CVAE checkpoint, and round‑trip evaluation harness are released so that future work can iterate on these baselines without re‑implementing the pipeline.
7 Limitations and Future Work
We make the limitations of the present release explicit.
7.1 Single synthesizer, single architecture
The dataset is built from a single subtractive synthesizer, Sylenth1, and reflects the timbral universe accessible through subtractive synthesis with that instrument’s specific filter, oscillator, and modulation design. The construction methodology—KDE‑conditioned mutation of factory progenitors, headless rendering, AudioCommons descriptor extraction, recovery‑based grouped splits—generalizes in principle to any VST3‑hosted synthesizer whose parameter surface is discoverable through Pedalboard, but the released annotations cover Sylenth1 only. The pipeline is expected to work well for additive, subtractive, and most analogue‑emulating architectures, where small parameter perturbations correspond to small perceptual changes; FM and other strongly nonlinear synthesis paradigms may require a different sampling strategy with stronger validity gates, because small parameter changes can produce categorically different timbres.
7.2 AudioCommons label validity on synthesized audio.
The seven AudioCommons descriptors were developed and validated primarily on real‑world and musical‑instrument audio (Pearce et al., 2019); their behavior on synthesized audio is not directly established by the AudioCommons papers themselves. Section 5.4 provides a convergent‑validity check showing that the AudioCommons labels track expected acoustic predictors (Spearman ) for five of the seven descriptors on Sylenth1 A4 output—brightness, depth, boominess, warmth, and sharpness—with hardness showing a moderate relationship (). Roughness is the descriptor whose validity on synthetic audio is least supported by current evidence: it lacks a dedicated psychoacoustic predictor in the (deliberately small and standard) feature set tested (Section 5.4), and it carries the known ‑spike behavior (Section 5.1). Its residual correlations are with the generic spectral features that predict the brightness family, and a dedicated modulation‑spectrum or psychoacoustic‑roughness feature outside this set might well explain the roughness labels better. Research building on this dataset should treat roughness with the most caution. Future work would benefit from a perceptual listening study (we provide a curated 44‑WAV listening‑audit set in the repository to support such studies), and from richer timbre‑semantic vocabularies: Reymore and Huron (2020) and Reymore et al. (2023) map the breadth of timbre semantics on musical‑instrument sounds well beyond what the seven AudioCommons descriptors cover, and Hayes et al. (2022) study semantic descriptors on synthesizer sounds directly.
7.3 Single pitch.
All released renders use the same MIDI note (A4). Section 5.5 quantifies the pitch‑dependence of the AudioCommons labels under our normalization chain: depth, boominess, and sharpness shift by 13–17 units on the 0–100 scale at the register extremes (A2, A6); brightness, warmth, and roughness shift by 9–12; hardness is the most pitch‑invariant at 8 units. The A4 annotations therefore do not transfer linearly across register, consistent with the broader literature on pitch‑dependence of timbre semantics (Reymore et al., 2023). A multi‑pitch extension of the released annotations is the most direct line of future work; our five‑pitch study deliberately holds pitch class fixed (an A‑only octave ladder) to isolate register effects, and a richer design following Reymore et al. (2023) would also vary pitch class (e.g., mixed A and E notes across octaves) or sample broader register categories (low, middle, high).
7.4 Static conception of timbre.
The decision to exclude arpeggiator and pitch‑modulation controls (Section 3.3) reflects a deliberately static framing of timbre, in which a preset is characterized by a single steady‑state spectral snapshot. While the research tradition reviewed by McAdams (2019) has itself largely treated timbre as a static property, that review raises the issue of timbre as a dynamic, emergent phenomenon, and more recent work argues explicitly that describing timbre through fixed acoustic features risks treating it as a static, measurable object, when it is better understood as a contextually constructed, practice‑dependent phenomenon (Saitis et al., 2025); a future release could include time‑varying renders and the parameter families currently excluded, at the cost of conflating timbral and rhythmic information.
7.5 Inherited factory biases and unlogged heuristics.
The KDE‑based random generator embeds the design biases of the 292 factory progenitors into the random subset (Section 5.1; Supplementary File, Section S2); random presets expand coverage but remain anchored to those priors and are not a uniform sample of the full control space. Separately, the corrective audibility heuristic (Section 3.4) is intended as a last‑resort guard, but the current release does not log which presets triggered it. A re‑generation with full per‑preset provenance logging (parent factory preset, retry counts, and heuristic invocations) is planned future work.
8 Conclusion
We have introduced Sylenth1‑10KPresets, a dataset of 10,292 synthesizer presets pairing complete Sylenth1 parameter configurations with 7 AudioCommons timbral descriptors computed from loudness‑normalized A4 renders. The statistical analyses in Section 5 characterize the structure, coverage, and label validity of the released annotations: factory presets occupy a narrow expert‑designed manifold inside the broader random‑preset coverage; parameter–descriptor correlations form coherent families consistent with psychoacoustic theory; PCA reveals interpretable low‑dimensional latent structure; and a convergent‑validity analysis supports the AudioCommons labels on Sylenth1 audio for six of seven descriptors, with roughness flagged for cautious use. The three released baselines (Section 6) demonstrate the dataset’s value as a benchmark for both prediction and generative inversion, and identify open research directions where neural methods must improve on a strong non‑parametric retrieval anchor. We hope this resource and its accompanying analysis toolchain support future work on timbre‑conditioned synthesis, interpretable generative models, and semantic sound‑design interfaces.
9 Reproducibility
The dataset, analysis pipeline, and its accompanying code scripts are publicly available5 to ensure full reproducibility. The pipeline is implemented in Python using open‑source libraries (numpy, scipy, pandas, sklearn, pyloudnorm, plotly) with Spotify’s Pedalboard library mediating Sylenth1 interaction. The custom application handles preset extraction, parameter randomization, audio rendering, AudioCommons descriptor computation, and JSON export, ensuring every preset follows identical processing protocols. All randomization strategies are documented in standalone modules for extensibility. The exact AudioCommons descriptor extraction scripts, including A4 rendering configuration, LUFS normalization, and preprocessing steps, are released to enable recomputation from preset parameters. PCA implementations store fitted model parameters (component loadings, explained variance) to enable direct comparison with future datasets. Complete documentation describes dataset structure, parameter conventions, and enumerated value encoding.
Notes
[1] Link to Sylenth1 Webpage: https://www.lennardigital.com/sylenth1/ (accessed 2026‑09‑16).
[2] Link to Serum Webpage: https://xferrecords.com/products/serum-2 (accessed 2026‑09‑16).
[3] Link to Massive Webpage: https://www.native-instruments.com/en/products/komplete/synths/massive/ (accessed 2026‑09‑16).
[4] Link to Diva Webpage: https://u-he.com/products/diva/ (accessed 2026‑09‑16).
[5] The Sylenth1‑10KPresets Dataset: https://github.com/JoeCameron1/Sylenth1-Preset-Dataset-Framework (accessed 2026‑10‑20).
[6] Sylenth1‑10KPresets Dataset Sylenth1 Parameter Descriptions: https://github.com/JoeCameron1/Sylenth1-Preset-Dataset-Framework/blob/main/sylenth_params.json (accessed 2026‑10‑20).
Acknowledgments
This work was supported by the Department of Computer Science & Technology, University of Cambridge, and the UK Research and Innovation Engineering and Physical Sciences Research Council (UKRI EPSRC).
Data Accessibility Statement
The Sylenth1–10KPresets dataset and all accompanying materials are openly available in the project repository5: the full preset parameter dictionaries and AudioCommons descriptor annotations, the rendered A4 audio for the factory and random subsets, the train/validation/test splits file, the parameter‑encoding codec, trained model checkpoints, per‑seed and aggregated metric files, the listening‑audit set, and the complete generation and analysis toolchain.
Funders
University of Cambridge, Engineering and Physical Sciences Research Council.
Competing Interests
The authors have no competing interests to declare.
Authors’ Contributions
J.M.C. conceived the project; designed and implemented the dataset‑generation framework, analysis toolchain, and baseline experiments; performed the analyses; and wrote the manuscript. A.F.B. supervised the project and contributed to the review and editing of the manuscript.
Additional File
The additional file for this article can be found as follows:
Supplementary File 1
A Dataset and Analysis Framework for Large‑Scale Synthesizer Preset Generation. DOI: https://doi.org/10.5334/tismir.367.s1.