
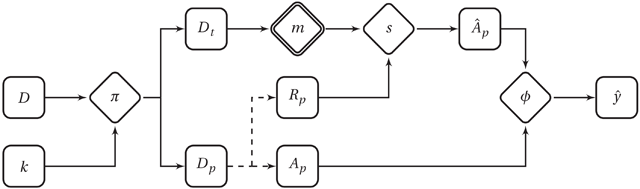
Figure 1
Pipeline of a single iteration k of a classification experiment evaluating a system construction method m (combination of feature extraction and learning algorithm) on a music collection D. Square-shaped nodes represent data structures; diamond-shape nodes represent processes. A double border indicates a treatment factor with fixed level. Solid lines indicate information flow; dashed lines join components of the same data structure. π is a data assignment/partitioning function. Dt is the training collection; Dp is the testing collection, with Rp the raw data (e.g., recordings) and Ap the corresponding annotations. (Rt and At omitted for simplicity.) s is the trained system, the predicted annotations, ϕ the performance metric function, and an estimate of the theoretical performance y – i.e., given the true distribution.
Algorithm 1
Regulated Bootstrap resampling strategy, given a collection D and a threshold nr ∈ ℕ.
| RegulatedBootstrap(D, nr): - Initialise: Dt ← (∅), Dp ← (∅) - For each a ∈ A: 0. Define Da as the instances in D with ai = a; 1. Phase 1: Stratified Bootstrap Sampling (a) Create dt by uniformly sampling with replacement |Da| instances from Da; (b) Create dp ← Da\dt; 2. Phase 2: Size Verification (a) Define Zt as the union of all zi in dt; (b) Create by selecting all instances (r, a, z)i in dp with zi not in Zt; (c) If , proceed to Phase 3, as it lacks enough regulated instances; otherwise, go to Phase 4; 3. Phase 3: Curated Sampling (a) Define Za as the union of all zi in Da; (b) Initialise a hold-out collection dh ← (∅); (c) Randomly select a z ∈ Za, and remove it from Za; (d) Define dz as the instances in Da with z ∈ zi;5 (e) Append dz to dh: dh ← dh͡ dz; (f) If |dh| < nr, go to (3c), as dh still lacks enough instances; (g) Create dt by uniformly sampling with replacement |Da| instances from Da\dh; (h) Create dp ← Da\dt; (i) Go to Phase 2 to check size requirements; 4. Phase 4: Concatenation (a) Append dt to Dt: Dt ← Dt͡ dt; (b) Append dp to Dp: Dp ← Dp͡ dp; - Return: train/test pair (Dt, Dp) |
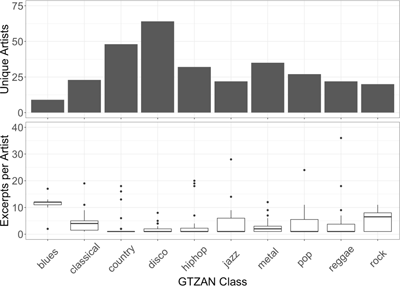
Figure 2
Artist distribution across classes in GTZAN, showing the number of unique artists (Top) and the quartiles of the number of excerpts per artist (Bottom) in each class. Dots indicate outliers.

Table 1
Estimated proportion of train/test samples requiring curated sampling for each GTZAN class if drawn using Alg. 1 to regulate over artists, from 100,000 simulations with nr = 10.
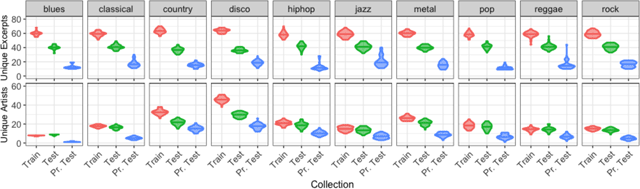
Figure 3
Distribution of the number of unique excerpts (Top) and artists (Bottom) per class in the training and testing collections sampled from GTZAN using bootstrap regulated over artists.
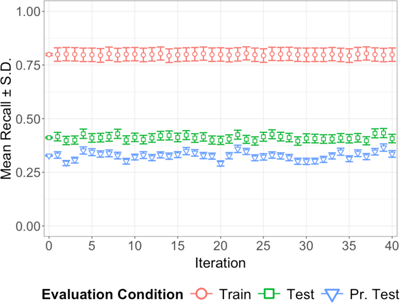
Figure 4
Mean recall (± standard deviation) in train, test, and pr. test for each regulated bootstrap iteration over all combinations of feature extraction and learning algorithms on original GTZAN recordings. Position 0 represents the mean recall over all iterations.
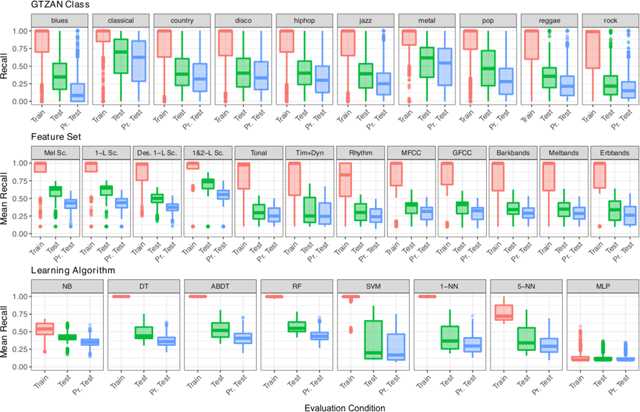
Figure 5
Quartiles of (mean) recall distribution obtained in train, test, and pr. test, marginalised over GTZAN class (Top), feature set (Middle), and learning algorithm (Bottom).
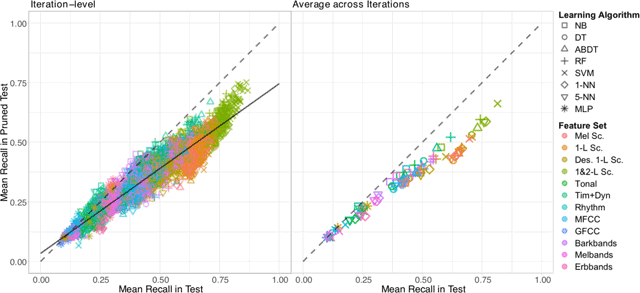
Figure 6
Relationship between mean recall in test and pr. test obtained by systems constructed with different combinations of feature representations and learning algorithms on training collections sampled from GTZAN with bootstrap regulated over artists, represented both as individual values for each system (Left) and averages across iterations (Right). The dashed line indicates the case of equal mean recall in test and pr. test; the solid line indicates the linear regression model fitting the data as in Eq. (1).
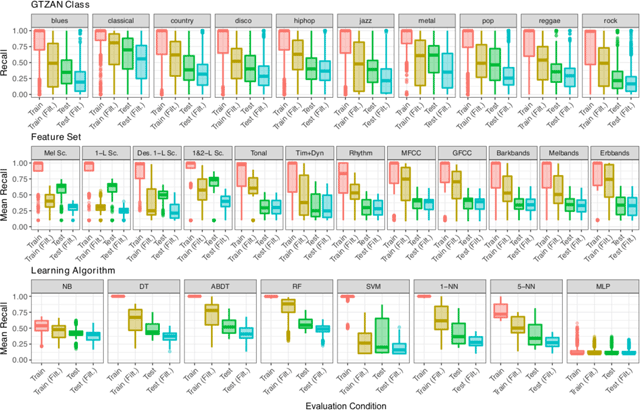
Figure 7
Quartiles of (mean) recall distribution obtained in train, train (filt.), test, and test (filt.), marginalised over GTZAN class (Top), feature set (Middle), and learning algorithm (Bottom). Note that the colours in this figure not matching those in Figs. 3, 4 and 5 correspond to different evaluation conditions.
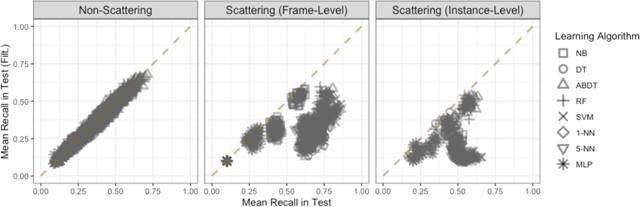
Figure 8
Relationship between mean recall in test and test (filt.) obtained by systems constructed with different combinations of feature representations and learning algorithms using training collections sampled from GTZAN with bootstrap regulated over artists, grouped by the source of feature set. Non-Scattering features are extracted with essentia. Instance-level scattering features correspond to Des. 1-L Sc.; the rest are frame-level. The dashed line indicates the case of equal mean recall in test and test (filt.).
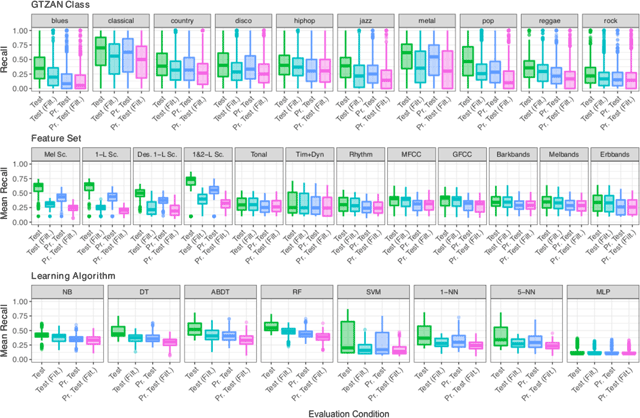
Figure 9
Quartiles of (mean) recall distribution obtained in test, test (filt.), pr. test, and pr. test (filt.), marginalised over GTZAN class (Top), feature set (Middle), and learning algorithm (Bottom). Note that the colours in this figure not matching those in Figs. 3, 4, 5 and 7 correspond to different evaluation conditions.
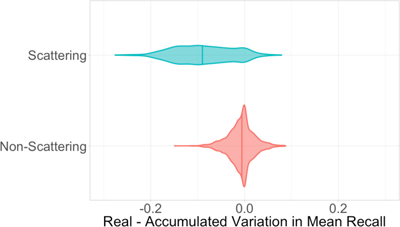
Figure 10
Distribution of differences between the real variation ΔR and the accumulated variation ΔA in mean recall for artist and infrasonic regulation interventions in GTZAN, grouped by the source of feature set.
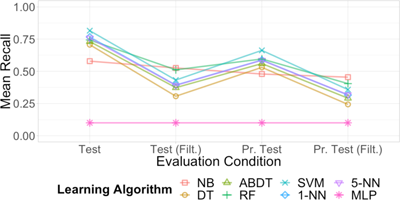
Figure 11
Interaction between learning algorithm and evaluation condition in average mean recall for systems constructed using training collections sampled from GTZAN with bootstrap regulated over artists and 1&2-L Sc. feature representations.