
1 Introduction
Music's ability to express and evoke emotions is a universally acknowledged phenomenon, transcending cultural and linguistic barriers. It plays a pivotal role in human experience, offering a medium through which emotions can be articulated, shared, and understood. This unique capacity of music to convey a wide range of emotional states makes it a subject of considerable interest in the interdisciplinary fields of psychology, neuroscience, and musicology (Jia et al., 2021; Zentner et al., 2008). In particular, music emotion recognition (MER) is a computational task aimed at automatically identifying the emotional expressions contained within music or the emotions elicited in listeners by music (Yang and Chen, 2011). MER researchers rely on a collection of datasets, where the amount of annotated tracks per dataset is rather small (Aljanaki et al., 2017; Zhang et al., 2018). This is unsurprising since collecting high‑quality emotional annotations of tracks is complex and expensive (Strauss et al., 2024). While small‑scale datasets are valuable for MER advancements (Laurier et al., 2009), for music retrieval and recommendation tasks, it is inevitable to have access to a large catalog of tracks annotated with emotion labels, especially in the context of personalized music retrieval (Yang, 2021). An alternative method for gathering emotional data in music involves extracting emotions from user tags. These tags are readily accessible and available on a large scale. However, they often contain noise and personal bias, and they also lack the depth and quality that set apart expert‑annotated data. Such expert data are typically collected through user studies informed by psychological principles (Laurier et al., 2009; Moscati et al., 2024).
There are several approaches to MER, aiming to tag tracks with corresponding emotion labels or profiles. Textual information is one of the data types employed in assignments that incorporate emotion labels, as evidenced by numerous studies (Hu et al., 2009; Hu and Downie, 2010; Zad et al., 2021). Specifically, when undertaking emotion recognition based on music data, lyrics frequently serve as the primary source of input (Choi et al., 2018; da Silva et al., 2022). A different body of research highlights the significant role of acoustic features in emotion recognition tasks (Gómez‑Cañón et al., 2021; Panda et al., 2020; Yang, 2021; Yang et al., 2008). This perspective sheds light on the complexity of musical emotion, suggesting that the emotional content of music cannot be fully captured through lyrics alone. The recognition that both modalities, textual and acoustic, play a critical role in the perception and interpretation of musical emotions is well known in the scientific community (Gómez‑Cañón et al., 2021; Rajan et al., 2021; Xue et al., 2015).
Most of the aforementioned approaches perform classification for emotion labels per track or employ basic or categorical emotion models (e.g., arousal and valence) in a supervised learning setting, often failing to capture the richness and variability of musical emotions (da Silva et al., 2022; Yang, 2021). In contrast, this work draws on a domain‑specific model devised to account for the richness of emotions induced by music (Zentner et al., 2008). Starting with 515 emotion terms, Zentner et al. (2008) have successively eliminated those terms that were rarely used to describe music‑evoked emotions and retained a few dozen core emotion terms, titled GEMS for Geneva Emotional Music Scale. GEMS is hierarchically organized into three second‑order and nine first‑order factors, as shown in Figure 1. These factors are (1) vitality (power and joyful activation); (2) sublimity (wonder, transcendence, tenderness, nostalgia, and peacefulness); and (3) unease (tension and sadness). An additional distinctive feature of GEMS is that it accounts not only for perceived emotion but also, and in particular, for induced emotions, as was later shown by neuroimaging work (Trost et al., 2012). Consequently, a MER approach based on this model can capitalize on a rich spectrum of music‑specific emotional information (Aljanaki et al., 2014).
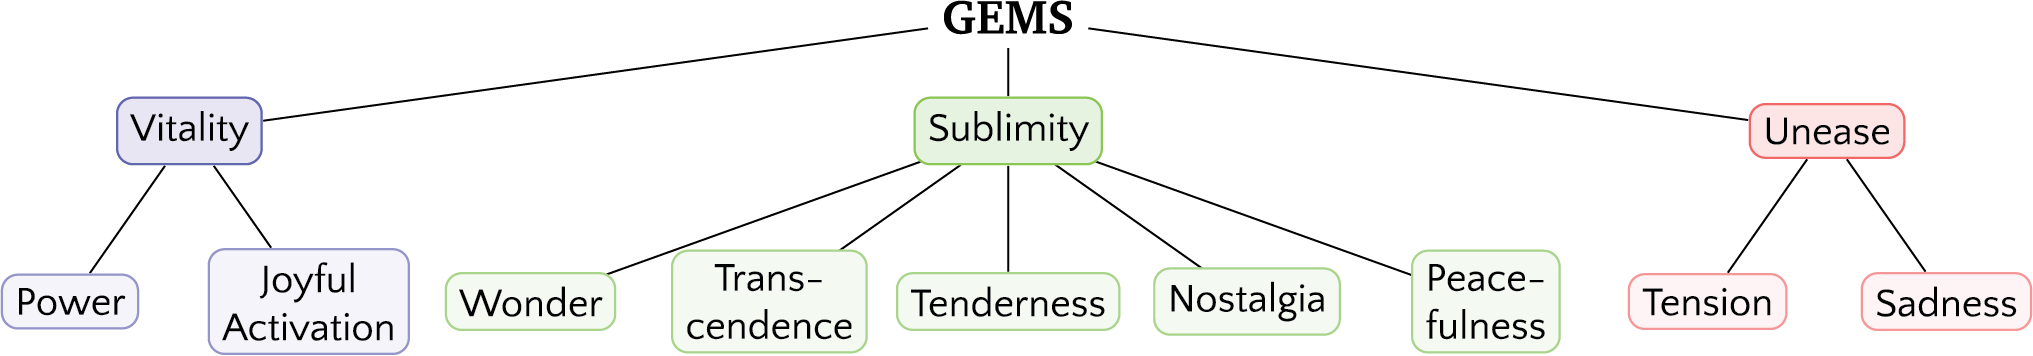
Figure 1
The Geneva Emotion Music Scale with nine dimensions based on the factor analysis in the work of Zentner et al. (2008).
As mentioned earlier, the number of tracks in MER datasets is limited due to the scalability challenges associated with the annotation process. This limitation impacts the ability of supervised learning approaches to generalize effectively across a vast track catalog, as the availability of annotated data directly influences model performance. Semi‑supervised learning, on the other hand, allows us to effectively incorporate information of unlabeled tracks as well as labeled ones in the learning process, leading to enriched track embeddings for the final labeling task. Moreover, prior works often ignore user and track meta‑data, which could be used to improve the learning process.
In this paper, we propose a novel framework employing the semi‑supervised multi‑relational graph neural network for emotion recognition (SRGNN‑Emo) for predicting the emotion profiles of tracks. We define the emotion profile of a music track as the set and intensity of emotions that the track evokes in listeners (Kim et al., 2010; Strauss et al., 2024). Unlike traditional MER approaches, our model advances the field by adopting a multi‑target regression strategy, aiming to capture more accurately the broad spectrum of emotions sparked through music. Building upon the premise that human listening behaviors encapsulate a wealth of information about evoked emotions, we innovate by integrating semi‑supervised learning with human annotations and a multi‑relational graph framework. This integration allows us to exploit the rich, albeit underutilized, data from user interactions, genres, and tags, hypothesizing that such data, when structured into diverse graph formats and refined by a semi‑supervised learning framework, induce valuable emotion‑related information. Our framework can predict emotional intensities across nine dimensions, significantly enhancing the emotional insights derived from track embeddings compared to traditional methods that typically rely on fewer, music–non‑specific emotion dimensions such as valence and arousal.
Our approach not only aims to mitigate the limitations imposed by the scarcity of large, annotated datasets but also introduces a novel perspective on using multi‑relational graph structures to enrich track representations. To summarize, the main technical contributions of our work are as follows:
We propose a novel multi‑relational graph structure, based on user interactions, genres, and tags.
We integrate a semi‑supervised learning approach for multi‑target regression into the framework of graph neural networks (GNNs).
We use a high‑quality dataset based on state‑of‑the‑art psychological research into music‑evoked emotions for fine‑grained MER (Strauss et al., 2024).
Extensive experiments show that our proposed model significantly outperforms state‑of‑the‑art competitors on the task of MER.
To ensure reproducibility, we will release the code of our experiments and model weights on GitHub.1
2 Related Work and Background
2.1 Music emotion recognition
MER aims to understand and categorize emotions in music through computational means. Key contributions to this field address the different facets of music and emotion, proposing various methodologies for recognition and analysis (Yang and Chen, 2011). Kim et al. (2010) have presented a comprehensive overview of MER, introducing a computational framework that generalizes emotion recognition from categorical domains to a two‑dimensional space defined by valence and arousal, facilitating novel emotion‑based music retrieval and organization methods. Other works (Choi et al., 2018; Panda et al., 2020; Xue et al., 2015; Zad et al., 2021) have also emphasized the role of integrating lyrics, chord sequences, and genre metadata alongside audio features, demonstrating how multifaceted approaches can significantly enhance MER systems' accuracy.
The development of MER has also been propelled by the creation of extensive datasets and embeddings tailored for this purpose—for instance, the MuSe dataset (Akiki and Burghardt, 2021), which includes 90,000 tracks annotated with arousal, valence, and dominance values inferred from tags. Moreover, works by Alonso‑Jiménez et al. (2023), Bogdanov et al. (2022), and Castellon et al. (2021) have evaluated various audio embeddings, including Jukebox and musicnn embeddings, for their effectiveness in MER tasks. Additionally, recent evaluations of state‑of‑the‑art music audio embeddings have been conducted using tasks such as the MediaEval challenge series on Emotion and Theme Recognition in Music (Tovstogan et al., 2021) applied to the MTG‑Jamendo mood/theme auto‑tagging dataset (Bogdanov et al., 2019).
Advances in MER research have also been characterized by the development of novel features and the design of sophisticated machine learning models. Bhatti et al. (2016) have shown the effectiveness of using physiological signals, specifically via electroencephalography, to recognize emotions elicited by different music genres, highlighting the potential of brain signals in providing insights into emotional responses to music. Panda et al. (2018) have improved music emotion classification by introducing highly emotionally relevant audio features related to music performance expressive techniques or musical texture. The application of deep learning techniques has shown promising results in recognizing emotions from music, as seen in the work by Zhang et al. (2023); these authors have extracted features from log‑Mel spectrograms by using multiple parallel convolutional blocks and applied attention in combination with a sequence learning model for dynamic music emotion prediction. Others have proposed structuring musical features from different modalities (audio and lyrics) over a heterogeneous network to incorporate different modalities in a unique space for MER (da Silva et al., 2022).
Our proposed approach, SRGNN‑Emo, innovates by leveraging semi‑supervised learning with user interaction data and metadata for nuanced emotional profiles, extending beyond traditional supervised methods.
2.2 Semi‑supervised node representation learning
Node representation learning is focused on creating simplified vector representations of a graph's nodes that reflect both their connections and features. Traditional methods (without deep learning) are mostly based on random walks to examine the neighborhoods around nodes (Grover and Leskovec, 2016; Perozzi et al., 2014; Tang et al., 2015).
GNNs are neural architectures specifically tailored for graph‑structured data. GNNs learn meaningful node representations by iteratively aggregating and transforming information from a node's neighbors, effectively capturing complex relational and structural dependencies in graphs (Hamilton et al., 2017; Kipf and Welling, 2017). Since the introduction of graph convolutional networks (GCNs) (Kipf and Welling, 2017; Velickovic et al., 2018), a specific type of GNNs, more advanced techniques for node embedding have been developed, including a layer sampling algorithm (Hamilton et al., 2017) designed to work with large graphs by focusing on a set neighborhood of nodes.
Recently, we have observed a shift toward self‑supervised contrastive approaches. These methods distinguish between positive (similar neighborhood) and negative (far away in the graph) examples to compute loss. A deep graph infomax (DGI) (Velickovic et al., 2019) enhances the mutual information between individual nodes and the whole graph representations. Hassani and Ahmadi (2020) have introduced a method for learning representations from different viewpoints by contrasting nearby neighbor encodings with those from a more extensive graph diffusion. However, because contrastive learning often requires a significant number of negative examples, it can be challenging to scale for large graphs. An alternative proposed by Thakoor et al. (2021) named bootstrapped graph latents (BGRLs) avoids this issue by predicting alternative augmentations of the input, eliminating the need for contrasting with negative samples.
Despite significant advances in node representation learning, relatively little attention has been given to multi‑relational GNNs and their application in specific domains like MER. Existing works such as those by Schlichtkrull et al. (2018), who proposed the concept of relational graph convolutional networks (R‑GCNs) for knowledge graph completion, and Vashishth et al. (2020), who explored compositional embeddings for relationships, have made strides in handling complex relational structures. However, these approaches have not been widely explored within the context of semi‑supervised learning. Additionally, although semi‑supervised node representation learning has become increasingly popular in tasks such as node classification and link prediction (Hamilton et al., 2017; Kipf and Welling, 2017), its application to emotion recognition tasks remains rare and under‑investigated (Horner et al., 2013).
In this paper, we present an innovative framework that not only aligns with recent trends toward contrastive learning in GNNs but also extends them by specifically addressing the multi‑relational and semi‑supervised nature of the problem space in MER.
3 Dataset
In this work, we leveraged high‑quality data from psychology‑informed user studies on emotions evoked by music. We used the Emotion‑to‑Music Mapping Atlas (EMMA)2 database (Strauss et al., 2024), which contains 817 music tracks. These tracks were last annotated in 2023 based on their emotional impact, as assessed using GEMS (Zentner et al., 2008). We focused on the GEMS‑9 variant of this scale, which is a checklist version of the original 45‑item GEMS that assesses each dimension with one item only. Previous research has demonstrated emotion profiles derived from the original GEMS and GEMS‑9 to be highly correlated (Jacobsen et al., 2024). Emotions induced by each track were rated on these dimensions by an average of annotators. We are one of the first to leverage this information‑rich dataset for MER purposes, demonstrating the significant potential it offers for advancing research in this field. To enhance the reliability of our analyses, we restricted our focus to tracks with a higher interrater agreement, selecting those with an intraclass correlation coefficient (ICC) above 0.5, which indicates moderate reliability (Strauss et al., 2024). While a higher ICC threshold would ensure even greater reliability, it would significantly reduce the dataset size, thereby limiting the diversity and generalizability of the data. However, it is worth mentioning that the ICC across all tracks demonstrates good interrater agreement, with a mean ICC value of .
As our goal was to design a model for large‑scale emotion recognition in a semi‑supervised manner, we required a dataset containing not only rich information about the audio but also relevant meta‑data. Therefore, we employed the Music4All‑Onion (Moscati et al., 2022) dataset. This dataset enhances the Music4All (Santana et al., 2020) dataset by incorporating 26 additional audio, video, and metadata characteristics for 109,269 music pieces. It also includes 252,984,396 listening records from 119,140 Last.fm3 users, enabling the use of user–item interactions. Intersecting EMMA with the Music4All‑Onion dataset led to 509 tracks with available emotion profiles, audio features, and meta information. Due to our hypothesis that human listening behavior in combination with track metadata encapsulates valuable information about evoked emotions, we extracted graph structures from user listening sessions, track genres, and user tags, as described in detail in Section 4.1.
For each track available in the Music4All‑Onion dataset, we used pretrained instances of musicnn (Pons and Serra, 2019), MAEST (Alonso‑Jiménez et al., 2023), and Jukebox (Dhariwal et al., 2020) to represent the audio signals. The musicnn model is based on deep convolutional neural networks trained to classify music based on its content (Pons and Serra, 2019). The MAEST representations are based on spectrogram‑based audio transformers, which employ patchout training on a supervised task (Alonso‑Jiménez et al., 2023). Jukebox is a generative model for music that uses a deep neural network trained on a vast corpus of tracks to understand and generate music (Dhariwal et al., 2020).4 These models were selected for their music‑specific design, which ensures closer alignment with musical features such as melody, harmony, and rhythm that are critical for emotion recognition (Moscati et al., 2025).5
4 Proposed Method (SRGNN‑Emo)
In this section, we introduce a novel framework leveraging a multi‑relational graph structure and semi‑supervised learning. Multi‑relational graphs are complex data structures that model different types of relations that correspond to different user data types in our case (e.g., Figure 2). Our model is designed to extract emotional profiles from music tracks by integrating rich user interaction data with diverse metadata and sophisticated content data. Figure 2 provides an overview of our proposed approach, where each module will be explained in the following.
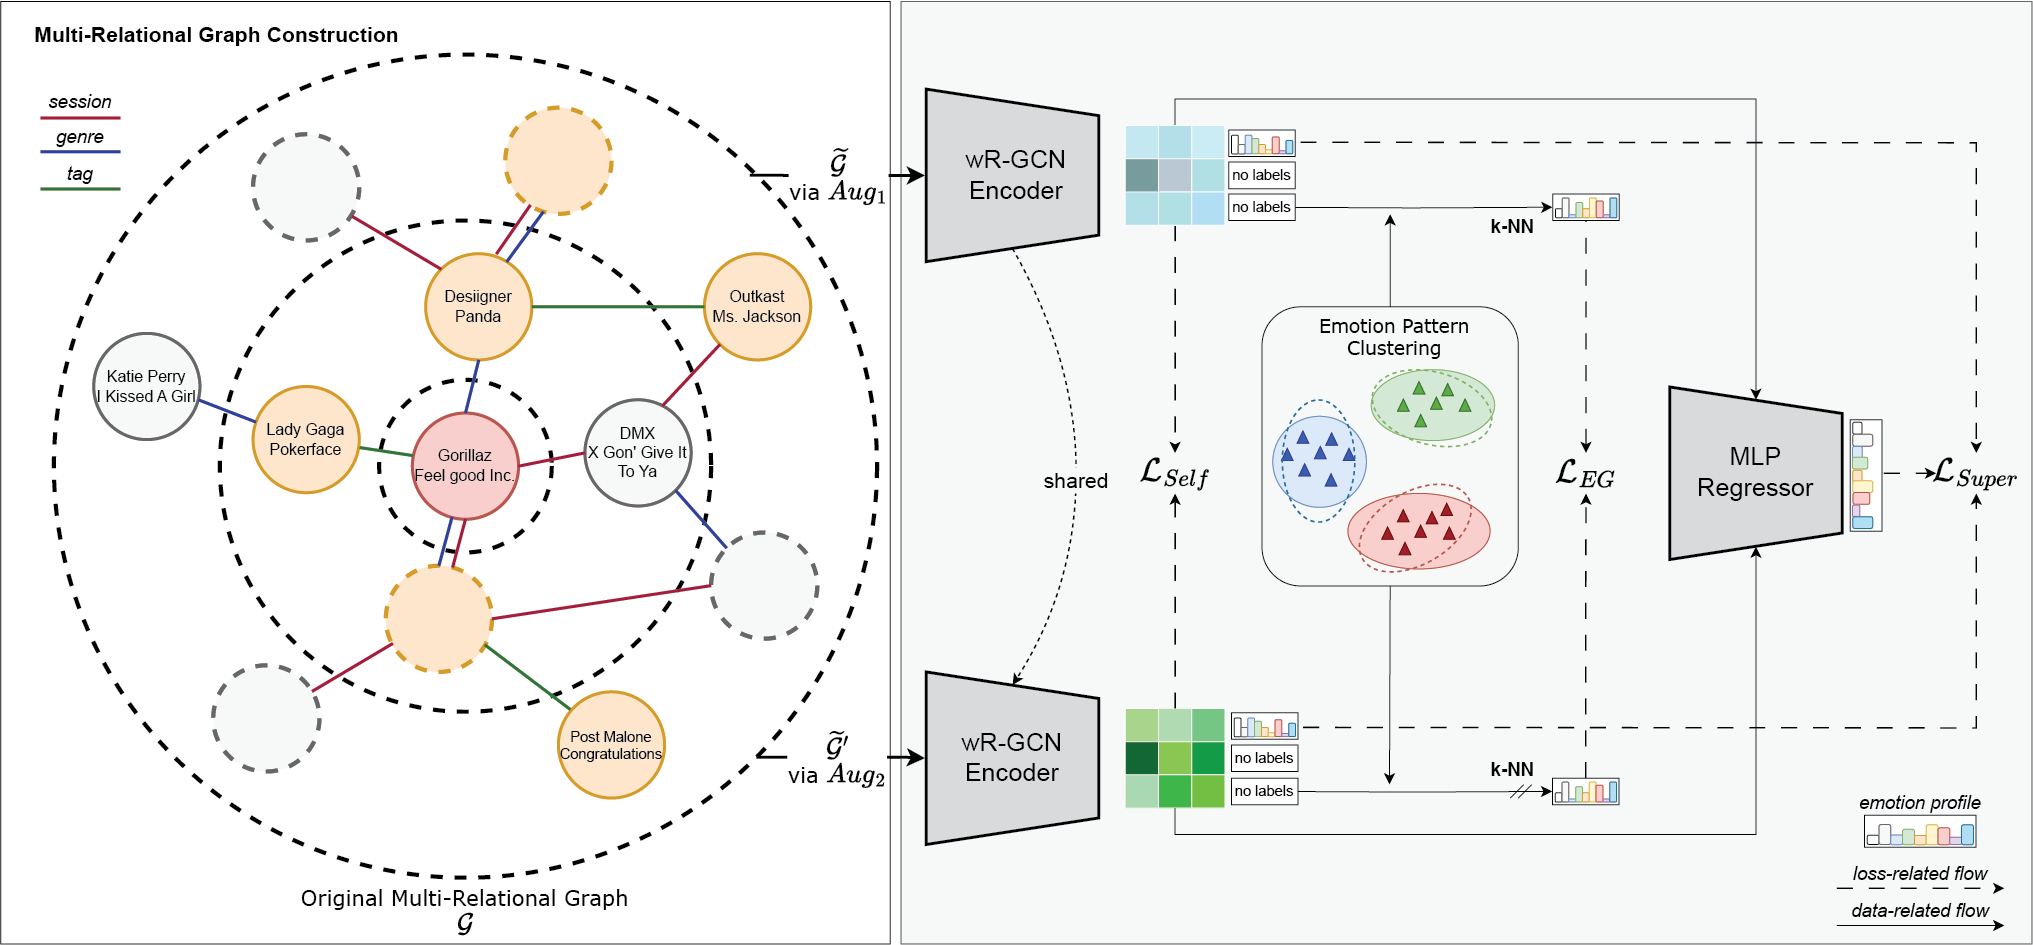
Figure 2
Illustration of SRGNN‑Emo which constructs a multi‑relational graph with nodes representing tracks and edges symbolizing connections based on sessions, genres, or user tags shared among tracks. We used stochastic graph augmentations to generate two distinct graph views, which were processed by a shared encoder to ensure robust and invariant node representations in a self‑supervised manner. Emotion‑guided consistency objective () optimization aimed to align unlabeled nodes with emotion profile patterns of labeled nodes across augmented graph views. The learned node representations were then fed into a multi‑layer perceptron regressor to predict the emotion profile of each track.
4.1 Multi‑relational graph construction
We sought to derive representations of tracks that encapsulate nuanced similarities between music tracks, based on shared genres, commonality in listening sessions, and user‑assigned tags. Therefore, we constructed a multi‑relational graph , focusing on tracks as nodes, with edges representing different types of relationships, such as sessions, genres, or tags, that connect these tracks. Specifically, nodes in our multi‑relational graph are tracks , and an edge is established between two tracks if they are part of the same listening session by a user, share one or multiple genres, or have been tagged with one or multiple identical tags by users. The strength of the connection, represented as the edge weight , reflects the frequency of shared relationships , such as the number of common tags, genres, or sessions. We normalized the edge weights per relation such that, for each track and each relation , the edge weights can be symmetrically scaled using the formula:
where represents the degree of node for relation . This symmetric normalization ensures that, for each track and each relation , the edge weights are adjusted based on the degrees of both connected nodes and therefore mitigates the inherent popularity bias of tracks.
4.2 Emotion‑based graph encoder
To learn node representations on the multi‑relational graph introduced before, we employed a weighted relational GCN (wR‑GCN) encoder, which adapts the GNN message‑passing framework to handle the complexities of a multi‑relational graph (Schlichtkrull et al., 2018) and additionally incorporates edge weights. The GNN message‑passing framework (Gilmer et al., 2017) enables nodes to exchange and integrate information with their neighbors, iteratively refining their representations to capture the graph's structural and relational context. The general differentiable message passing is formulated as:
where represents the hidden state of node at the ‑th layer, with being the dimensionality of the layer's representation. The incoming messages, , are combined and processed through an activation function , such as ReLU. is the set of incoming messages for node , typically corresponding to the set of incoming edges. The function is often a neural network or a simple linear transformation (Kipf and Welling, 2017).
This transformation has proven effective in accumulating and encoding features from local, structured neighborhoods (Kipf and Welling, 2017; Velickovic et al., 2018). For our multi‑relational, weighted graph, we defined a simple propagation model (Schlichtkrull et al., 2018) for computing the forward‑pass update of a node and extended it with the usage of edge weights:
where represents the set of neighbors of node under relation , and is the edge weight between nodes and for relation . This equation intuitively accumulates the transformed feature vectors of neighboring nodes through a weighted and normalized sum. Unlike regular GCNs, we herein incorporated relation‑specific transformations, depending on the type and direction of the edge. Additionally, to ensure that the node's representation at layer is informed by its representation at layer , we introduced a self‑connection under each relation type for each node.
Initially, , representing the node features. We used the corresponding representations of the tracks (e.g., musicnn, MAEST, or Jukebox) as the node features , where is the number of nodes in the graph and is the feature dimension. We defined as a uniformly sampled neighborhood across all relations to manage memory and computation effectively (Hamilton et al., 2017).
4.3 Semi‑supervised multi‑target regression
Contrastive learning has been shown to be a valuable paradigm for self‑supervised learning and consistency regulation in the context of GNNs (Lee et al., 2022; Thakoor et al., 2021). We employed this idea as the grounding learning task for our graph‑based model and extended it with a semi‑supervised loss in the process.
Given an input graph, we can generate two distinct graph views through stochastic graph augmentations. These augmentations involve randomly masking different node features and dropping a different subset of edges per graph to introduce variability. The resulting augmented graph views are denoted by and , where and represent the adjacency matrices of the augmented graphs and and denote the feature matrices post‑augmentation, respectively.
4.3.1 Representation learning via shared encoder
To learn robust, low‑dimensional node‑level representations, we employed a shared encoder strategy that learns consistent representations across different graph augmentations. Both augmented graph views were input into our shared wR‑GCN encoder, denoted as , to learn low‑dimensional node‑level representations. The node‑level representations obtained from the encoder for the two views are and , respectively.
To ensure the learned node representations are invariant to the augmentations, SRGNN‑Emo minimizes the cosine distance between the representations from the two differently augmented views on a node‑wise basis and is formalized as follows:
In their experiments, Lee et al. (2022) have found that using a single shared encoder in combination with subsequent supervisory signals was sufficient to prevent representation collapse, while also offering the benefits of simplicity and efficiency.
4.3.2 Emotion‑guided consistency objective
While our framework effectively leverages self‑supervised learning signals—patterns and features extracted from unlabeled data without explicit supervision—through contrastive learning, it had yet to incorporate the limited but accessible emotion profiles available for tracks. To leverage emotion label information effectively, we refined our method by aligning tracks with emotion profile patterns. Starting with a set of labeled tracks with known emotion profiles, we identified distinct emotion patterns through clustering, which then served as reference points (centroids) in the emotion profile space. Our goal was to group the unlabeled tracks around these centroids, ensuring their predicted emotion profiles remain consistent across differently augmented views of the graph. By doing so, we aimed to maximize the consistency and reliability of node assignments to these emotion patterns, effectively bridging the gap between labeled and unlabeled tracks.
Given the set of labeled tracks, denoted as , we applied a k‑means clustering algorithm to extract distinct clusters, each representing a unique emotion pattern. The result was a set of centroids , where each corresponds to the centroid of cluster . These nine dimensions correspond to the emotional dimensions defined by GEMS, which serve as the basis for clustering. For each unlabeled track , we computed the predicted emotion profile using a non‑parametric weighted k‑nearest neighbors (k‑NN) approach to generate pseudo‑labels, formulated as:
where computes the cosine similarity between two vectors; and denote the support (labeled) node representations and the emotion profiles, respectively; and denotes the set of nearest neighbors of in .
To enhance reliability, we restricted the k‑NN predictions to only confident pseudo‑labels by measuring the distance between each pseudo‑label and the centroid . We retained nodes whose predicted profile showed a similarity above a threshold with at least one centroid, forming the set . The emotion‑guided consistency objective could then be defined as:
where denotes the mean squared error (MSE) loss function and and are the confidently predicted emotion profiles for track from the augmented graphs. Using a high value for prioritizes confident pseudo‑labels in the objective function, which has been shown to effectively mitigate confirmation bias (Arazo et al., 2020; Lee et al., 2022).
This approach not only incorporates label information to guide the learning of emotion profile patterns but also ensures that predictions for unlabeled tracks are made with greater confidence, thereby improving the overall model's ability to generalize from labeled to unlabeled data in the context of a multi‑target regression task.
4.3.3 Emotion profile prediction
After learning robust node representations through the shared wR‑GCN encoder and ensuring consistency across augmented graph views, the final task of SRGNN‑Emo is to predict the emotion profile for each music track. To achieve this, we used a multi‑layer perceptron (MLP) that takes as input the averaged node representations from the two augmented views and outputs the emotion profile per node/track. The MLP consists of three fully connected layers, each followed by a LeakyReLU activation function and a dropout layer to prevent overfitting. The output of the MLP is a vector, , representing the predicted emotion intensities across the nine emotion categories. To train the model to predict nine continuous emotion dimensions, we employed an MSE loss as our supervised objective:
4.4 Final objective
The combined objective function for SRGNN‑Emo is expressed as:
where and are coefficients that control the contribution of the self‑supervised loss and the emotion‑guided loss to the overall training objective, respectively. The supervised loss ensures the model effectively predicts continuous emotion profiles for labeled nodes.
5 Experiments and Results
We compared SRGNN‑Emo against traditional and graph‑based baselines for MER. In the following, we detail our experimental setup, including data preparation, model configurations, and metrics used for evaluation.
5.1 Baselines
We systematically compared our proposed model against a diverse array of baseline approaches, spanning traditional machine learning models, graph‑based approaches, and a novel custom convolutional neural network, each harnessing unique feature representations from music analysis frameworks.
We began with traditional machine learning models, including logistic regression (LR) and support vector regression (SVR). Additionally, co‑training regression (COREG) (Zhou and Li, 2005) was used, enhancing generalization by co‑training two regressors on separate views. An MLP model with three layers (similar to our SRGNN‑Emo model) served a dual purpose: it depicted a baseline on its own and acted as the regressor for semi‑supervised learning tasks in the graph‑based models (with the learned node representations as input).
Graph‑based models are crucial for understanding the relational structure of music data. This category includes label propagation (LP) (Zhu and Ghahramani, 2002) for emphasizing data clustering, GCNs (Kipf and Welling, 2017) and graph attention networks (GATs) (Velickovic et al., 2018) for integrating node features with the graph topology, DGIs (Velickovic et al., 2019) focusing on mutual information maximization, and BGRL representation (Thakoor et al., 2021) aimed at enhancing robustness through consistent node representation across views. MRLGCN (da Silva et al., 2022) structures musical features over a heterogeneous network and learns a multi‑modal representation using a GNN with features extracted from audio and lyrics for MER.
Completing our set of baselines, we designed a fully supervised, content‑based, end‑to‑end method named DOMR+ for density‑based oversampling for multivariate regression with data transformation. The DOMR+ method consists of two components: a fully convolutional network model and a pre‑processing stage. The model employs multiple convolutional and sub‑sampling layers without dense layers. To address the challenges of data scarcity and imbalance in the labels, the pre‑processing stage integrates oversampling with data transformation techniques. Candidate data points for oversampling were identified using kernel density estimation, which determines the rarity of data points based on their density within the feature space. Instead of directly oversampling these candidates, the method applies class‑preserving audio transformations, which minimally transforms the original audio while retaining its fundamental properties, including filtering, equalizing, noise addition, scale changes (pitch shifting and time stretching), distortions, quantization, dynamic compression, format encoding/decoding (e.g., MP3, GSM), and reverberation (Mignot and Peeters, 2019). These transformations ensure that the augmented data remain representative of the underlying distribution, enhancing the model's ability to generalize, while avoiding the risk of overfitting caused by repetitive synthetic samples.
5.2 Experimental setup
We preprocessed the target variables representing emotions by applying z‑normalization, which ensures each variable has a mean of 0 and a standard deviation of 1. We employed stratified 10‑fold cross‑validation based on binning to validate the performance of our models comprehensively.
For performance evaluation, we relied on two metrics: root mean squared error (RMSE) and coefficient of determination (). RMSE measures the average magnitude of the errors between the predicted and actual values. A lower RMSE indicates better performance. , on the other hand, is a goodness‑of‑fit measure for regression models and assesses the proportion of variance in the dependent variable that is predictable from the independent variables, with values closer to 1 indicating better model fit.
All baseline models were carefully tuned via grid search, optimizing hyperparameters including (but not limited to) the number of layers , number of neighbors , learning rate, dropout, and regularization strength, depending on the respective model requirements. For our proposed model, SRGNN‑Emo, the Adam optimizer (Kingma and Ba, 2015) was used, with the learning rate set to 0.001 and regularization set to . We tuned its hyperparameters within specific ranges: the number of layers in the wR‑GCN was set between 1 and 5, the number of neighbors was chosen from between 5 and 50, and the and weight parameters were logarithmically adjusted within the range of 0.1–10. Additionally, dropout rates were varied between 0.0 and 0.5 to prevent overfitting. The number of clusters and nearest‑neighbors were searched in and , correspondingly.
5.3 Performance analysis
Table 1 summarizes the multi‑target regression performance of various models, including traditional machine learning methods, graph‑based models, and our proposed SRGNN‑Emo framework. The results demonstrate that SRGNN‑Emo achieves the lowest RMSE and highest score, indicating superior prediction performance (statistically significant) and model fit, respectively.
Table 1
Multi‑target regression performance for different models across three representation types. The best results are in boldface and the second‑best results are underlined. All improvements of SRGNN‑Emo compared to the second‑best performing model are significant (Wilcoxon signed‑rank test, ). Models marked with † do not use any underlying track representation.
| Rep. | musicnn | MAEST | Jukebox | |||
| Model | RMSE (SE) | (SE) | RMSE (SE) | (SE) | RMSE (SE) | (SE) |
| LR | 0.8443 (0.02) | 0.2470 (0.05) | 1.3821 (0.06) | ‑1.0731 (0.22) | 1.0301 (0.04) | ‑0.1403 (0.09) |
| SVR | 0.8188 (0.01) | 0.2968 (0.01) | 0.7862 (0.01) | 0.3504 (0.02) | 0.9802 (0.02) | 0.0163 (0.01) |
| COREG | 0.8742 (0.02) | 0.1140 (0.05) | 0.8613 (0.02) | 0.1346 (0.08) | 0.8680 (0.02) | 0.1244 (0.05) |
| MLP | 0.8132 (0.02) | 0.3106 (0.02) | 0.8938 (0.03) | 0.1576 (0.08) | 0.8579 (0.02) | 0.2193 (0.06) |
| LP† | 0.9488 (0.03) | 0.0806 (0.01) | 0.9488 (0.03) | 0.0806 (0.01) | 0.9488 (0.03) | 0.0806 (0.01) |
| GCN | 0.8071 (0.02) | 0.3158 (0.04) | 0.7781 (0.02) | 0.3568 (0.05) | 0.7492 (0.04) | 0.4039 (0.05) |
| GAT | 0.8167 (0.03) | 0.2992 (0.07) | 0.7856 (0.02) | 0.3476 (0.05) | 0.7567 (0.02) | 0.3926 (0.03) |
| DGI | 0.8042 (0.02) | 0.3184 (0.06) | (0.01) | 0.3644 (0.06) | (0.02) | (0.04) |
| BGRL | (0.02) | (0.05) | 0.7939 (0.02) | 0.3370 (0.07) | 0.7905 (0.02) | 0.3843 (0.05) |
| MRLGCN | 0.8592 (0.04) | 0.2600 (0.04) | 0.7868 (0.03) | (0.05) | 0.7932 (0.03) | 0.3651 (0.05) |
| DOMR+† | 0.8291 (0.03) | 0.2777 (0.08) | 0.8291 (0.03) | 0.2777 (0.08) | 0.8291 (0.03) | 0.2777 (0.08) |
| SRGNN‑Emo | 0.7973 (0.03) | 0.3305 (0.06) | 0.7707 (0.01) | 0.3724 (0.05) | 0.7411 (0.02) | 0.4180 (0.04) |
Representing traditional machine learning approaches, LR, SVR, and COREG show relatively higher RMSE values, indicating lower predictive performance. Their values are also significantly lower, confirming less variance explained by these models. The baseline MLP shows competitive performance when relying on musicnn representations, but it is outperformed by graph‑based approaches with the other two representations (MAEST and Jukebox).
Among the graph‑based approaches, DGI and BGRL show competitive performance with the lowest RMSE and highest among the graph‑based models for two different representations, ranked second after our SRGNN‑Emo. GCN and GAT also demonstrate robust performances but are slightly outperformed by DGI or BGRL, depending on the underlying representation. Meanwhile, our model, SRGNN‑Emo, outperforms all baseline models and indicates a statistically significant improvement in terms of RMSE and compared to the second‑best models, DGI and BGRL.
5.4 Ablation study
The ablation study, detailed in Table 2, assessed the impact of individual components of SRGNN‑Emo by removing , , and separately. The results illustrate the essential roles of these components in the model's overall performance. Removing the self‑supervised loss () slightly increased the RMSE across five out of nine emotional dimensions, suggesting that this component helps to stabilize the learning process by enforcing consistent node representations across different graph augmentations. The removal of the emotion‑guided consistency objective () led to a noticeable degradation in performance across eight out of nine emotional dimensions. This confirms that plays a crucial role in refining node embeddings by aligning them more closely with known emotion profile patterns, thus enhancing the model's ability to generalize from labeled to unlabeled data. Omitting the supervised loss () results in significant performance drops across all emotional dimensions, with RMSE scores rising substantially. This drastic decline highlights the importance of direct supervision in guiding the network toward accurate emotion profile predictions. Interestingly, while DGI outperformed SRGNN‑Emo in two emotional dimensions—sadness and tension—it did not achieve consistently better performance across all emotion dimensions, indicating limitations in its ability to fully capture the emotional variations present in the dataset.
Table 2
RMSE scores of models (using the best‑performing representations from Table 1) across multiple emotion targets. Abbreviations of emotion dimensions correspond to wonder, transcendence, tenderness, nostalgia, peacefulness, joyful activation, power, sadness, and tension. All improvements of the best‑performing models (boldface) are statistically significant compared to the second‑best models (underline) per emotion dimension (Wilcoxon signed‑rank test, ).
| Model | wond | tran | tend | nost | peace | joya | power | sadn | tens | GEMS‑9 |
| MLP (musicnn) | 0.9312 | 0.9653 | 0.7330 | 0.8936 | 0.6466 | 0.8099 | 0.8007 | 0.7711 | 0.7675 | 0.8132 |
| DGI (Jukebox) | 0.9059 | 0.9425 | 0.6647 | 0.8094 | 0.7162 | 0.7511 | 0.6627 | 0.6569 | 0.7464 | |
| SRGNN‑Emo (Jukebox) | 0.8972 | 0.9345 | 0.6518 | 0.8026 | 0.6162 | 0.6930 | 0.7425 | 0.7411 | ||
| (A) w/o | 0.9177 | 0.9384 | 0.6532 | 0.8192 | 0.6086 | 0.7050 | 0.7653 | 0.6713 | 0.6829 | 0.7513 |
| (B) w/o | 0.9041 | 0.9387 | 0.6636 | 0.8245 | 0.6110 | 0.7082 | 0.7650 | 0.6845 | 0.6779 | 0.7530 |
| (C) w/o | 1.2372 | 1.0996 | 1.2454 | 1.2210 | 1.3543 | 1.3329 | 1.2424 | 1.2907 | 1.2339 | 1.2508 |
5.5 Impact of hyper‑parameters
In this section, we investigate the impact of different hyper‑parameters. We focus on the number of layers in the wR‑GCN and the number of emotion profile clusters , since these hyper‑parameters are related to various parts of the model architecture. Figure 3 shows the performance of our model with different settings of layers on the described dataset using musicnn representations. A higher number of layers in the multi‑relational network does not necessarily lead to an increase in performance due to the issue of over‑smoothing, where node representations converge to the same values (Chen and Wong, 2020; Kipf and Welling, 2017). For our dataset, we could find a sweet spot layer setting of 2.
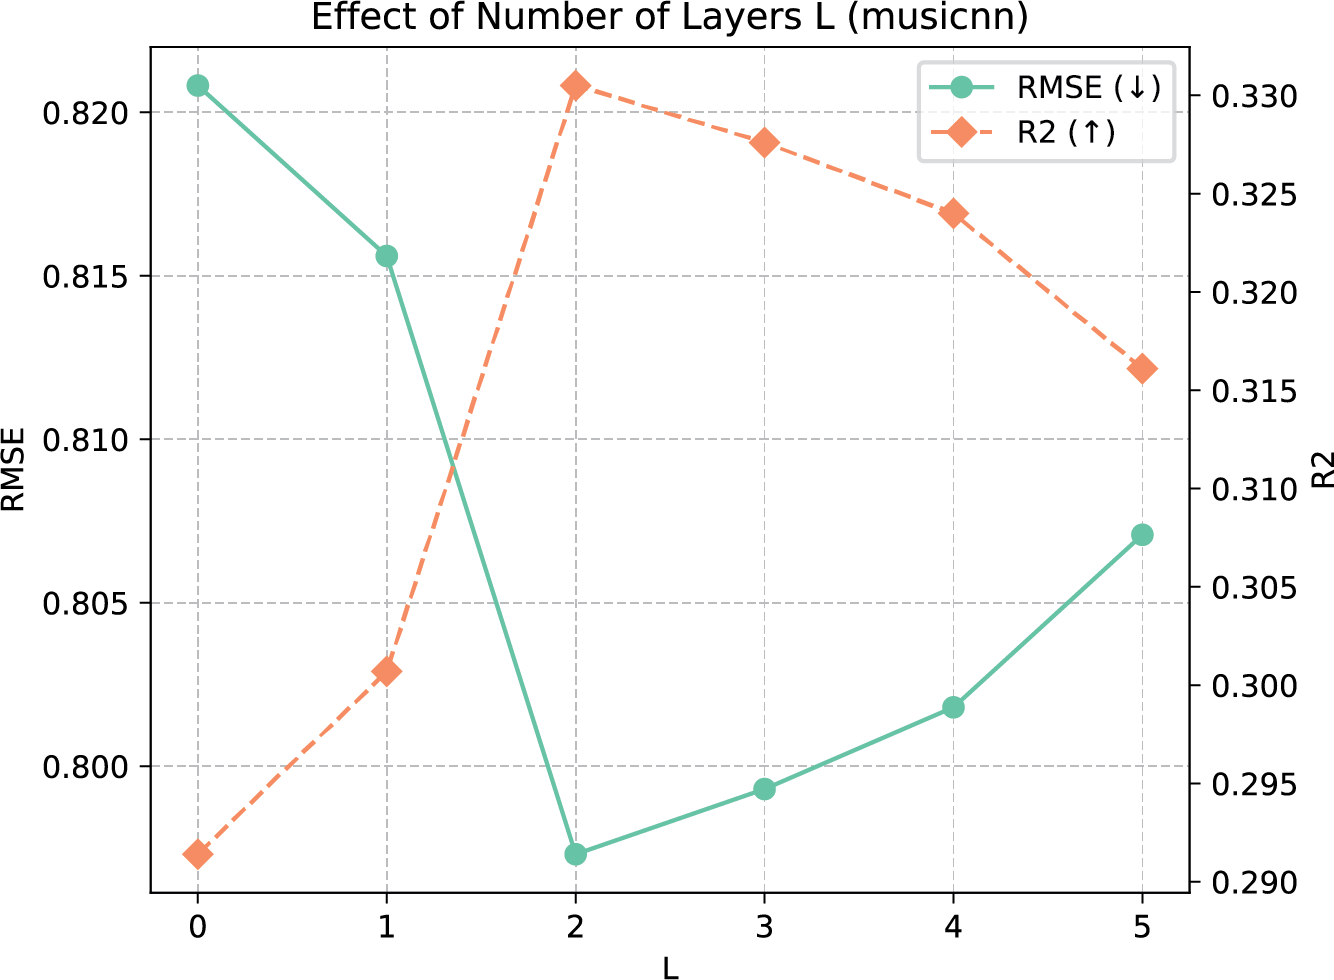
Figure 3
Performance impact of different number of layers in our wR‑GCN component.
Figure 4 shows the performance differences between runs relying on musicnn representations with a different number of emotion profile clusters. The best‑performing setting for was 10 clusters, which aligns with previous analyses of emotion profiles in GEMS‑9 by Chełkowska‑Zacharewicz and Janowski (2021).
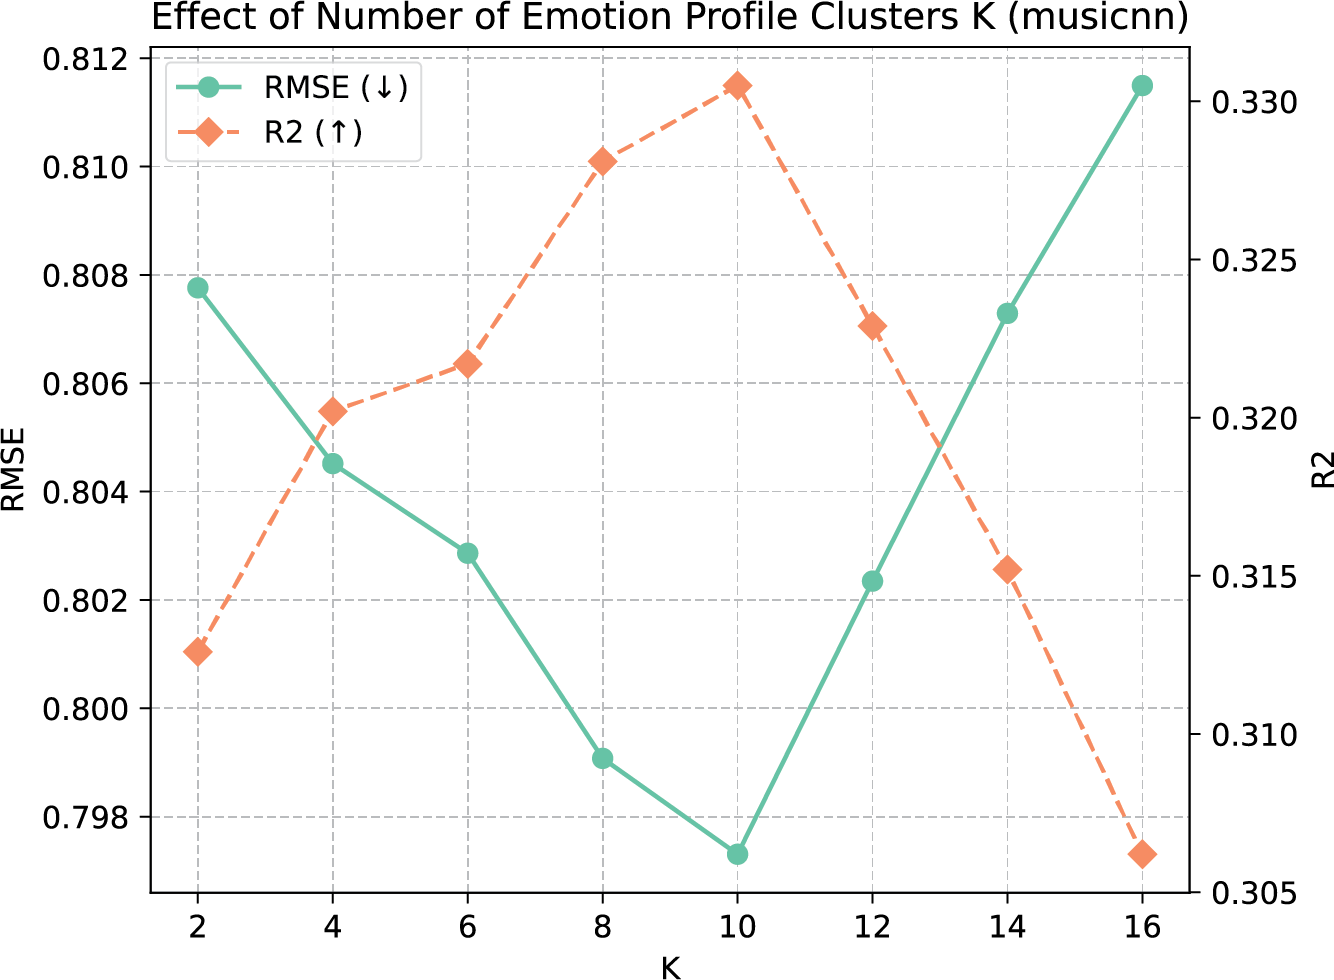
Figure 4
Performance impact of different number of emotion profile clusters .
5.6 Data efficacy study
In this section, we assess the efficacy of our proposed SRGNN‑Emo framework under varying levels of training data availability, investigating its performance in semi‑supervised settings where labeled data are sparse. Figure 5 illustrates the model performances using different ratios of the training data, comparing the SRGNN‑Emo framework with baseline models, including the baseline MLP and the semi‑supervised graph‑based approach DGI.
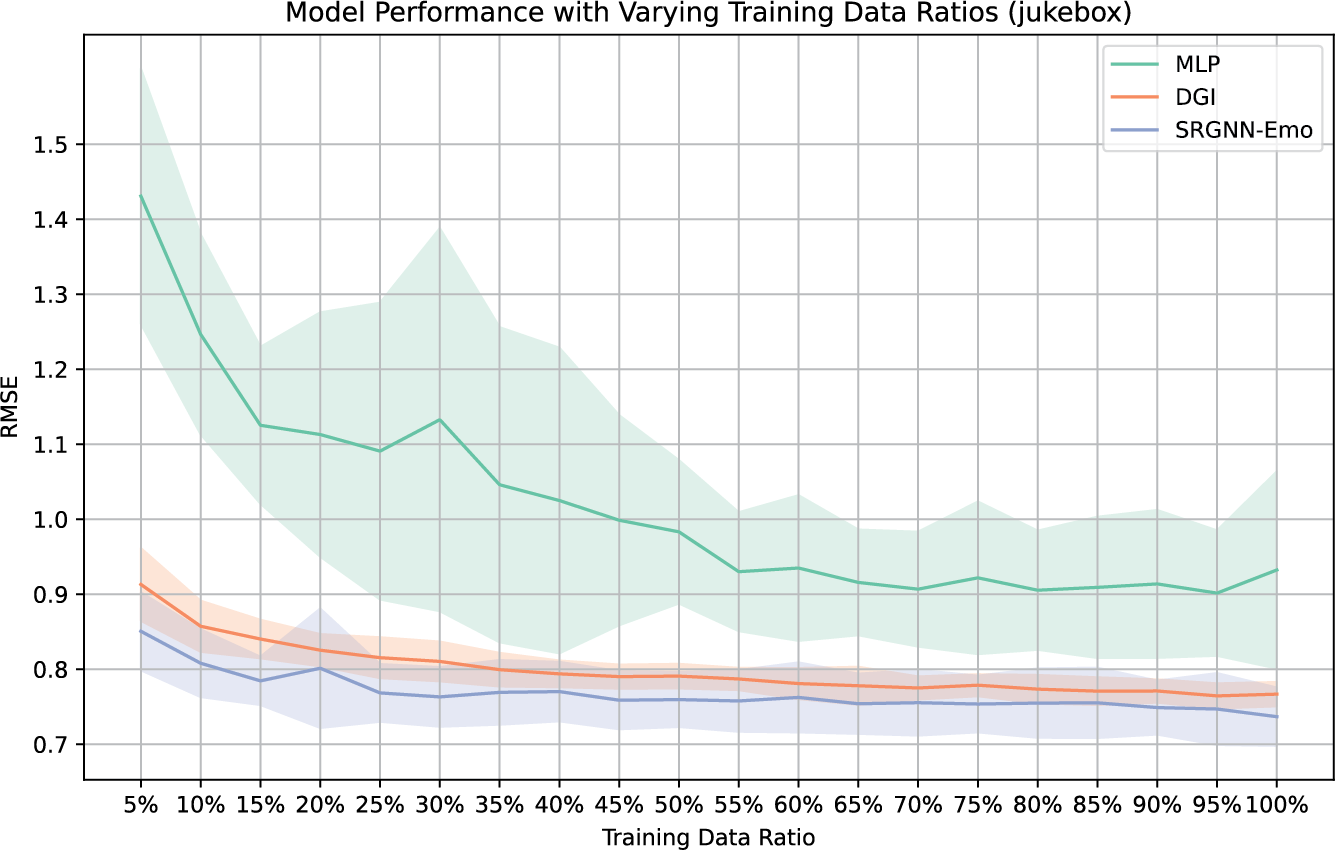
Figure 5
Model performances on different fractions of training data using Jukebox representations.
The results show that, as the amount of available labeled data increases, the performance of the MLP model significantly improves, exhibiting lower RMSE and higher values. This highlights its heavy reliance on large amounts of labeled data for generalization. In contrast, the semi‑supervised models demonstrate superior performance even with minimal labeled data. Specifically, our SRGNN‑Emo model maintains competitive RMSE scores and high values across various fractions of the training data, showing only a gradual decline in prediction accuracy as the training set size reduces. This indicates the model's robustness in scenarios with limited labeled data.
6 Conclusion
This work introduced SRGNN‑Emo, a novel semi‑supervised multi‑relational GNN designed for nuanced MER trained on EMMA, a database with exceptionally rigorous annotations based on the domain‑specific GEMS emotion model. By integrating semi‑supervised learning with multi‑relational graph structures and leveraging rich user interaction data, SRGNN‑Emo effectively outperformed baseline models in capturing the complex emotional responses evoked by music. While our study leverages the GEMS model to capture a wide range of music‑evoked emotions, our framework remains inherently flexible and can be adapted to alternative emotion models as future work. As a contribution, we enriched the existing Music4All‑Onion dataset (Moscati et al., 2022) by adding emotion labels generated from our trained model, resulting in a fully labeled large‑scale emotion‑based dataset with 109,269 tracks. This enhanced dataset enables various applications, such as improved music retrieval, enhanced recommendation systems, and other related tasks.
Data Accessibility Statement
Our source code is available at https://github.com/dbis-uibk/SRGNN-Emo. The dataset can be accessed under https://zenodo.org/records/15394646.
Funding Information
This research was funded in whole, or in part, by the Austrian Science Fund (FWF) [10.55776/P33526]. For open‑access purposes, the authors have applied a CC‑BY public copyright license to any author‑accepted manuscript version arising from this submission.
Competing Interests
The authors have no competing interests to declare.
Author Contributions
Andreas Peintner was the main contributor to the conceptualization of the study, development of the methodology, and provision of key resources. Marta Moscati contributed to data curation, investigation, and methodological design. Yu Kinoshita and Richard Vogl assisted with the investigation, methodology, and validation. Hannah Strauss supported data curation, provided resources, and created visualizations. Peter Knees, Markus Schedl, and Marcel Zentner contributed resources and assisted in reviewing and editing the manuscript. Eva Zangerle supervised the project and contributed to writing and reviewing the article. All authors actively participated in the study design and approved the final version of the manuscript.
Notes
[4] For MAEST, embeddings were extracted from transformer block 7 of the model, initialized with PaSST weights, and pre‑trained on the Discogs20 dataset. For Jukebox, embeddings were extracted from layer 36, with mean pooling applied across the layer's output, following the methodology detailed in the original work.
[5] This extended version of the dataset, including audio embeddings extracted from the described pre‑trained models (musicnn, MAEST, and Jukebox), is made publicly available on https://zenodo.org/records/15394646.