
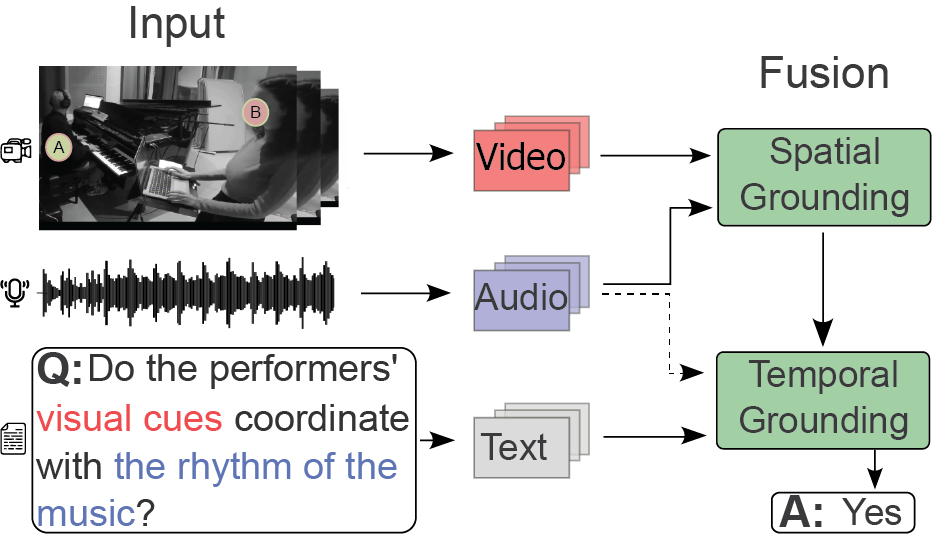
Figure 1
Overview of the music question–answering system. Features from input data (video, audio, and text) are processed and spatiotemporally mapped (grounded) through the AVST/LAVISH model to generate an answer (A).
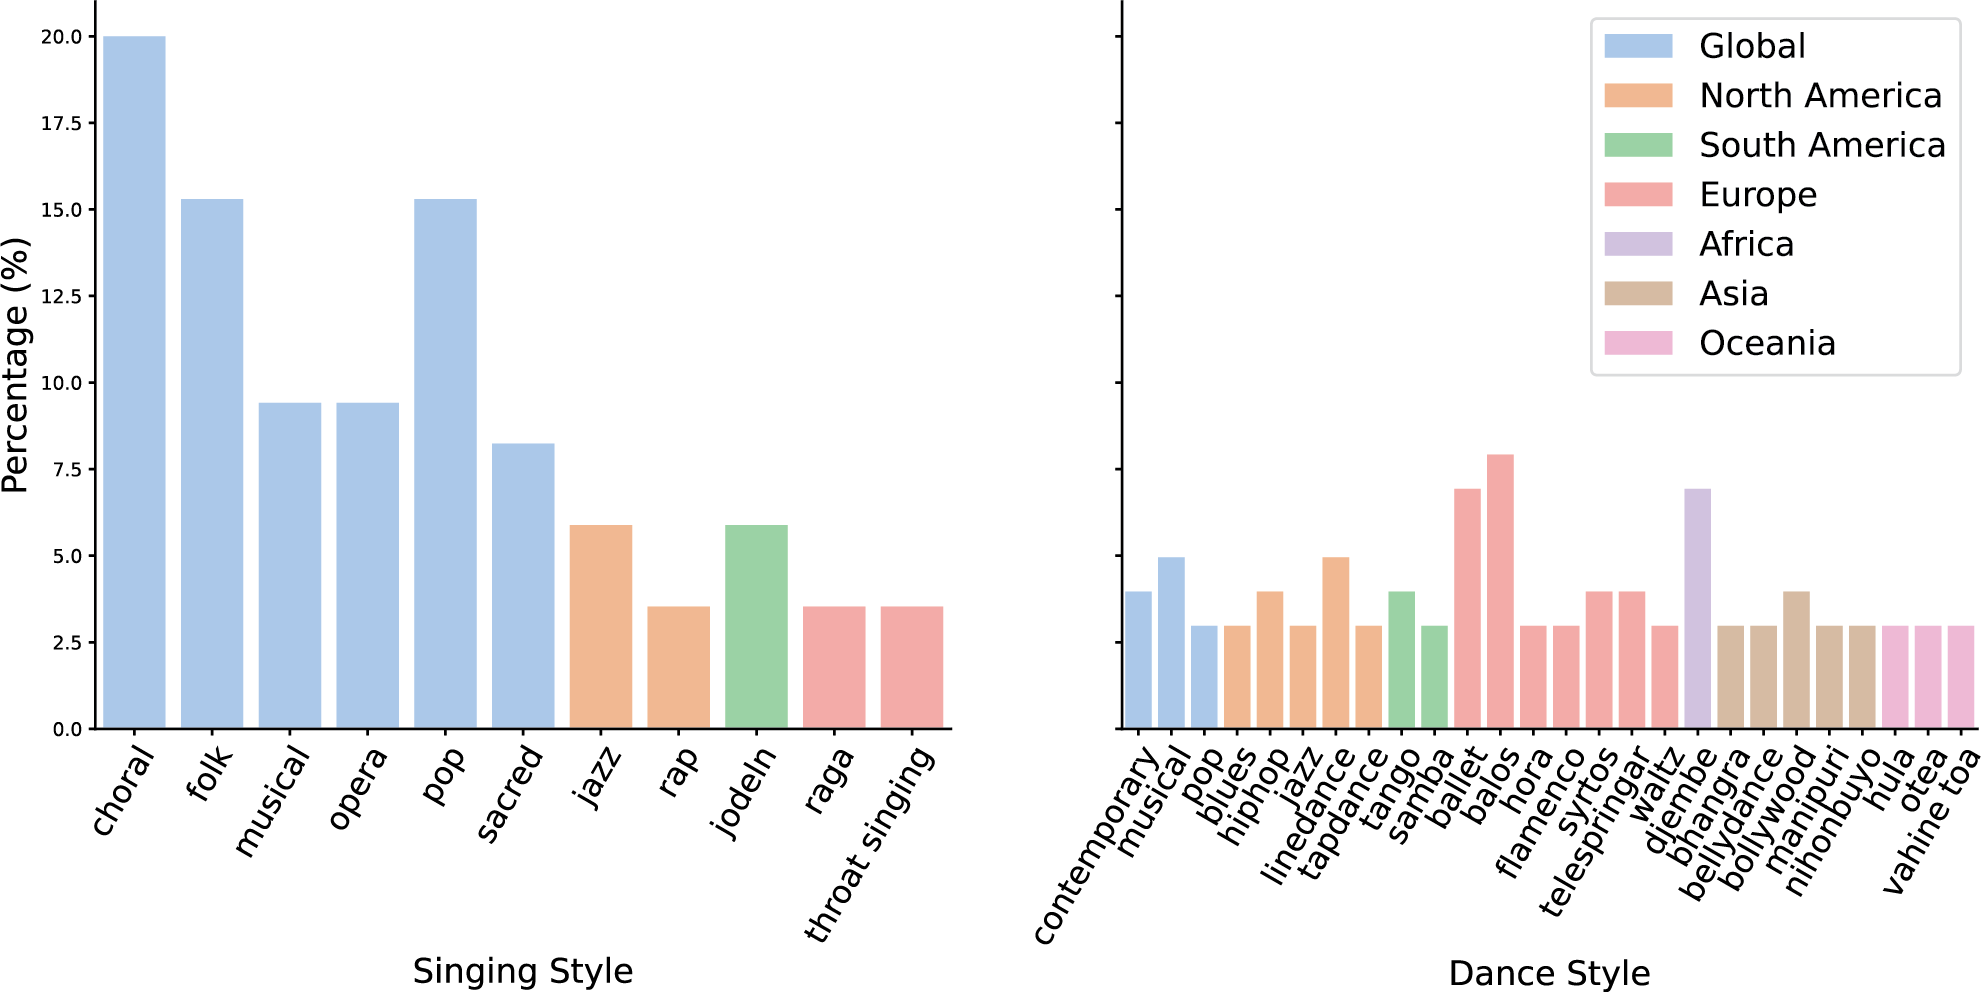
Figure 2
Distribution of singing (left) and dance (right) styles by geographic origin. Styles are listed on the x‑axes, with y‑axes showing their corresponding linear percentage (%). Bar colors denote geographic origin (see legend). The presented style taxonomies and regional annotations were curated by the authors for this study.
Table 1
The instrumental categories in MusiQAl.
| Strings | Winds | Percussion | Keyboards | Other | |||
|---|---|---|---|---|---|---|---|
| Banjo | Bass | Bassoon | Clarinet | Bell | Castanets | Accordion | Computer |
| Cello | Double Bass | Euphonium | Flute | Djembe | Drum | Piano | Steps |
| Cretan Lyra | Fiddle | Horn | Pipe | Drums | Dundun | Synthesizer | Voice |
| Guitar | Harp | Saxophone | Trombone | Glockenspiel | Kenong | Clap | |
| Koto | Laouto | Trumpet | Tsabouna | Kenong | Saron | ||
| Outi | Qanun | Uilleann Pipe | Whistle | Shaker | Tabla | ||
| Sitar | Violin | Taiko | Tambourine | ||||
| Tympani | |||||||
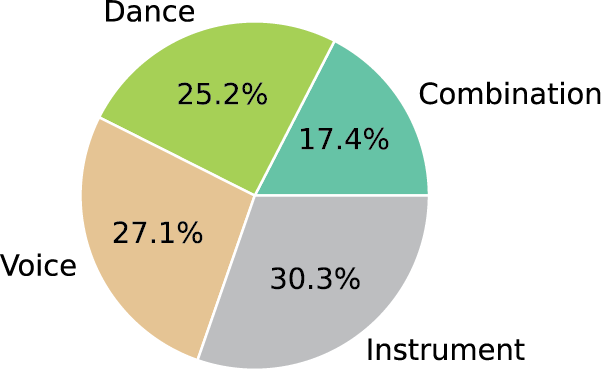
Figure 3
Data distribution by performance type in MusiQAl.
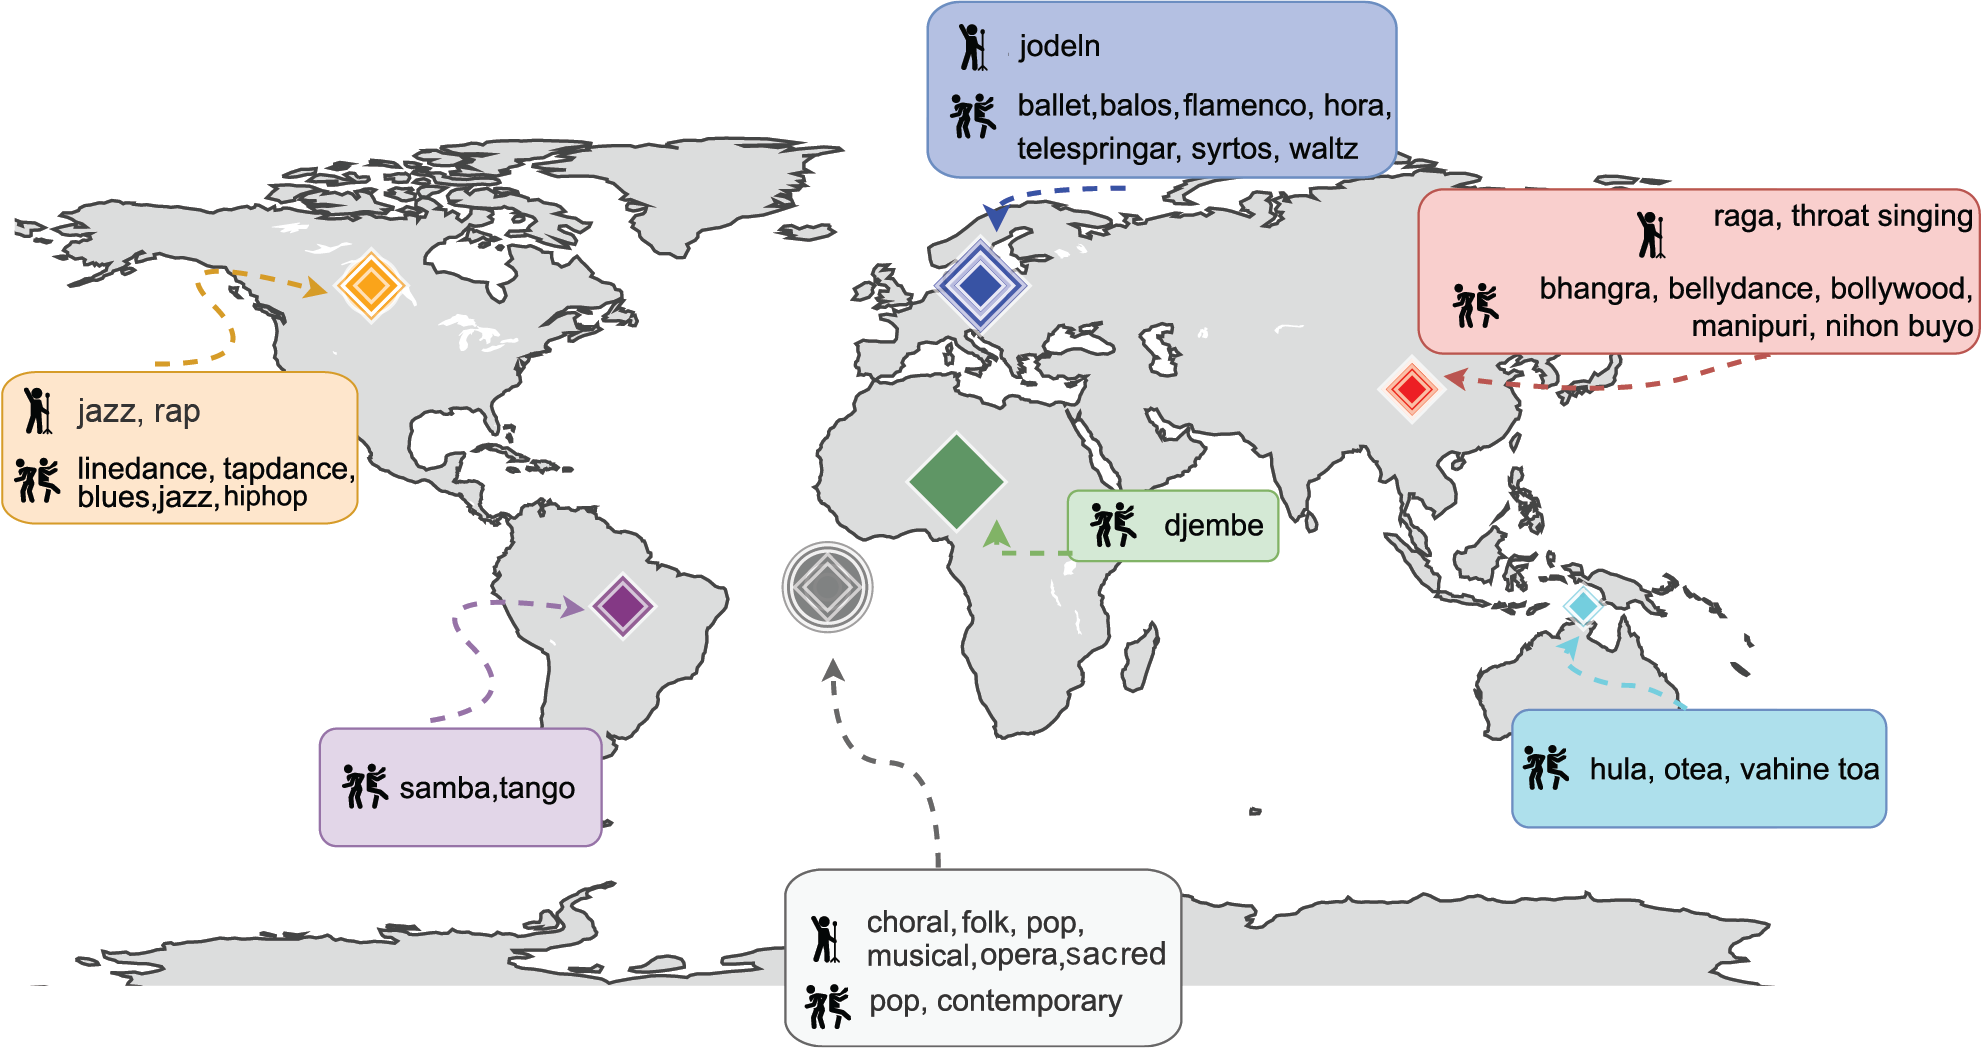
Figure 4
Overview of singing styles and dance types in MusiQAl, along with their countries of origin. The symbol in the center of the map denotes global data.
Table 2
Overview of the question categories present in four former music question–answering datasets compared to MusiQAl.
| Dataset | # Questions | A Questions | V Questions | AV Question | ||||||
|---|---|---|---|---|---|---|---|---|---|---|
| Existential | Location | Counting | Comparing | Temporal | Causal | Purpose | ||||
| MusicQA (Liu et al., 2024a) | 112K | ✓ | ✗ | ✗ | ✗ | ✗ | ✗ | ✗ | ✗ | ✗ |
| MuChoMusic (Weck et al., 2024) | 1.1 K | ✓ | ✗ | ✗ | ✗ | ✗ | ✗ | ✗ | ✗ | ✗ |
| MUSIC‑AVQA (Li et al., 2022) | 45K | ✓ | ✓ | ✓ | ✓ | ✓ | ✓ | ✓ | ✗ | ✗ |
| MUSIC‑AVQA‑v2.0 (Liu et al., 2024b) | 53K | ✓ | ✓ | ✓ | ✓ | ✓ | ✓ | ✓ | ✗ | ✗ |
| MusiQAl | 12K | ✓ | ✓ | ✓ | ✓ | ✓ | ✓ | ✓ | ✓ | ✓ |
[i] The questions can be based on audio (A), video (V), or both audio and video (AV).
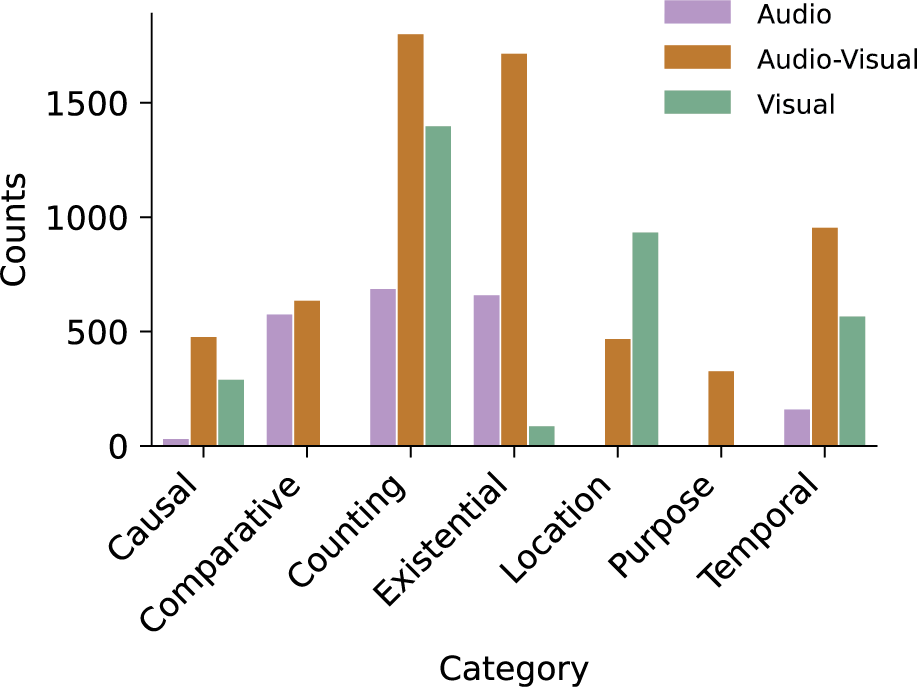
Figure 5
Distribution of question categories in different scenarios. The count of questions (y‑axis) per category (x‑axis) for each modality (audio–video, audio‑only, and video‑only).
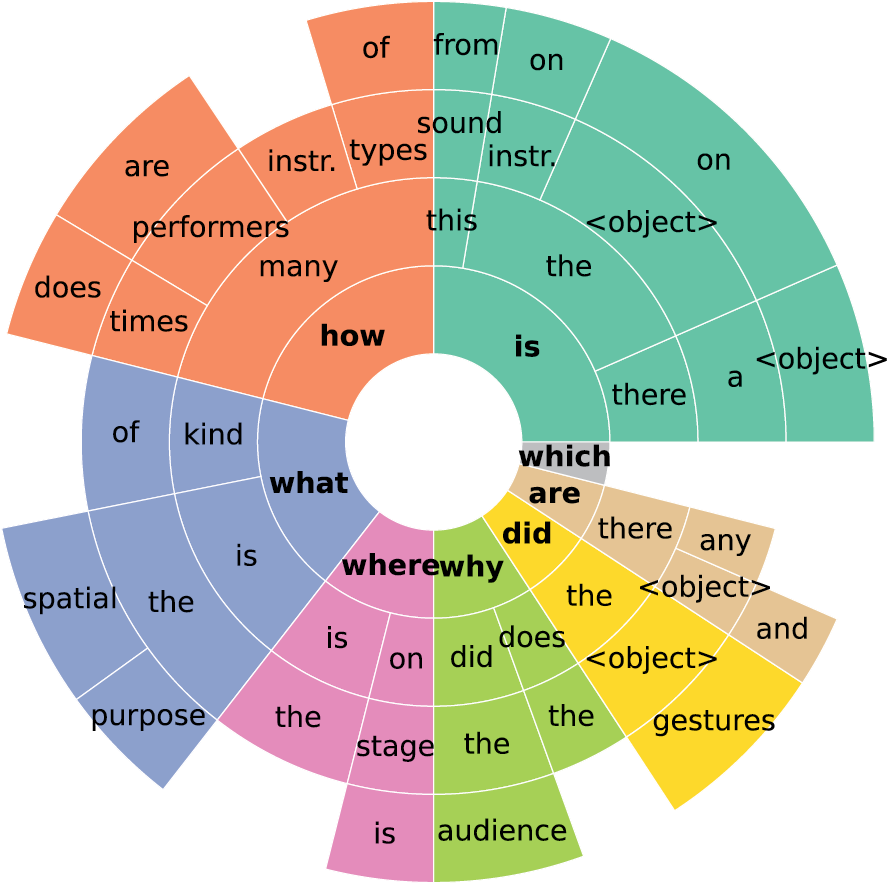
Figure 6
N‑gram analysis of question formulation. This plot shows the frequency of common word sequences (up to four words) at the beginning of questions, revealing dominant patterns in question formulation.
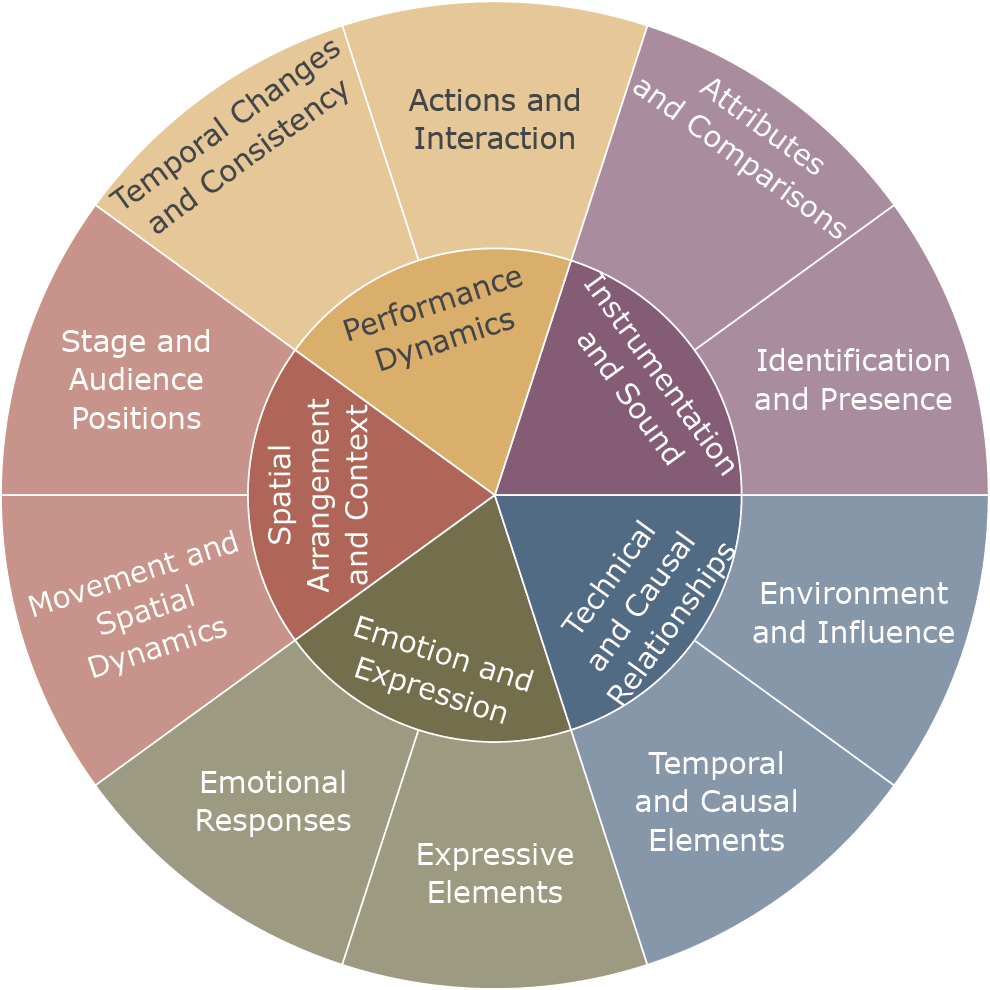
Figure 7
Question taxonomy. This visual representation highlights the hierarchical structure and interconnections between different questions.
Table 3
Performance comparison of the AVST and LAVISH models on the MusiQAl dataset.
| Model | Audio (A) | |||||||
|---|---|---|---|---|---|---|---|---|
| Existential | Location | Counting | Comparative | Temporal | Causal | Purpose | Avg | |
| AVST () | 76.11 | N/A | 69.79 | 72.65 | 76.37 | 80.00 | N/A | 72.32 |
| (std) | 1.82 | ‑ | 2.32 | 1.00 | 3.29 | 0.00 | ‑ | 1.02 |
| LAVISH () | 55.00 | N/A | 77.46 | 68.77 | 52.90 | 76.00 | N/A | 66.03 |
| (std) | 2.38 | ‑ | 1.01 | 1.47 | 4.33 | 8.94 | ‑ | 2.03 |
| Model | Video (V) | |||||||
|---|---|---|---|---|---|---|---|---|
| Existential | Location | Counting | Comparative | Temporal | Causal | Purpose | Avg | |
| AVST () | 94.55 | 69.08 | 68.75 | N/A | 73.41 | 63.51 | N/A | 69.48 |
| (std) | 4.98 | 1.55 | 1.71 | ‑ | 2.06 | 2.30 | ‑ | 0.87 |
| LAVISH () | 77.74 | 61.45 | 74.91 | N/A | 69.63 | 60.00 | N/A | 69.60 |
| (std) | 3.50 | 0.69 | 1.69 | ‑ | 4.65 | 3.12 | ‑ | 1.41 |
| Model | Audio–Video (AV) | ||||||||
|---|---|---|---|---|---|---|---|---|---|
| Existential | Location | Counting | Comparative | Temporal | Causal | Purpose | Avg | AvgAll | |
| AVST () | 61.19 | 66.10 | 69.05 | 73.68 | 70.55 | 64.40 | 65.97 | 66.23 | 68.21 |
| (std) | 0.88 | 1.11 | 1.21 | 3.44 | 1.40 | 2.44 | 1.40 | 1.14 | 0.95 |
| LAVISH () | 80.80 | 63.83 | 64.42 | 82.37 | 50.00 | 76.99 | 73.23 | 70.08 | 69.78 |
| (std) | 0.38 | 1.51 | 0.55 | 0.71 | 1.40 | 1.63 | 1.38 | 0.27 | 0.48 |
[i] The results are detailed in three tables, corresponding to audio‑only (A), video‑only (V), and combined audio‑video (AV) question categories. All values represent answer prediction accuracy in percentage (%). For each model and category, the mean accuracy () over five independent runs is reported. The ‘(std)’ row presents the standard deviation, quantifying the performance variability across these runs. Both models were trained on human‑annotated question–answer pairs. Higher scores, indicating superior performance for a given category between the two models, are highlighted (in bold). ‘Avg’ refers to the average accuracy across all question categories within a specific modality (A, V, or AV), while ‘AvgAll’ represents the overall average across all three modalities.
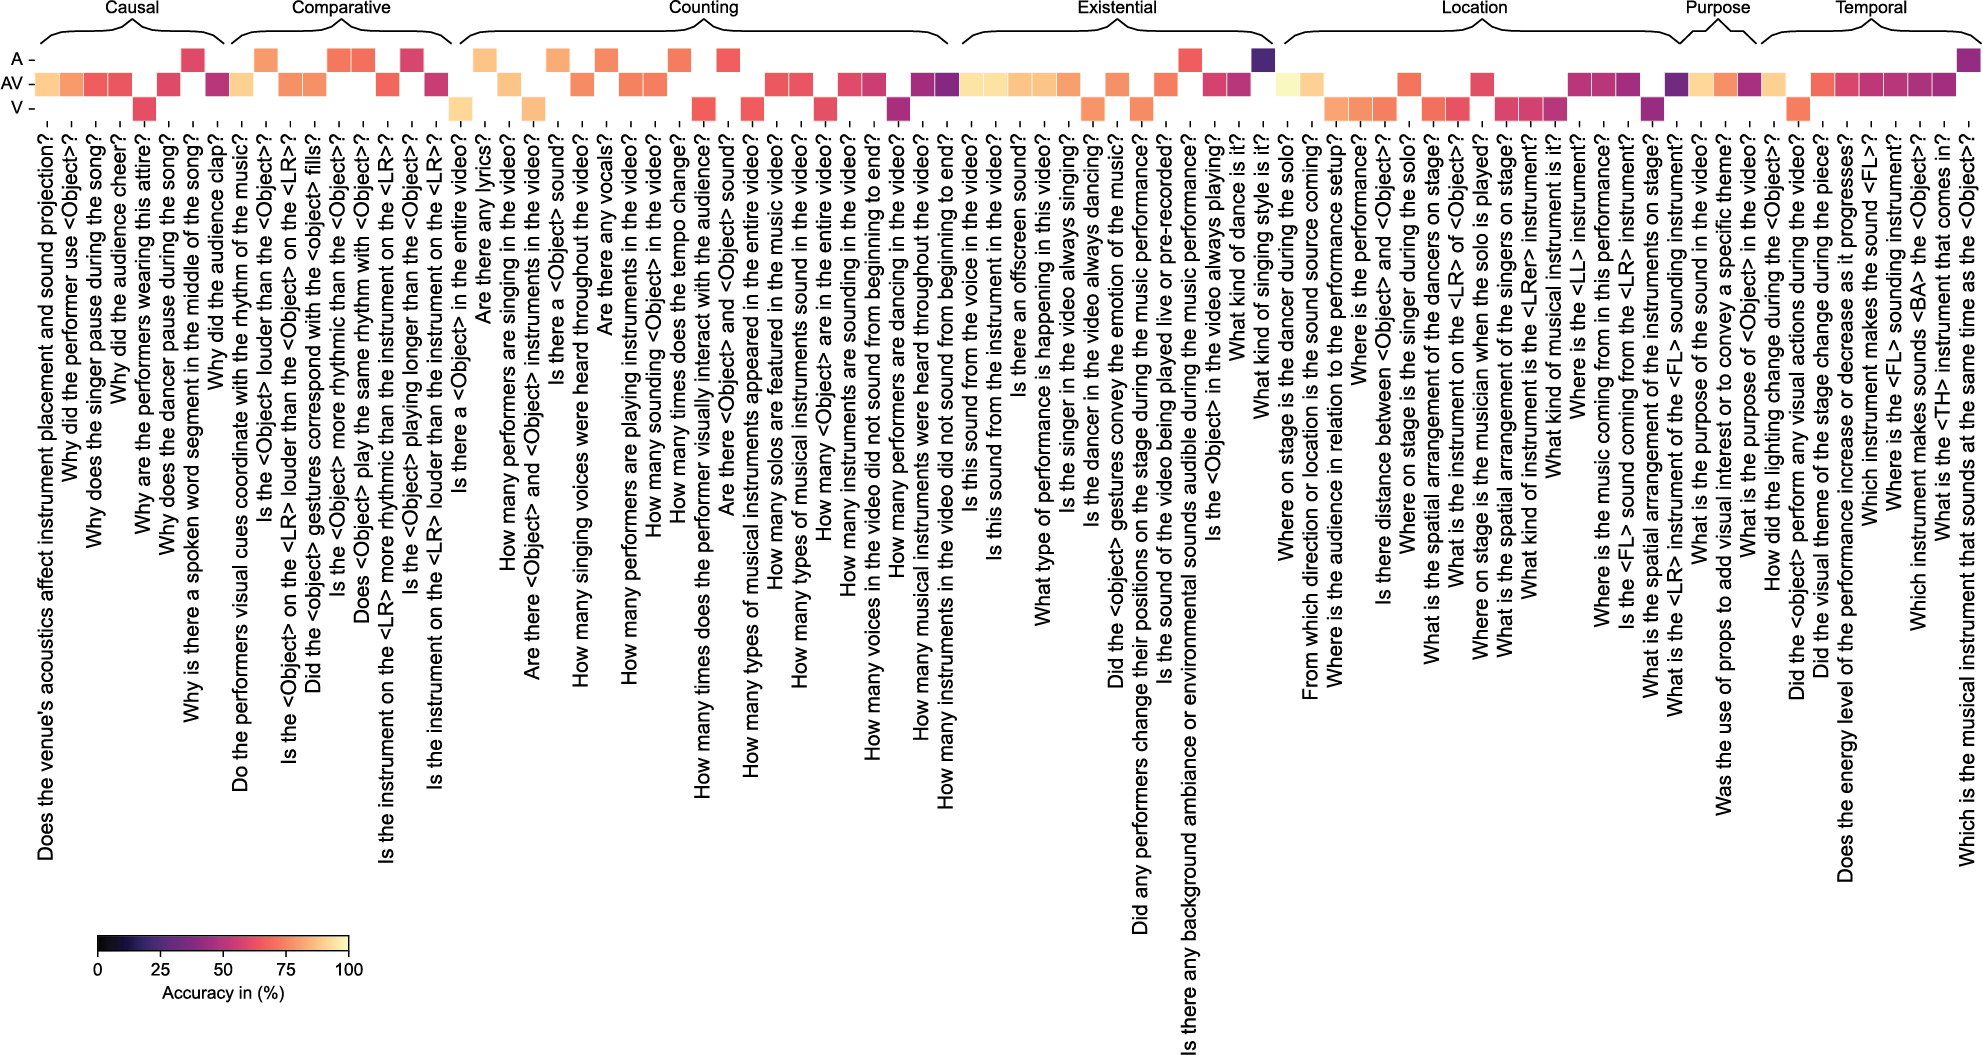
Figure 8
Accuracy of different questions based on modality (audio (A), audio–video (AV), or video (V)) and category (Causal, Comparative, Counting, Existential, Location, Purpose, Temporal).