
1 Introduction
Manual gesturing by singers is an integral part of vocal music performances in the Indian classical traditions. The range of functions of singing‑accompanying gesture overlaps with those identified in speech‑accompanying gesture, although it has some distinctive aspects (Clayton, 2005). Indian singers’ gestures have several distinct referents: for example, they may relate to the rhythmic structure of the music (marking a steady beat or tala cycle) or play a role in signalling to co‑performers or audience members, as well as appearing to accompany or illustrate aspects of the melody being sung. In the latter case, hand movements sometimes appear to correspond to pitch height (i.e. ascending pitch co‑occurs with one or both hands rising and/or moving to one side). At other times, they relate to other aspects of melody, such as the tension felt while sustaining certain notes, or the image or abstract design visualised by the performer (Clayton, 2007; Leante, 2009, 2013, 2018; Rahaim, 2012). Gesturing is an aspect of performance often remarked on by audiences that may play an important role in communicating the structure and affect of the music; it also seems to play an important role in teaching, even if ‘how to gesture’ is rarely taught explicitly (the use of gesture in teaching is explored in the Karnatak tradition by Pearson (2013); Karnatak or South Indian singing is related to but distinct from the Hindustani or North Indian tradition considered by most of these authors). There is much still to be explored in the relationship between movement and audio features of Indian singers, which can reveal much about the music’s underlying principles and the cognitive processes involved.
Computational studies on gesture‑to‑audio correspondence in vocal performances of Indian art music have recently come to the fore. Paschalidou (2022) carried out research on a motion capture dataset of solo alap recordings in the dhrupad genre, looking at a range of movement and audio features in relation to the concept of ‘effort’: although she found correspondences, generalising across performers proved challenging. The relationship between acoustics and gesture kinematics was studied in recent work by Pearson and Pouw (2022) using inertial‑motion‑capture‑based tracking of the wrists in 35 performances by four Karnatak vocalists. They manually segmented gesture tracks and studied the correspondence of various kinematic extrema with temporally aligned changes in the acoustics [fundamental frequency (F0) and amplitude envelope]. They found that sudden changes (more in F0 rather than in amplitude) tended to occur around peaks in wrist speed and acceleration. A correspondence was established between the magnitudes of local peaks in acceleration and changes in F0, in line with previous work in co‑speech gesturing by Jenkins and Pouw (2023). They also report a consistent temporal lag/lead in the F0 change instant with reference to positive/negative peaks in acceleration. Although every singer was somewhat internally consistent, there was considerable variability in the gesture–vocal coupling across singers. They discuss the implications of the nature of the coupling, attributing it to both physiological and aesthetic influences. The prominence of F0 in the acoustic–kinematic relation is consistent with the fact that the melody, or variation of the singing pitch, dominates the sonic experience of a music listener.
In a shift towards linking gesture to high‑level musical characteristics such as raga identity, Clayton et al. (2024) explored the use of movement data to classify 12‑second (s) excerpts drawn from a corpus comprising three singers’ performances of alaps (3‑minute solo presentations) and pakads (briefer summaries of key melodic phrases) of nine common Hindustani ragas in the khyal genre. (The use of solo alaps meant the gestures could not refer to either metric structure or interaction with co‑performers, and thus relate predominantly to the melody of the ragas being presented.) Singer and raga classification tasks were attempted using movement data extracted using both two‑dimensional (2D) and three‑dimensional (3D) pose estimation from a single camera view. Singer classification was successful, and raga classification achieved better than chance results, but also confirmed a high degree of dependence on the singer (i.e. singer idiosyncrasy), something which had previously been noted in qualitative studies. Clayton et al. (2022) explored the same dataset, bringing in both audio and video modalities to the solution for the first time (the research was in fact carried out later). An inception block preceded by independently trained convolution layers for audio (represented by the normalised F0 contour) and gesture (represented by the raw 2D position coordinates of each of the wrists) time series classification provided the best performance in the context of singer‑dependent raga classification, especially reducing the confusion between melodically similar ragas with respect to the otherwise high‑performing audio‑only classification.
The work presented here seeks to build on qualitative and ethnographic research describing and interpreting Indian singers’ manual gestures. In other words, we go beyond the tasks of raga and singer identification to explore manual gesture in relation to musically meaningful performance segments. From the audience’s perspective, gestures appear to ‘match’ the singing they accompany, and often appear to relate in interpretable ways: for example, a singer may move her hands skywards to accompany a quickly ascending melody, move faster or slower along with the perceived speed of melodic movement – even holding still on sustained notes – or somehow express the varying degrees of tension, effort or excitement inherent in the music. To what extent can these observations be backed up by empirical analysis? If they are robust, then in principle we should be able to identify and classify melodic events from gestural information. However, we also know that gestures are observed to be idiosyncratic, with singers of the same stylistic tradition – even those belonging to the same family – gesturing in quite distinctive ways. Since gesturing is not explicitly taught, it is also plausible that each singer’s mapping between sound and gesture may be distinctive, in which case such classification would only work well when trained on data from the singer in question. Discovering which aspects of gesturing show consistency across singers and which do not would be of great benefit in understanding singing‑accompanying gesture.
We therefore aim to explore the complementarity of melody and gesture in the context of specific, musically meaningful cases at the finer time scales of the raga melody building blocks. In particular, we explore the use of gesture information to classify short excerpts of the alap performances that have been identified from the audio material as representing either (a) stable notes or (b) particular melodic phrases typical of the ragas in the dataset. These are not the only possible candidates: we could have looked, for example, at specific ornamentations or distinctive vocal techniques such as gamak (shaking, oscillating). For this first investigation we chose to look at stable notes because this is both a simple feature, easy to define and search in the audio, and also musically significant (for example, which notes can be held is an important feature of a raga). For the second task, we move on to look at some specific melodic phrases, choosing some which are typical of ragas in our dataset since they are likely to be repeated numerous times. Raga grammar requires the characteristic phrases to represent the raga unambiguously, leading to their relatively unchanging form across singers and performances (Ganguli and Rao, 2021). It is also possible that phrases regarded as typical of the raga will be treated with particular attention in the performance, and that singers may have developed distinctive ways of performing them which also reflect the perceived mood or character of the raga. This is explored by Leante (2009) in the case of r/P in Shree, which is one of the examples chosen for this study. Apart from r/P, the selection is arbitrary. Four motifs are sufficient for an exploratory analysis, and the choice is based on the following factors: r/P is referenced in the literature as being particularly clear and distinctive; gMD and P\R are clear examples of ascending and descending phrases, respectively; and nDN is an example of a phrase common to two ragas.
The main objective of the research, then, is to discover whether segments of a raga performance can be categorised as (a) stable notes or (b) examples of a specific phrase, and to what extent this categorisation depends on the system having been trained on the particular singer. Our hypothesis is that in each case there is enough consistency, even across singers, for prediction to score above chance, but that stable note detection will be easier than motif recognition and that some motifs will be more distinctive than others; furthermore, we expect unseen‑singer performance to be significantly poorer than seen‑singer ones, reflecting singer idiosyncrasy.
We work with a considerably enlarged corpus with eight additional performers, collected following a similar methodology, to allow a wider exploration of variation of gestures between singers. Nadkarni et al. (2023) studied this expanded corpus of solo alap recordings to investigate correspondences between singers’ movements (captured in the time series for the x‑ and y‑coordinates of their wrist positions) and the melodies they sing (represented as F0 contours). Since the same set of nine ragas is performed by all 11 singers, they could explore commonalities in the gestures used by different singers for particular raga‑specific melodic movements. Selected raga motifs were segmented automatically from the audio recordings by searching using manually identified templates from the pakads. That is, in contrast to the body of previous work, they used musically motivated units, implied by the raga melodic structure, to group the representations of melody and gesture.
In the present paper, we further explore these tasks with the audiovisual alap data of Nadkarni et al. (2023). New contributions reported for the first time in this work are as follows: (i) We enhance the audiovisual pipeline to process all the three available camera views to obtain a reliable depth dimension coordinate. (ii) We explore the use of position coordinates in addition to velocity and acceleration, and the addition of elbow joints to wrists, testing the relative success of classification using different subsets of the resulting movement data. (iii) We strengthen the links to previous work on the sonic–kinematic link in Pearson and Pouw (2022) by carrying out similar correlation analyses of the synchronised audio and visual time‑series. (iv) We introduce singer‑dependent classification that demonstrates a significant increase in the computed sonic–gesture correspondence. (v) We introduce a new motif to the three used for the previous work, to illustrate the behaviour of similar melodic sequences in two distinct ragas in terms of potential gestural distinctions.
2 Dataset and Processing
Our work is based around the publicly available audiovisual dataset of North Indian vocal alap performances by 11 professional musicians. Each singer performs two alaps of each of nine ragas, accompanied only by the tanpura (drone). The ragas and their tonal material are listed in Table 1. The ragas were selected to cover a wide range in terms of not only tonal material but also mood, speed of presentation, favoured melodic range (upper versus lower tetrachord) and type of melodic motion (i.e. direct versus wandering).
Table 1
Details of the nine ragas which are present in our dataset. The 12 notes in the octave (separated by 1 semitone = 100 cents) are denoted by S r R g G m M P d D n N.
| Raga | Tone material |
|---|---|
| Bageshree (Bag) | S R g m P D n |
| Bahar | S R g m P D n N |
| Bilaskhani Todi (Bilas) | S r g m P d n |
| Jaunpuri (Jaun) | S R g m P d n |
| Kedar | S R G m M P D N |
| Marwa | S r G M D N |
| Miyan ki Malhar (MM) | S R g m P D n N |
| Nand | S R G m M P D N |
| Shree | S r G M P d N |
Each alap is about 3 minutes long. The singers also contributed shorter ‘pakad’ recordings, rendering some of the key phrases of each raga in a brief format of a few seconds. The total duration of this dataset is about 11 hours. Each raga comprises 22 alaps and 12 pakads (one extra pakad) as sung across the 11 singers of whom five are male (AK, CC, MG, MP and NM) and six female (AG, AP, RV, SCh, SM and SS). While each alap is labelled only by singer and raga, we carry out further manual annotation of the pakad audio files for selected raga phrases as used in this study. That is, all the pakads of a given raga across the 11 singers are searched for instances of the desired phrase (e.g. gmD in raga Bageshree).
Each performed piece was recorded using three synchronised video cameras (placed front, left and right, respectively) and a separate high‑quality microphone. Figure 1 presents the salient aspects of the processing pipeline with its two stages in parallel for the audio and video components of the audiovisual recording, leading eventually to the synchronised acoustic and kinematic time series. The complete details of the recordings and processing algorithms are available in the repository.1

Figure 1
Overall pipeline for preprocessing to get the audiovisual time series. The green path indicates audio processing, the blue path indicates video processing and the red path indicates their combination.
Of interest to us are the melodic features extracted from the audio, namely the singer F0 contour, and the kinematic parameters from video pose estimation given by position, velocity and acceleration of the wrist and elbow joints in 3D. We use the master files, already provided in the repository, corresponding to the 3D coordinates from VideoPose3D for this study. The master file has synchronised F0 and gesture information at 10 ms intervals – the gesture information includes position (in normalised coordinates) as well as computed velocity and acceleration, all for 3D (), for each of the two wrists and elbows. The F0 contour is provided in cents after singer–tonic‑based normalisation. Further, silent and unvoiced intervals of less than 400 ms have been linearly interpolated. The resulting continuous F0 segments (separated by intervals greater than 400 ms) are termed silence‑delimited segments (SDS) in the rest of this work. Figure 2 presents an example of a 10 s excerpt with the time‑aligned contours of F0, position (x,y,z) and the absolute magnitudes of velocity and acceleration.

Figure 2
An excerpt from an alap recording of raga Shree performed by the singer AG showing the extracted F0 and right wrist gesture contours. We note a silence (at about 82 s) separating two singing segments.
3 Relating F0 with Kinematic Changes
As reviewed in Section 1, Pearson and Pouw (2022) report a correspondence between peaks in the temporal trajectories of the kinematic (speed and acceleration) and acoustic (F0) parameters for wrist movements obtained by motion capture from four Karnatak vocalists in performance. We attempt to replicate their study for our Hindustani alaps across the 11 singers in our dataset using wrist keypoints obtained via our pose estimation directly from video. We employ a different set of analytical techniques to the same end, and also compute correlations across entire trajectories, unlike Pearson and Pouw (2022), who manually eliminated the preparatory and retraction phases of the movements to isolate gesture events.
Temporal changes in F0 are captured by the trajectory of obtained by the differentiation of F0 and implemented via a 31‑point biphasic filter (that is, otherwise similar to the one used in the data repository for the gesture time series). The larger filter bandwidth (compared with that used for the kinematic parameters) accounts for the fact that F0 fluctuations are more rapid than kinematic fluctuations. In the experiments reported here, we consider the following kinematic parameters, also studied by Pearson and Pouw (2022): vertical velocity (Vy), speed (S) and acceleration (A) for each of the two wrists.
Local maxima are detected in the kinematic contour, and those above a threshold equal to the contour mean value are retained with a minimum separation of 0.5 s between the retained peaks. For each such kinematic peak location in time, the contour is searched for the highest local maximum in a neighbourhood of +/− 0.5 s. The magnitude and location of the peak are stored (with zero assigned to magnitude if a peak is not found in the mentioned temporal neighbourhood). Figure 3 illustrates this process via an example of wrist acceleration and the time‑synchronised trajectory. The magnitude and temporal coupling are determined across the alap through the Pearson correlation coefficient involving the magnitude and time‑lag parameters, respectively, for each identified pair of kinematic and peaks. In Table 2, we present the magnitude coupling results for each singer and kinematic variable. We observe variations across singers in terms of the magnitude coupling strengths across the different kinematic parameters. In most cases, the coupling strength is highest for acceleration, especially of the right wrist. Thus, our results appear consistent with Pearson and Pouw (2022) in that the kinematic feature that is most strongly coupled with vocal F0 is indeed the acceleration, an observation that is explained by the direct correspondence with biomechanical force. We did not observe any significant temporal coupling with a more or less uniform spread of time lag/lead of the peak with respect to the kinematic peak as demonstrated by the plots provided in the supplementary material. Accordingly, we assume temporal synchrony in the remainder of our work on the correspondence between acoustic and kinematic events.
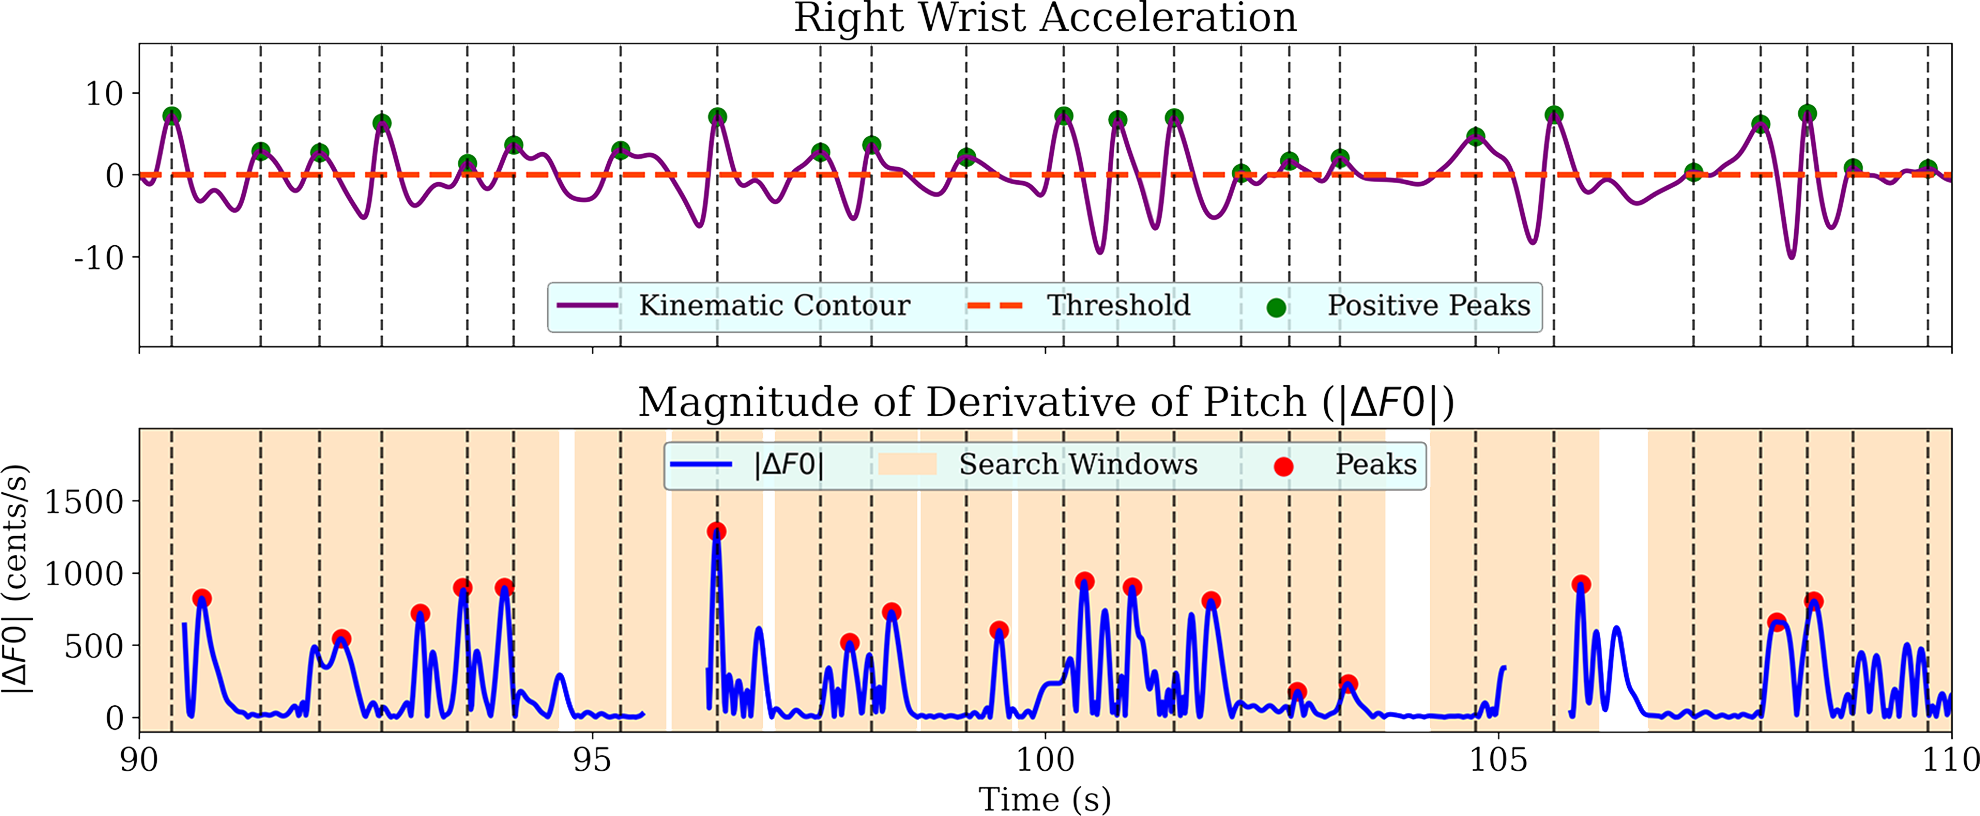
Figure 3
A sample segment from AG_alap1_Bag showing the processing of positive kinematic peaks for the gesture–vocal coupling study. From the gesture contour of right wrist acceleration (top), peaks above the threshold are captured. A window of duration 1 s is taken around the peak location, and the maximum of the contour (bottom) in that window is stored as the corresponding value for the data point in linear regression.
Table 2
Average correlation coefficient between the log of kinematic magnitude trajectory peaks (both positive and negative peaks included; for speed, this is peaks and valleys) and the corresponding peak magnitude of . The reported averages are across the alaps and pakads of each singer for the Vy, S and A of their left (L) and right (R) wrist (W). For the highest coefficient in each row (indicated in bold), p 0.001.
| Singer | RWVy | LWVy | RWS | LWS | RWA | LWA |
|---|---|---|---|---|---|---|
| AG | 0.32 | 0.20 | 0.27 | 0.17 | 0.40 | 0.22 |
| AK | 0.17 | 0.12 | 0.11 | 0.10 | 0.19 | 0.12 |
| AP | 0.06 | 0.15 | 0.02 | 0.12 | 0.09 | 0.12 |
| CC | 0.29 | 0.37 | 0.27 | 0.36 | 0.40 | 0.39 |
| MG | 0.02 | 0.05 | −0.01 | 0.02 | 0.10 | 0.07 |
| MP | 0.08 | 0.15 | 0.05 | 0.16 | 0.09 | 0.19 |
| NM | −0.01 | 0.14 | 0.03 | 0.08 | 0.19 | 0.09 |
| RV | 0.14 | 0.14 | 0.13 | 0.12 | 0.16 | 0.16 |
| SCh | 0.25 | 0.20 | 0.20 | 0.16 | 0.29 | 0.14 |
| SM | 0.08 | 0.16 | 0.03 | 0.09 | 0.12 | 0.18 |
| SS | 0.11 | 0.12 | 0.02 | 0.06 | 0.14 | 0.12 |
4 F0‑Based Segmentation and Labelling
The segmentation of our audiovisual alap, as represented by the set of extracted acoustic and kinematic time series, involves the F0‑contour‑based identification of melodic events such as notes and specific melodic movements. While the melody itself occupies a continuous pitch space with discrete notes approached through smooth trajectories, ragas are identified by their tonal material and melodic motifs. A meaningful approach to melodic segmentation is then to label the gestalts corresponding to steady notes and to raga motifs.
We start with the silence‑delimited segments (SDS) as derived in Section 2. Within each SDS, we extract stable note regions. We also obtain the temporal locations of raga‑specific motifs through comparison with the previously extracted F0 templates for each of the phrases. In this section, we present the details of the F0 contour segmentation.
4.1 Detecting stable note segments
A “stable note” is a part of the singing where the F0 value is (ideally) constant with respect to time. We aim to segment such regions from the F0 contour and thereby gain insights from the corresponding time‑aligned gestures. The continuous F0 contour that corresponds to an SDS is examined for occasions when the same note (svara) is sustained for more than 250 ms. This choice of the minimum duration is supported by previously reported subjective listening tests (Vidwans et al., 2012), where 250 ms was observed to be the minimum required duration in musicians’ annotation of a sung segment to be considered “khada svara” (standing or stable note) in raga performance recordings. Rather than rely on an equi‑tempered grid, we employ a finely binned pitch class distribution to identify svara (raga note) positions accurately (Ganguli and Rao, 2018). We define a stable note as a region where the F0 is located continuously within 50 cents (+/− 25 cents) of one of these identified positions.
The subsequent step is merging stable note regions pertaining to the same svara that are separated by a gap less than 100 ms. Non‑stable regions are defined as any piece of the F0 contour occurring in an SDS but not in the detected stable note region.
The steps involved in stable note segmentation, as illustrated by Figure 4, are summarised here:
The pitch class distribution (PCD) is computed for each alap to find the central pitches of the notes (svara) in the corresponding raga, through peaks in a finely binned histogram from the F0 contour.
Stable notes are found from the pitch contours according to the “rule”: each stable note should have its pitch contour lie entirely within cents of a PCD note location. The segmentation is carried out using an algorithm that iterates sample‑by‑sample over the pitch contour with start and end flags to define windows for which the “rule” needs to be checked.
Every continuous region belonging to an SDS but not within a stable note is labelled as a non‑stable segment. The pitch contour and gesture time series corresponding to each stable note segment, and each non‑stable segment is stored for feature extraction.
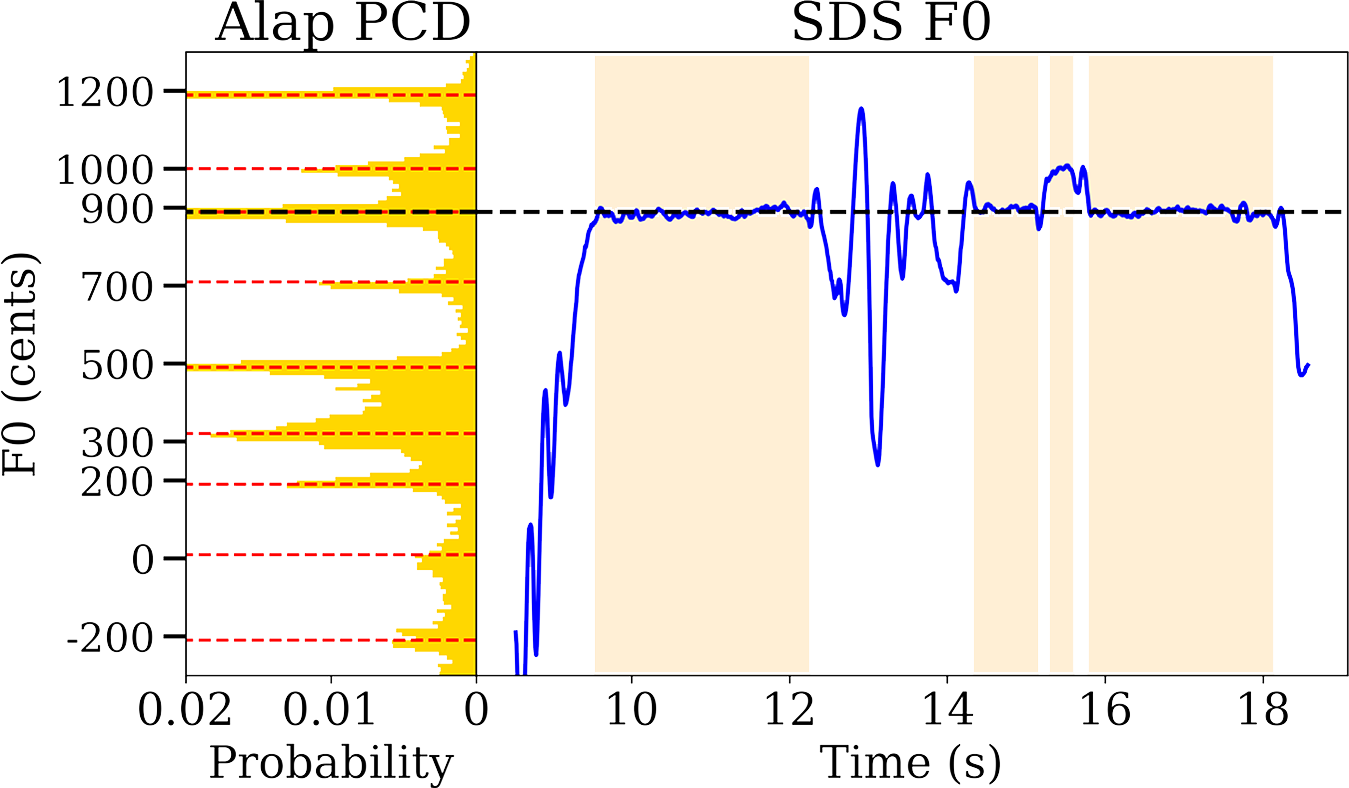
Figure 4
A silence‑delimited segment (SDS) with identified stable notes (shaded regions of blue F0 contour) and pitch class distribution (on the left) computed from the entire alap audio with detected svara locations highlighted.
The duration distributions for stable note and non‑stable segments in our dataset are shown in Figure 5. We have noticed that most of the stable notes are of short duration (less than 1 s long), while the non‑stable segment durations are more uniformly spread.

Figure 5
Distributions of duration for stable note (left) and non‑stable segments (right) in our dataset, shown up to a maximum duration of 5 s.
4.2 Template matching for phrase detection
As depicted in Table 3, the raga motifs selected for our exploration include a distinctive upward slide of an augmented fourth in Shree, a falling slide of a fourth in Nand, a three‑note ascending phrase in Bageshree, and a three‑note phrase with a falling and then rising contour, as occurs in the two ragas Miyan ki Malhar and Bahar. The expected constancy of the melodic shape within and across singers prompts the question of whether their gesture executions also bear some measurable similarity.
Table 3
The ragas and phrases used in the phrase detection experiment. The svaras S r R g G m M P d D n N correspond to the 12 notes of the Western chromatic scale, with S representing the tonic. The symbols / and \ denote the upward and downward slide, respectively (Rao and van der Meer, 2012; Kulkarni, 2017).
| Raga | Svara (Notes) | Phrase |
|---|---|---|
| Bageshree (Bag) | S R g m P D n | gmD |
| Shree | S r G M P d N | r/P |
| Nand | S R G m M P D N | P\R |
| Miyan ki Malhar (MM) | S R g m P D n N | nDN |
| Bahar | S R g m P D n N | nDN |
The manually extracted pakad phrases serve as templates for the phrase‑level segmentation of the corresponding raga alaps across the 11 singers. We obtain one or more templates of the given phrase from each of the 11 singers’ pakads. (As for the phrase nDN, however, the phrase was not found in the pakad for singers AP, MG and MP for raga MM, and for AP and MG for raga Bahar, which limited our singer‑specific gesture investigations to fewer singers for this particular phrase.) The set of templates represents the diversity in the realisation of the phrase across and within singers. Figure 6 presents examples that illustrate the diversity in melodic shape for each of the phrases chosen for the current study. For the phrase segmentation in the alaps, we restrict the number of distinct templates to six to limit the search complexity.
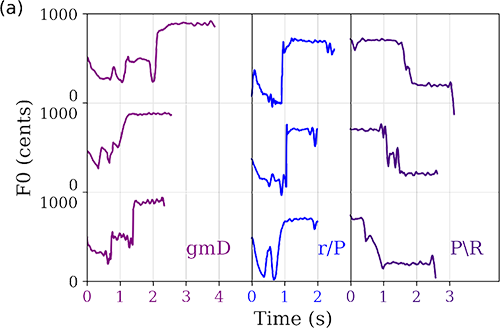

Figure 6
Sample templates for each of the raga characteristic phrases: (a) gmD (purple), r/P (blue) and P\R (violet) and (b) nDN from raga MM (brown) and nDN from raga Bahar (red).
In Figure 6, we observe that the simple notation used to represent the up (/) or down slide (\) belies the complexity of contour shapes defined by raga grammar. The nDN phrase shows distinctions in the melodic shape across the two ragas. This is consistent with the fact that a note sequence such as nDN is a simple representation, while in practice the motifs are governed by more subtle raga‑specific constraints such as the relative prominence given to each note or the speed of transition between them. We note prominent differences in phrase duration within each phrase class, while the essential aspects of the melodic progression are preserved across the instances of the class. This indicates the need for a flexible distance metric, such as dynamic time warping (DTW), which captures shape similarity in the face of possibly non‑uniform temporal expansion/compression (Müller, 2015). We use the DTAI‑Distance package of Python (Meert et al., 2016) to carry out the DTW subsequence search.
The following steps (the first two of which are presented in the flowchart of Figure 7) lead to the desired segmentation and labelling of each SDS in the alap audio files for the given raga phrase. Our objective is to find the best‑matched subsegment, within this SDS, to that phrase as represented by its reference templates, and next determine whether the SDS indeed contains the phrase of interest on the basis of the quality of the match.

Figure 7
The pipeline for F0‑based segmentation of alap using manually labelled pakad phrases. For warping the pakad phrase templates, a window size of 100 and a penalty of 200 was chosen, while for the subsequence alignment, K = 20 and penalty = 0.1 were chosen (Meert et al., 2016). Segments shorter than 0.5 s were discarded as invalid.
The six phrase templates from across the pakads are warped to the same target length (that of the third template in increasing length order in the set). This helps to ensure that the subsequence DTW matching costs can be meaningfully compared across the templates. The warped audio templates and subsequence search is illustrated with an example of the phrase gmD from raga Bageshree in Figure 8.
The DTW‑based subsequence search is carried out across the F0 contour of the SDS separately with each of the six warped audio templates (WAT). An important consideration influencing the algorithmic parameters is to avoid pathological warping paths that can result in unusually low distance values for mismatched queries. This is achieved using a penalty parameter that constrains the search space by discouraging large deviations from the diagonal path. For each WAT, the lowest‑cost match is obtained that satisfies a duration criterion ( 0.5 s) to further eliminate invalid matches resulting from pathological warping. The resulting matches are accepted as valid and stored with the cost, temporal boundaries and WAT index. In a case wherein no valid match is returned (in the top 20 retrieved responses) for a particular template, that SDS–template pair is not considered further. This step leaves us with between one and six best‑matched segments per SDS along with the associated DTW costs. We then pick the single lowest cost for each SDS across those obtained from the six templates, and use this as a representation of raga phrase match for the given SDS.
The next stage involves assigning a target label to each SDS, indicating whether or not it contains the raga phrase in question. This is implemented in a completely unsupervised manner as indicated in the following. Figure 9 presents an example of the distribution of SDS cost across all the 22 alaps (11 singers × 2 instances) of Raga Nand. We observe a roughly bimodal distribution and exploit this to obtain the labelling of the alap SDS. A kernel density estimate (KDE) is fitted to the distribution of costs (Chiu, 1991). The cost value coinciding with the lowest point in the valley between the two peaks is found, and 0.5 of this value is used as a cost threshold to label each SDS as one of the two classes: ‘Like’ (i.e. similar to the raga motif) and ‘Unlike’ (different from the raga motif). The choice of 0.5 of the minimum cost was based on a check by an expert listener who confirmed that the so‑selected Like instances were indeed perceptually similar to the phrase templates and Unlike‑labelled instances largely dissimilar. This rule serves well across the different raga phrases except for Bahar nDN, where the KDE fit is dominated by a single mode. In this case, we found that a cost threshold of 0.1 times the minimum was more realistic. The supplementary material presents the KDE plots and thresholds selected for each of the raga motifs.

Figure 8
An example of DTW‑based subsequence search of an SDS to identify an instance that best matches the phrase gmD using pakad reference templates. Each of the six warped audio templates is used as a query in the subsequence search, and the query (Q) resulting in the minimum cost is stored. The image on the left shows the audio templates for the phrase gmD. In this example, Q1 is the lowest‑cost query arising from the subsequence alignment shown with respect to the full SDS in the bottom right.

Figure 9
Distribution of the DTW subsequence cost across the SDS of all singer alaps for the best‑matched audio phrase template for P\R of raga Nand. The grey vertical line shows the location of the minimum derived from the kernel density estimate (KDE) fit (dashed red contour), from which the threshold for labelling the SDS as Like and Unlike with reference to the template phrase is derived. This threshold cost marked by the black vertical line is set as half of the location of the minimum of the KDE fit.
Finally, with each SDS’s audio subsegment (both Like and Unlike) identified, we extract the corresponding time‑aligned gesture time series. We store the index of the WAT that achieved the best match for the given SDS. Note that the SDS and WAT may not belong to the same singer.
In the next section, we report our experiments on testing various kinematic features on the segmented gesture time series to see whether (i) the stable/non‑stable segment labels can be predicted, and (ii) the Like/Unlike labels for each SDS can be predicted from the DTW distance computed between the segmented gesture time series of the SDS and that of its matched WAT.
5 Gesture‑Based Classification Experiments
The set of gesture time series comprises position (x, y and z coordinates), velocity (x, y and z components and magnitude) and acceleration (x, y and z components and magnitude) for each audio segment of interest. Our gesture‑based classification task then involves predicting a label from features computed solely on the gesture time series, where the target labels have been previously assigned in the audio‑based segmentation. Figure 10 provides a high‑level view of our approach, using the phrase‑level task as an example, to the overarching question of whether melodic similarity implies gestural similarity. Next, we present the feature computation and classification method for each of our two categories of melodic events.
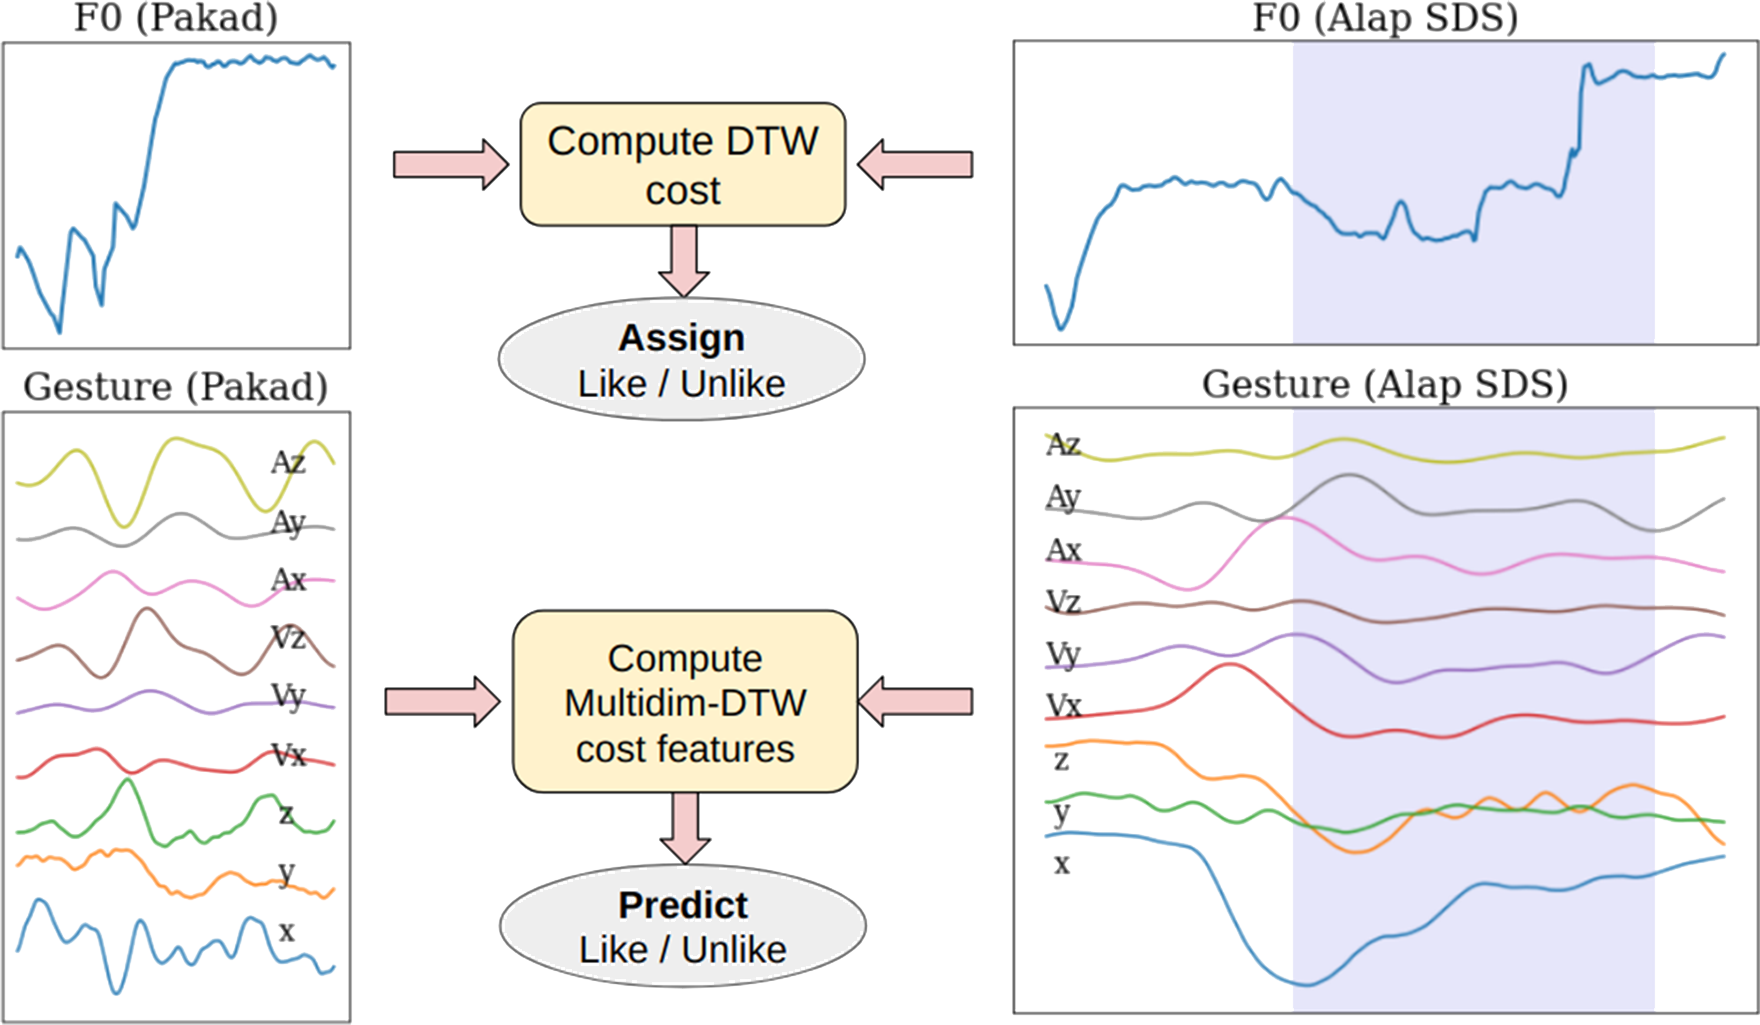
Figure 10
Explaining F0‑based segmentation and labelling (top) to obtain segment boundaries and target labels per SDS for use in the subsequent gesture‑based Like/Unlike prediction task (bottom). The shaded regions on the right represent the SDS subsegment associated with the F0‑based match. The corresponding time‑aligned gesture time series is used to compute the gesture‑based similarity with respect to the pakad (i.e. reference) template time series using multidimensional DTW.
5.1 Stable note detection
As discussed in Section 4.1, stable note regions were labelled in a musicologically motivated manner linked to the extent of F0 variation across the segment relative to the nominal position of the raga note. We wish to explore kinematic features that capture gestural consistencies, if any, across segments that are labelled as stable note. The effectiveness of the different features can be then tested within the classification framework depicted in Figure 11. With a hypothesis drawn from informal observations that a singer is relatively stationary during the singing of stable notes, we investigate a set of features representing the extent of variation in the kinematic quantities of velocity and acceleration across the segment. We extend the feature set of Nadkarni et al. (2023) to include the depth dimension and also new keypoints such as the right and left elbow joints. We test different combinations of features spanning a wide range in dimensionality.

Figure 11
The framework for the evaluation of kinematic features computed from the gesture time series corresponding to stable note and non‑stable segments as detected from the F0 contour.
Using a support vector machine (SVM), we implement binary classification, training and testing on the dataset of labelled stable notes and the (complementary) non‑stable segments where the training and test data are both drawn from across singers and ragas. Although 250 ms regions of stable pitch qualified as stable notes, as depicted in the distribution of segment durations in Figure 5, we restricted the examples of both categories used in this experiment to those with duration in the range [0.5, 5] s to ensure that the training dataset was relatively balanced.
We carry out feature extraction from the stable note and non‑stable segments as follows. We find the mean and standard deviation of the position (left and right wrist; x, y and z coordinates), component‑wise velocities and accelerations, and magnitudes of velocity and acceleration. This gives the features: {Position x, Position y, Position z, Velocity x, Velocity y, Velocity z, Velocity magnitude, Acceleration x, Acceleration y, Acceleration z, Acceleration magnitude} {mean, standard deviation} {Left, Right} {Wrist, Elbow}, a total of features. We create distinct groups of features that can facilitate an understanding of the role of absolute magnitude versus raw 3D coordinates, and the influence of including position coordinates and elbow joints.
Five different combinations are studied (both means and standard deviations in each) as described here and summarised in Table 4:
VA‑Mag‑W: Magnitudes of velocity and acceleration, for wrists (eight‑dimensional feature vector)
VA‑W: Component‑wise velocity and acceleration, for wrists (24‑dimensional feature vector)
PVA‑W: Component‑wise position coordinates, velocity and acceleration for wrists (36‑dimensional feature vector)
PVA‑E: Component‑wise position coordinates, velocity and acceleration for elbows (36‑dimensional feature vector)
PVA‑WE: Component‑wise position coordinates, velocity and acceleration for both wrists and elbows (72‑dimensional feature vector)
Table 4
Details of the features used in all variants of the experiment on stable note classification (M, mean; sd, standard deviation; L, left; R, right; W, wrist; E, elbow).
| Abbreviation | Dimensions | Features |
|---|---|---|
| VA‑Mag‑W | 8 | |
| VA‑W | 24 | |
| PVA‑W | 36 | |
| PVA‑E | 36 | |
| PVA‑WE | 72 |
For training the SVMs, we can choose to train on the segments of one particular singer, a combination of singers or all of the singers. We carry out the following types of experiments:
Singer‑specific classification: Segments from every singer are considered separately, and a 10‑fold cross‑validation is carried out within each singer’s data set.
Across‑singer classification: The cross‑validation for the entire data is done in three different ways to investigate singer dependence and raga dependence of gestures:
Uniform singer splits: Segments from all singers are distributed uniformly across the folds for 10‑fold cross‑validation, ensuring the even spread of the labels as well as raga identity.
Unseen singer splits: An 11‑fold cross‑validation is carried out, where, in each fold, one singer’s tokens are kept in the testing data, while those from the other 10 are kept in the training data.
Unseen raga splits: A nine‑fold cross‑validation is carried out, where, in each fold, one raga’s instances are kept in the testing data, while those from the other eight are kept in the training data.
The cross‑validation is carried out with grid search, using the Python library scikit‑learn (Pedregosa et al., 2011) to identify the best hyper‑parameters for the SVM (tuning done on hyper‑parameters and ) which give the maximum F1 score (mean cross‑validation F1 score). Since some of the singers have an imbalance between counts of stable and unstable notes, the F1 score is a better metric than accuracy. The radial basis function (RBF) kernel is used. On the training data in each cross‑validation split, a standard scaler normalisation is applied (subtracting from each feature its mean and dividing by the standard deviation). The cross‑validation F1 score corresponding to the model with the best hyper‑parameters is reported.
5.2 Raga phrase detection
Our goal is to determine whether the Like and Unlike target labels (that were assigned based purely on melodic shape proximity with respect to raga phrase templates as discussed in Section 4.2) can be predicted by gesture alone at better than chance and, if so, which kinematic features are most useful in this task. In the context of our alap gesture time series, already segmented on the basis of the audio phrase matching, we compute the similarity between the two multidimensional kinematic time series corresponding to the phrase template and the candidate being tested, respectively. As in the audio‑matching case, we turn to DTW for a similarity measure that considers optimising temporal alignment in the cost computation. Multidimensional time series, however, present us with some distinct options for the distance computation. Two obvious approaches are DTW‑independent (DTW‑I) and DTW‑dependent (DTW‑D) depending on whether the individual time series are each warped independently and then the costs combined or whether they are all forced into a single warping path in higher dimensional space (Shokoohi‑Yekta et al., 2017). Given that the velocity and acceleration contours are derived from the corresponding position time series of the wrists, the DTW‑D is a meaningful option as well. Furthermore, decoupling the left and right wrists in DTW‑D gives us DTW‑LR with a feature vector of length 2. Similar to F0‑contour matching, in the interest of avoiding pathological warps, we look for techniques that restrain the DTW path from straying too far from the diagonal path. In the context of multidimensional DTW, we use the available Sakoe–Chiba band constraint for DTW in comparing the kinematic contours, with a Sakoe–Chiba radius of 100 samples (1 s) to prevent any warping significantly away from the main diagonal of the DTW cost matrix.
With each of the time series being independently warped, we also consider the option of retaining the individual costs in the form of a single feature vector representing the overall similarity. This leads to a 36‑dim feature vector of costs () termed DTW‑Ind. Retaining the individual time‑series costs could potentially lead to the classifier learning to suppress less informative features. To study the loss, if any, from the use of wrists alone, we have DTW‑Ind‑W by dropping the elbow keypoints from DTW‑Ind. The above set of five distinct feature vector choices comprising the DTW costs is utilised in the gesture‑based binary classification of the alap instance into Like/Unlike categories for a given raga phrase.
Similar to our experiments with stable note detection, we pool all the tokens across singers, separately for each raga phrase, for classification experiments exploring different criteria for the train–test splits. With the uniform distribution of singers across folds in cross‑validation testing, both train and test sets in each of the splits contain instances belonging to each of the singers. We implement this uniform‑singer classification [similar to Nadkarni et al. (2023)] using 10‑fold cross‑validation (CV) in a logistic regression classifier to arrive at performance metrics for each feature set. The overall process is illustrated by Figure 12. We note that the gesture DTW distance is computed between a given alap instance segmented via the audio subsequence search and its best matched query (of the set of pakad reference templates across singers), potentially pairing two different singers. The unseen singer is similar to the uniform singer in terms of feature computation that uses the template gesture time series based on the best‑matched audio template; it differs only in the manner that the subsequent CV splits are constructed, with no singer common to both train and test sets at any time.
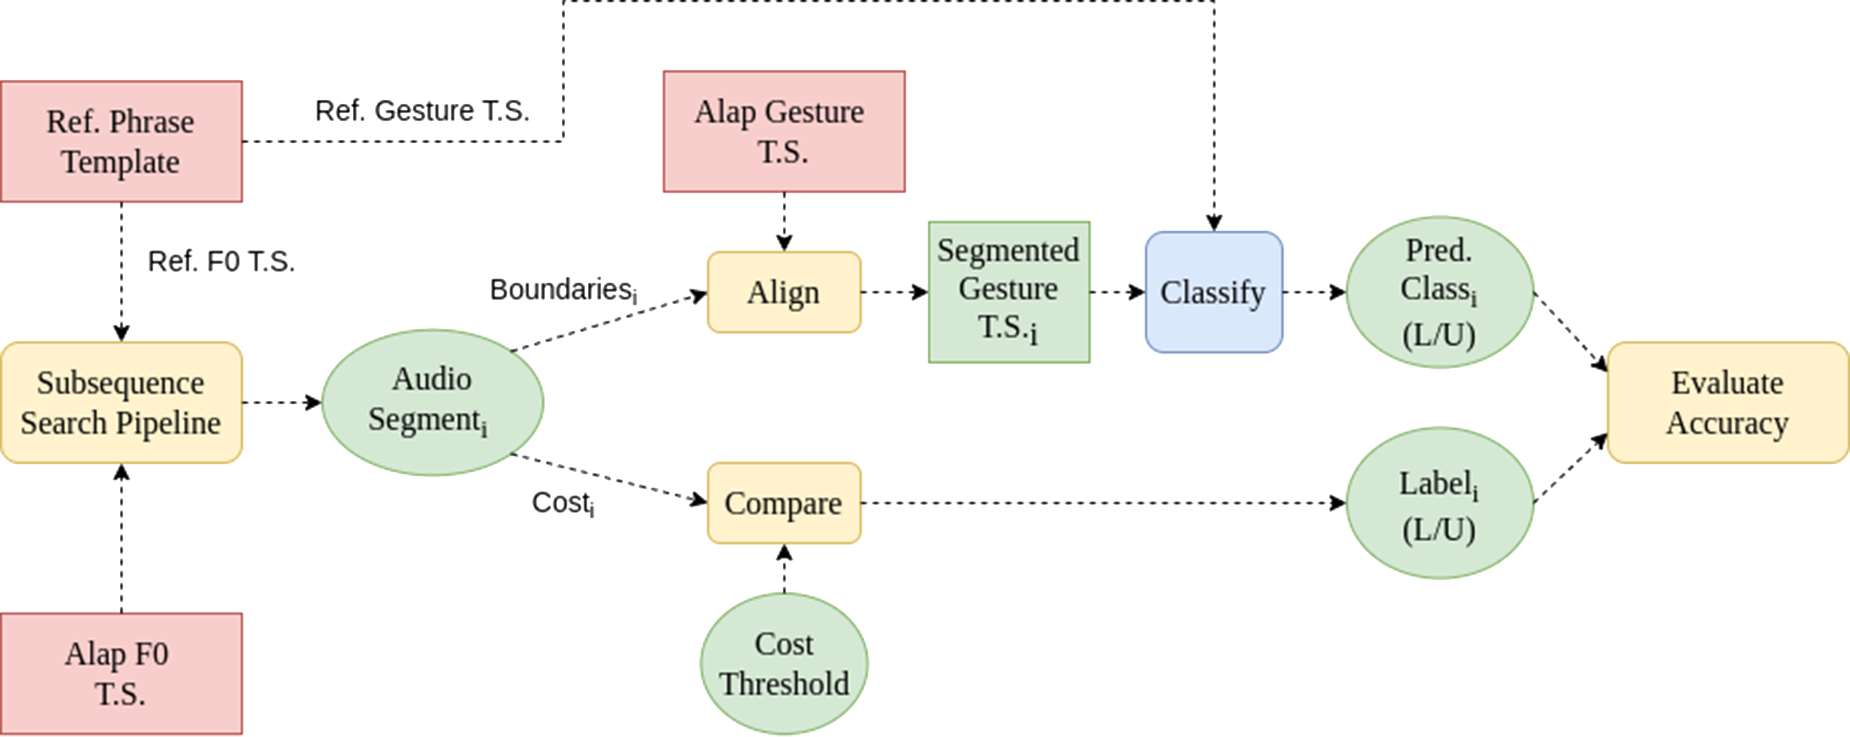
Figure 12
The overall framework for the raga phrase‑based classification. The audio and visual components of a candidate audiovisual (AV) segment (i.e. an SDS from an alap) are separately compared with the respective audio and visual components of a reference phrase segment (from a pakad) to see whether they are together consistent in their estimate of similarity with the reference phrase. We note that the gesture time series (T.S.) is multidimensional, while the audio T.S. is a unidimensional sequence of F0 samples.
Given the relatively small number of tokens per singer per phrase, we report singer‑specific and unseen‑singer phrase detection performances only for the phrase with the most data, namely r/P of raga Shree. In the singer‑specific case, however, the gesture DTW is restricted to alap instances and queries of the same singer. That is, for every instance segmented on the basis of audio matching, we take the reference gesture time series from a reference instance of the same singer. This accounts for singer dependence when it comes to gestures and is expected to improve the Like/Unlike classification performance. In some cases, the available pakad of a singer does not contain the particular phrase which we are considering, in which case we decided to omit the singer in our analysis of that phrase.
As noted in Section 1, we present an additional experiment that tests gesture‑based discrimination of very similar motifs between two related ragas. This more challenging scenario involves predicting whether the raga Miyan ki Malhar (MM) nDN motif can be reliably detected from a set of tokens comprising all candidate instances from MM and Bahar pooled. The same experiment is reported with the Bahar motif (i.e., predicting the raga Bahar nDN motif from the set of tokens drawn from both ragas).
6 Results and Discussion
We present the detection performance for the melodic events of interest from features computed on the kinematic time series. In each testing scenario discussed in the last section, multi‑fold CV is applied as appropriate to obtain the performance in terms of the detection F1 score computed across the predictions on the entire set of tokens, each of which appears once in the test set. That is, for each type of melodic event, the prediction performances of the different kinematic time series are provided in the context of the following distinct train–test data splits: uniform singer, unseen singer, singer‑specific and, in the case of stable note experiments, unseen raga as well.
6.1 Stable note detection
Table 5 presents the details of the singer‑specific experiments for stable note detection. We see a wide variation across singers in the count of instances as well as the proportion of stable notes. The percentage of stable notes is viewed as the chance F1 score pertaining to a model that predicts a segment as a stable note with a probability equal to the percentage of stable notes. We see that the classification scores greatly surpass the chance levels for all our experiment variants. We note that the all‑feature model (PVA‑WE) outperforms the other variants for all singers other than NM and SCh (where it compares favourably with the wrists‑only PVA‑W).
Table 5
Singer‑specific counts and F1 scores (%) for stable note detection from segmented gesture time series across the set of instances in the duration range [0.5, 5] s. The segments from all alaps and pakads for each singer are included with the total count provided together with the percentage of segments with stable note labels as obtained from F0‑based labelling. For all the experiment variants, the F1 scores are significantly better than the chance F1 scores (p < 0.001). Bold font indicates the best value per singer.
| AG | AK | AP | CC | MG | MP | NM | RV | SCh | SM | SS | |
|---|---|---|---|---|---|---|---|---|---|---|---|
| Total count | 1778 | 2146 | 2485 | 2965 | 1928 | 2252 | 1846 | 1720 | 973 | 2328 | 2064 |
| Percentage of stable notes (%) | 53.8 | 45.3 | 47.5 | 35.3 | 57.4 | 56.2 | 40.0 | 39.6 | 52.8 | 45.8 | 31.3 |
| VA‑Mag‑W | 80.3 | 77.5 | 75.2 | 71.5 | 80.7 | 81.2 | 75.4 | 69.7 | 83.2 | 76.6 | 61.7 |
| VA‑W | 91.3 | 87.9 | 85.2 | 83.7 | 87.7 | 86.1 | 88.1 | 80.3 | 91.2 | 82.8 | 74.4 |
| PVA‑W | 92.9 | 90.4 | 87.1 | 84.5 | 90.1 | 89.1 | 90.3 | 84.9 | 94.0 | 85.9 | 76.4 |
| PVA‑E | 91.6 | 86.5 | 85.3 | 82.5 | 86.8 | 86.9 | 84.5 | 80.6 | 89.7 | 84.6 | 71.2 |
| PVA‑WE | 93.7 | 90.5 | 89.8 | 85.4 | 91.3 | 89.6 | 89.7 | 84.9 | 93.8 | 88.1 | 77.3 |
The performance increase across the rows is linked to the increasingly more complex features, as we replace kinematic parameter magnitudes with the individual x, y, and z components, include position coordinates and, finally, incorporate kinematic features from the elbow keypoints as well. The large improvement from VA‑Mag‑W to VA‑W (i.e. replacing magnitudes with component‑wise velocities and accelerations) highlights the importance of retaining the directionality information in movements. Adding position data to velocity and acceleration (PVA‑W as compared with VA‑W) further improves the performance, showing that the actual position in normalised coordinates space of the singer’s wrists also plays a direct role in determining whether the sung note is stable or not. This somewhat surprising outcome is supported by video examples in the supplementary material showing a singer raising their hands to a more or less fixed height on stable notes, unrelated to the pitch height of the note.
Comparing PVA‑WE with PVA‑W, we see that adding the elbow joint features brings a small increase in the stable note detection performance. In contrast, eliminating the wrist features and using only the elbow (PVA‑E) leads to a more substantial performance drop for most singers. This is as expected because the wrist movements, although coupled to elbow motion, are more free and of larger magnitude. An observation (not reported in the table) was that, for most singers, the performance with right‑wrist‑only was similar to that with left‑wrist‑only, with both values exceeded when the two wrists were tracked.
In Table 6, we present the detection F1 scores aggregated across singers. The performance drop is relatively large from uniform‑singer splits (86.1%) to unseen singer (80.5%) when compared with that for unseen raga (84.4%). This indicates that the raga dependence of stable note related gestures is not as high as the singer dependence. We also compare these F1 scores with the count‑weighted mean F1 score for the singer‑specific experiment (PVA‑WE) row from Table 5, which comes out to be 88.2%.
Table 6
F1 scores (%) for the different stable‑note‑detection experiments. The “singer specific” score indicates the count‑weighted average of F1 scores for PVA‑WE in Table 5. Next, we carry out cross‑validation in three different types: uniform split (10‑fold CV), unseen singer split (11‑fold CV) and unseen raga split (9‑fold CV). The features PVA‑WE were used in all cases. The total number of segments classified is 22,485 (all alaps and pakads across all 11 singers and nine ragas), with the percentage of stable notes at 45.3%.
| Singer‑specific | Uniform split | Unseen raga | Unseen singer | |
|---|---|---|---|---|
| Folds (#) | 10 | 10 | 9 | 11 |
| F1 (%) | 88.2 | 86.1 | 84.4 | 80.5 |
6.2 Raga phrase detection
We present the results of the motif detection experiments in the different testing contexts, uniform singer, singer‑specific and unseen singer. For the last two, we present only the r/P phrase, with the details for the other phrases provided in the supplementary material. The F1 scores are computed for each type of the DTW cost feature vector discussed in Section 5.2, covering the distinct ways of representing the gestural similarity between the multidimensional reference phrase template and test segment extracted from the alap SDS.
Table 7 presents the motif detection performance for all the considered raga phrases, including the homonymous phrases associated with the two ragas MM and Bahar, with the singers distributed uniformly across the 10 folds (i.e. the uniform‑singer split). The total number of Like and Unlike segments is given by the ‘count’. It is less than the total number of SDS because some SDS return invalid segments (i.e. too short in duration) in the audio‑based DTW. The eliminated segments are observed to be non‑phrase‑containing where the collapse of the DTW path in the course of the subsequence search stems from the particularly large mismatch with the query motif. With the consequent loss of these (essentially highly unlike) segments, we end up with a similar number of Like and Unlike segments.
Table 7
F1 scores (%) for motif detection for each of the raga phrases computed with the uniform‑singer splits in 10‑fold CV across the different DTW cost feature vector choices. The final two rows pertain to the prediction of the first‑mentioned raga’s phrase when the test set contains the pooled instances of both ragas. The best performance in each row is in bold font. The * indicates the value is statistically significant () when compared with a chance classifier which predicts ‘Like’ with a probability equal to the percentage of like segments..
| Phrase | Raga | #SDS | Count | Like (%) | DTW‑D (1) | DTW‑I (1) | DTW‑LR (2) | DTW‑Ind (36) | DTW‑Ind‑W (18) |
|---|---|---|---|---|---|---|---|---|---|
| r/P | Shree | 505 | 415 | 50.1 | 69.0* | 70.5* | 64.7* | 65.9* | 66.4* |
| gmD | Bageshree | 489 | 331 | 53.2 | 59.9 | 65.4* | 65.1* | 64.6* | 65.2* |
| PR | Nand | 435 | 301 | 45.9 | 30.5 | 22.9 | 66.4* | 74.6* | 75.8* |
| nDN | MM | 429 | 155 | 54.2 | 77.3* | 77.3* | 66.8* | 79.3* | 71.4* |
| nDN | Bahar | 433 | 257 | 48.6 | 68.9* | 67.4* | 54.8 | 71.8* | 74.3* |
| nDN | MM, Bahar | 862 | 396 | 21.2 | 2.4 | 4.6 | 54.3* | 52.1* | 44.6* |
| nDN | Bahar, MM | 862 | 438 | 28.5 | 15.0 | 1.6 | 46.4* | 46.4* | 43.1* |
In the top five rows of Table 7, we see the F1 scores for the detection of the given phrase across all the valid instances of the 22 alaps of the same raga. We observe F1 scores that are significantly higher than chance across all the phrases for at least one of the DTW cost feature vector choices. In the case of r/P (raga Shree), with its relatively high count of instances, we have consistently high F1 scores across all the different feature vectors, pointing to the overall reliability of gesture‑based prediction for this phrase. The gmD phrase (raga Bageshree) also exhibits a uniform but slightly lower detection performance. The remaining three phrases have lower total counts. They all show high F1 scores for the higher dimensional feature vectors.
Moving on to the raga pair experiment, we note from the final two rows of Table 7 that we can, to a significant extent, separate a raga motif from its homonymous counterpart in a different raga on the basis of DTW distance. In the “MM, Bahar” and “Bahar, MM” rows, the Like segments of the first raga are put in the Like category (say, Class ‘1’), whereas the other class (Class ‘0’) contains Like segments of the opposite raga, Unlike segments of the same raga and Unlike segments of the opposite raga. For instance, the MM‑Bahar row presents detection scores for the MM nDN phrase from the entire set of instances drawn from all MM and Bahar alap SDS pooled. We obtained a performance significantly better than chance (which stands at 21.2%) for the DTW‑LR features, indicating that the gesturing style does play a role in differentiating the singing of the two ragas.
The above‑noted MM‑Bahar raga‑based gestural distinction appears consistent with the audio‑based characteristics as depicted in Figure 13. We see that duration is a prominent acoustic difference between the homonymous phrases. The distribution of the F0‑based DTW cost further reveals that the nDN motifs of Bahar, while melodically close to the MM reference phrases (relative to non‑nDN Bahar and MM segments), evince a clear offset in the distribution peak.
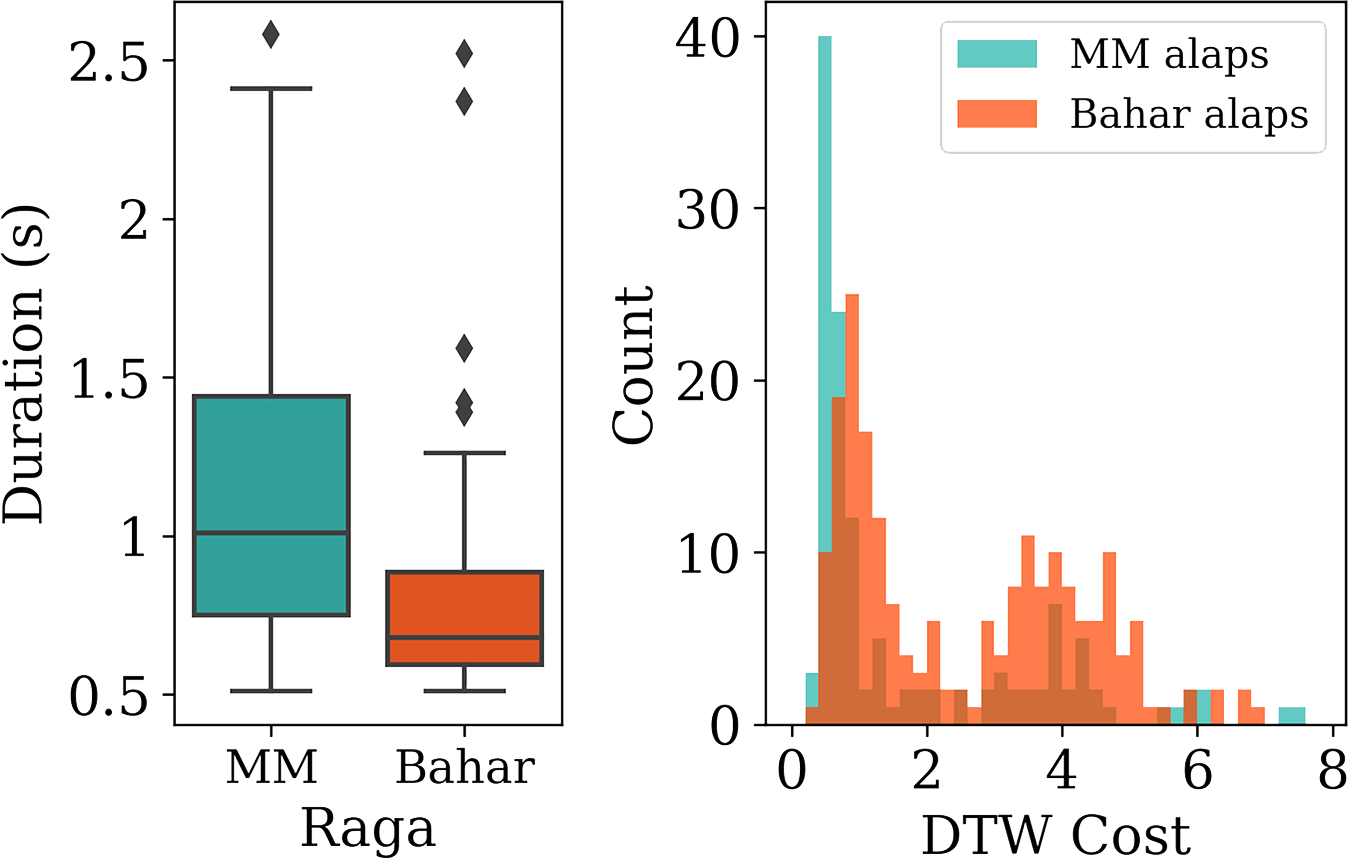
Figure 13
Left: Comparing the duration distributions of the ‘Like’ instances for the ragas MM and Bahar. Right: Histogram of DTW costs (across each of the MM and Bahar alaps) for the F0‑contour subsequence search with respect to reference templates of phrase nDN from pakads of raga Miyan ki Malhar (MM).
Table 8 allows us to study the predictability of any particular singer’s r/P phrase from a classfier trained solely on the data of the other 10 singers. We see that all the singers show, for at least one choice of the feature vector, a prediction‑performance better‑than‑chance level indicating the presence of common gestural cues across singers for this highly characteristic upward slide. This would be consistent with the qualitative analysis presented in Leante (2009). Singers AP, AG and SCh demonstrated particularly high performances, while singer SS was least well predicted. Furthermore, there were several singers who showed a drop in scores with elbows included over wrists alone. This may be attributed to occasionally unreliable data from elbow tracking owing to clothing‑linked occlusions.
Table 8
F1‑scores for the detection of raga Shree r/P with unseen‑singer splits (i.e. leaving one singer out of CV) across the different DTW cost feature vectors. Bold fonts indicate the highest obtained performance for each singer.
| AG | AK | AP | CC | MG | MP | NM | RV | SCh | SM | SS | |
|---|---|---|---|---|---|---|---|---|---|---|---|
| Count | 31 | 38 | 41 | 52 | 28 | 27 | 30 | 47 | 36 | 36 | 49 |
| Like (%) | 71 | 57.9 | 43.9 | 30.8 | 50 | 48.1 | 56.7 | 61.7 | 38.9 | 61.1 | 42.9 |
| DTW‑D (1) | 82.6 | 60.4 | 68.3 | 56.1 | 64.7 | 77.4 | 68.3 | 76.5 | 68.3 | 78.4 | 60.0 |
| DTW‑I (1) | 83.7 | 56.0 | 74.4 | 56.1 | 68.6 | 81.3 | 68.3 | 75 | 68.3 | 80.9 | 60 |
| DTW‑LR (2) | 50.0 | 64.0 | 81.1 | 40.8 | 58.3 | 42.1 | 68.8 | 61.8 | 77.8 | 76.2 | 59.7 |
| DTW‑Ind (36) | 62.9 | 62.8 | 76.9 | 48.8 | 61.5 | 63.6 | 64.5 | 56.0 | 76.5 | 74.4 | 62.5 |
| DTW‑Ind‑W (18) | 66.7 | 59.6 | 75 | 55.3 | 64.5 | 57.1 | 70.6 | 51.1 | 85.7 | 77.3 | 63.8 |
Table 9 reports phrase r/P detection performances when the DTW comparison in gesture as well as cross‑validation testing was done within a singer’s data set. We carried out training and testing using 10‑fold CV within each singer’s set of r/P Like/Unlike tokens. For most singers, DTW‑Ind obtains the best performance, followed closely by DTW‑Ind‑W. We observe particularly high detection performance (relative to chance) for the singers AG, SCh and CC, implying self‑consistency in their gesturing associated with r/P. Singer SS, in contrast, exhibits poor gesture‑based detection. The singer‑specific performances for the other raga motifs are reported in the supplementary material.
Table 9
F1‑scores for the detection of raga Shree r/P with singer‑specific splits (i.e. 10‑fold CV entirely within the individual singer’s data set) across the different DTW cost feature vectors. Bold fonts indicate the highest obtained performance for each singer.
| AG | AK | AP | CC | MG | MP | NM | RV | SCh | SM | SS | |
|---|---|---|---|---|---|---|---|---|---|---|---|
| Count | 31 | 38 | 41 | 52 | 28 | 27 | 30 | 47 | 36 | 36 | 49 |
| Like (%) | 71 | 57.9 | 43.9 | 30.8 | 50 | 48.1 | 56.7 | 61.7 | 38.9 | 61.1 | 42.9 |
| DTW‑D (1) | 83 | 71.2 | 0 | 11.8 | 80.0 | 48.3 | 74.4 | 76.3 | 81.5 | 75.9 | 0 |
| DTW‑I (1) | 88.0 | 73.3 | 0 | 40.0 | 59.3 | 23.5 | 73.7 | 76.3 | 63.6 | 75.9 | 0 |
| DTW‑LR (2) | 76 | 71.2 | 48 | 43.5 | 76.9 | 43.5 | 72.2 | 76.3 | 92.3 | 75 | 58.8 |
| DTW‑Ind (36) | 81 | 78.0 | 77.8 | 85.7 | 82.8 | 69.6 | 82.4 | 74.6 | 85.7 | 74.4 | 66.7 |
| DTW‑Ind‑W (18) | 87.0 | 60.5 | 77.8 | 78.6 | 75.9 | 64 | 74.3 | 73.3 | 89.7 | 78.3 | 42.9 |
Table 10 displays the performances for the different train–test split conditions aggregated across all 11 singers. We present results for two of the DTW cost vectors, the high‑dimensional DTW‑Ind and low‑dimensional DTW‑LR. Together these serve to illustrate the interaction of feature dimensionality with achievable separation in the limited training data context. The singer‑specific training data are relatively low, as seen from the counts in Table 9, while unseen‑singer data utilises all the tokens of 10 singers to make predictions regarding the test singer. A general trend is a fall in detection performance from singer‑specific to unseen singer, as also borne out by the direct comparison of the scores of individual singers AK, MG, NM, RV and SCh across Table 8 and 9. Singer SM, in contrast, displays a similar performance in both contexts. This reinforces the singer dependence of gestures while also acknowledging the similarity across singers in the gesture realisation of the r/P motif.
Table 10
F1 scores (%), aggregated across the 11 singers, for the detection of the phrase r/P under each of the listed train–test split conditions. Results are presented for two DTW cost feature vector choices.
| Singer‑specific | Uniform split | Unseen singer | |
|---|---|---|---|
| Folds (#) | 10 | 10 | 11 |
| DTW‑Ind (36) | 77.9 | 65.9 | 63.9 |
| DTW‑LR (2) | 65.7 | 64.7 | 61.8 |
7 Conclusions
As noted in the introduction, computational analysis such as the work presented here seeks to build on qualitative and ethnographic research describing and interpreting Indian singers’ manual gestures. Together with Nadkarni et al. (2023), this is the first study on gestural similarity using musicologically motivated melodic motifs. We started by verifying for our data set of Hindustani alaps, previous research on the correlations between raw acoustic and kinematic time series as reported from motion capture data of Karnatak music performances. We then described methods for the unsupervised segmentation of the audio recording for stable notes and for selected raga motifs (in the latter case, using a small number of manually labelled reference templates). The corresponding temporally aligned movement data of singers’ wrists and elbows were used to derive features for the prediction of the presence of a stable note or the melodic phrase of interest.
As expected, we were able to identify stable note segments with a high degree of accuracy, scoring significantly better than chance across all singers. Feature models including raw position data for the wrists and elbows as well as velocity and acceleration scored best, leading to the conclusion that not only the (presumably reduced) speed of movement but also the spatial position of the hands is significant in terms of the accompaniment of stable notes. Observation of video examples suggests that the key factor that is pertinent here may be the physical height of the hand position.
Looking at the raga motifs, the picture is more mixed. The Shree r/P is an example previously highlighted as simple (it comprises a single upward slide in pitch), characteristic of the raga, and linked to the meanings associated with the raga. This motif can be picked out using the movement information across the different singers. In this case, a strong, characteristic and focused upward melodic movement is frequently accompanied by a rising hand movement. The other motifs were selected on the basis of musical knowledge but without clear previous analysis highlighting distinctive movements; thus, the analysis was more exploratory. In fact, the detection scores were lower for the other motifs, although still above chance. Looking at the motif nDN (shared by MM and Bahar) as an example, prediction is harder because the melody is mapped onto more diverse movements whose similarity appears hard to capture. We observe that the gestures have something in common – a high degree of mobility and an oscillatory movement from n down to D, then back up to N – but the movements occur in a different plane and with different hand positions, presumably making it challenging to capture the similarity. However, the kinematic information does help distinguish between the two ragas (consistent with the idea that the two ragas have different speeds and moods).
Our analysis confirms both the high degree of idiosyncrasy in gesturing and the fact that nonetheless there are commonalities across singers in the way movements match melodies. In each case, prediction rates fall off in unseen‑singer conditions, although this drop‑off is less marked in the stable note detection (although singer dependence is more significant than raga dependence in this task). Stable note identification shows that the correlation of these segments with relatively stable raised hand positions is strong enough that stable notes can be reliably identified as such from gesture information alone. Raga phrase motifs, with their more complex melodic shapes and the scope for variation, pose more challenges to gesture modelling, as borne out by our motif detection results as well as the video examples included in the supplementary material.
How consistently, then, is melodic content mapped onto gesture, as revealed by the examples selected here? The headline findings are of a significant degree of consistency and above‑chance classification alongside significant singer‑dependency. Consideration of misclassified examples, as, for example, in the supplementary material, enriches this picture. For instance, we showed an example of a stable note accompanied by moving rather than stationary hands, which we noted may signify a ‘stretching out’ of the steady note along a line or a stable plane. We shared an example of the descending PR motif accompanied by a rising hand gesture, contrasting with the more typical falling gesture, which we interpreted as signifying the resistance of the melody to a further fall to the tonic S. We further noted that, in the case of nDN, very different gestures may have features in common but be difficult to classify because they are presented on a different plane. Taking these examples together, we can see that what determines gesture is not simply correlation between pitch and physical movement, but between movement and intention. We noted in the introduction that gesture maps onto different referents (e.g. melody, rhythm and inter‑performer communication). When referring to melody, gesture may refer not simply to F0 but to dynamics or timbre – factors not covered in this study. Even when gesture appears linked most closely to pitch movement, however, the result depends not simply on the pitch movement but on the intention. For example, gesture may communicate “Having moved to this note I am now holding it steady, which means I am continuing to expend effort, as I would to hold my hand up”, or “The melody is falling to the second degree, so it feels like the natural thing to do is to fall further to the tonic, but see how I am resisting this fall”. Raga melodies are not simply sets of pitch sequences but structures of movement with intrinsic patterns of tension and relaxation which the singer works with and against. In our interpretation, gesture allows the patterns of movement to be actualised in the body as well as, for example, ways in which a singer feels herself to be resisting certain possibilities to create tension. Melodic movement can moreover be translated by the body in different ways – in the vertical or horizontal or some other plane, by one hand or both, and so on – and this is not standardised through explicit teaching. This is why we find enough consistency in the mapping to enable better than chance prediction, while also finding singer‑dependency and a significant number of segments that cannot be classified – not just because the amplitude of movement is too small or because they lie in an unexpected plane but because the logic of the gesture is different to that of other tokens of the type. This may present a practical limit on the possibilities for melody detection from gestural information, although computational classification alongside human interpretation could be musicologically productive.
The discussion above points to the potential of further improvements with higher abstraction levels to model gestures. Movement similarity can then be measured in the model space rather than through distances calculated directly between time series. Further benefits can come from the inclusion of finger joints in gesture tracking. Finally, as with the stable note detection of this work, future research can extend to other more generic pitch contour elements such as glides and oscillations, greatly widening the scope of the study. Other dimensions of singing that could be relevant – beyond pitch F0 – include timbre, dynamics and vowel sounds. The outcomes can be fruitfully exploited in designing for human interaction with synthetic instruments in ecologically valid ways, and the animation of visual avatars for vocal performance. Apart from contributing to the broad sub‑discipline of cultural informatics, this study bears out the idea that, in exploring musical gesture, computational analysis informed by musical knowledge and qualitative observation will lead to knowledge not accessible by musically blind, purely data‑driven exploration. Iterative analysis in which computational results are further reflected on qualitatively, in turn suggesting new computational approaches, is likely to be particularly fruitful.
8 Reproducibility
Supplementary figures, tables and video examples, as well as the code to reproduce the work, are available at: https://github.com/DAP-Lab/Audio-Gesture-Correspondence-TISMIR-2024.
Competing Interests
The authors have no competing interests to declare.
Note
[1] Dataset & Pre‑processing: https://github.com/DAP-Lab/hindustani_raga_dataset_processing.