
Table 1
Comparison of existing datasets for each instrument in the jazz piano trio.
| Instrument | Name | Method | Tracks | Duration (s) | Annotations | Metadata |
|---|---|---|---|---|---|---|
| Piano | WJD | Manual | 6 | 582 | 3,149 onsets | Beat, chord, section |
| PiJAMA | Automatic | 2,777 | 804,960 | 7,108,460 MIDI notes | N/A | |
| RWC-Jazz | Manual | 5 | 1,672 | N/A* | Beat, section | |
| JTD (ours) | Automatic | 1,294 | 159,668 | 866,116 onsets, 2,174,833 MIDI notes | Beat | |
| Bass | WJD | Automatic | 426 | 49,010 | 5,000 beat-wise pitches | Beat, chord, section |
| FiloBass | Automatic + manual | 48 | 17,880 | 53,646 MIDI notes | Downbeat, chord | |
| RWC-Jazz | Manual | 5 | 1,672 | N/A* | Beat, section | |
| JTD (ours) | Automatic | 1,294 | 159,668 | 543,693 onsets | Beat | |
| Drums | WJD | Automatic + manual | 67 | 6,506 | 28,851 cymbal onsets | Beat, chord, section |
| RWC-Jazz | Manual | 5 | 1,672 | N/A* | Beat, section | |
| JTD (ours) | Automatic | 1,294 | 159,668 | 796,604 onsets | Beat |
[i] *Note: RWC-Jazz has not been made available free and open source, meaning that it is not possible to provide full detail here.
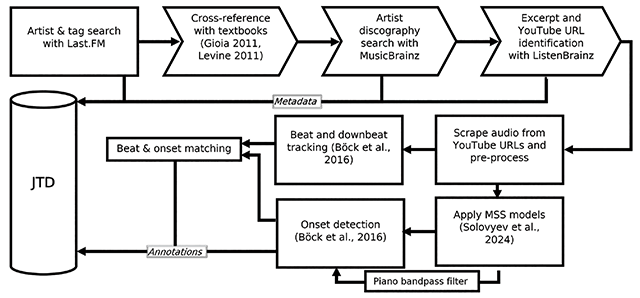
Figure 1
Diagram shows the process for constructing JTD. Arrow block symbols indicate stages where tracks/artists may be removed.
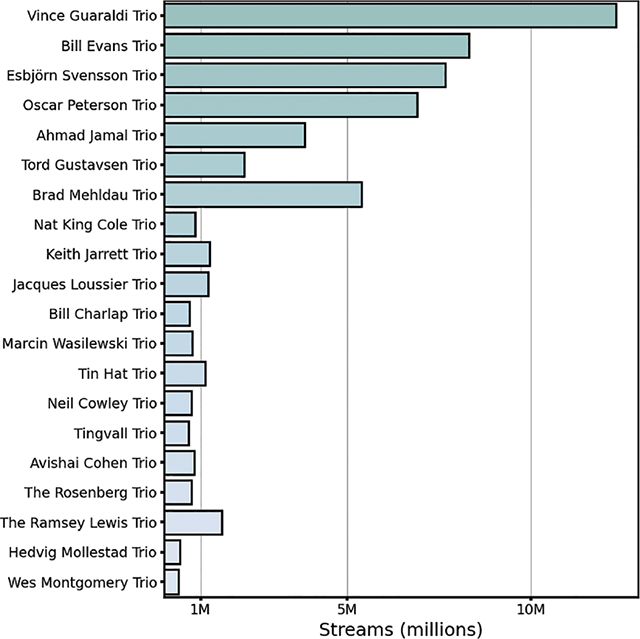
Figure 2
Total streams (“scrobbles”) of all recordings made by the top 20 “trio” artists most frequently tagged as “Jazz” on Last.fm.
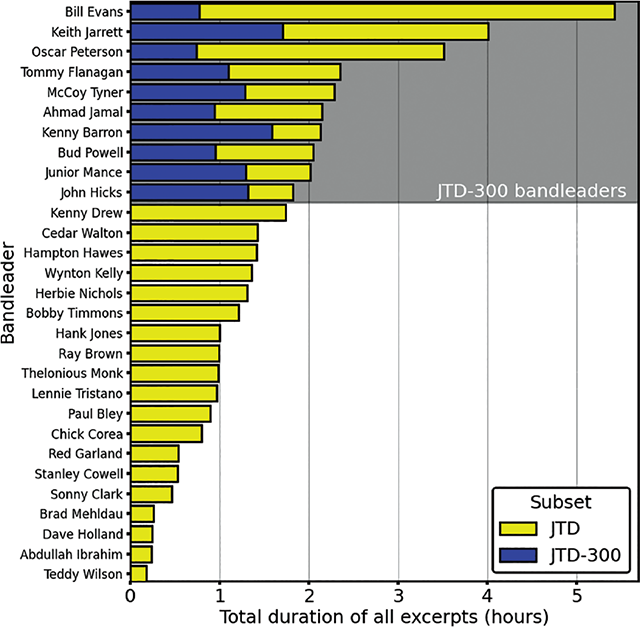
Figure 3
Duration of piano solo excerpts by all bandleaders: bar color indicates subset (either JTD or JTD-300).
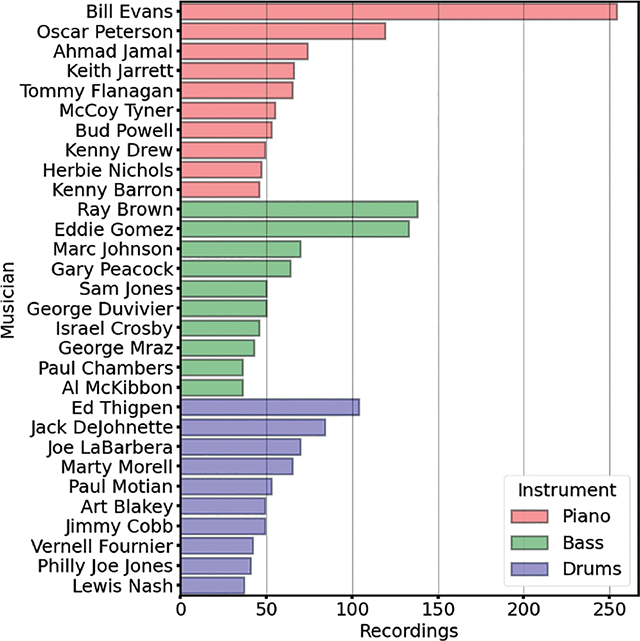
Figure 4
The number of tracks featuring the 10 performers on each instrument with the most recordings in JTD.
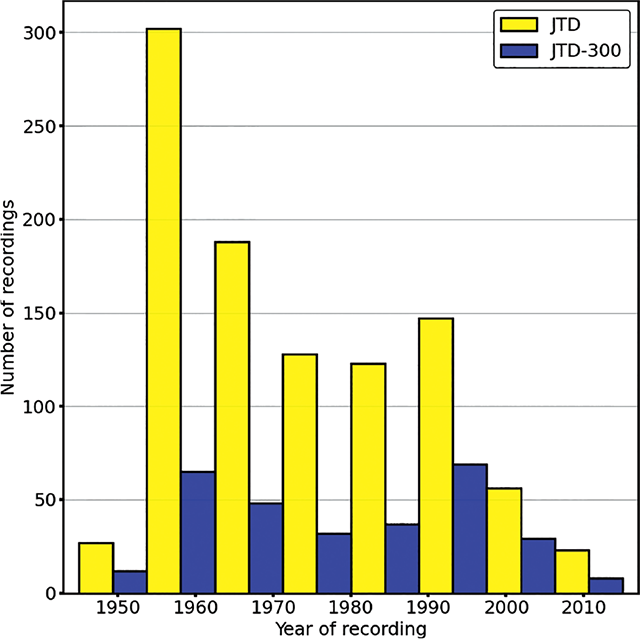
Figure 5
Histogram grouping number of tracks by year of recording: bar color indicates subset.
Table 2
Optimized results per instrument, showing F-measure, precision, and recall (mean ± SD).
| Piano | Bass | Drums | Beats | Downbeats | |
|---|---|---|---|---|---|
| F | 0.93 ± 0.03 | 0.93 ± 0.05 | 0.95 ± 0.03 | 0.97 ± 0.05 | 0.63 ± 0.44 |
| P | 0.93 ± 0.04 | 0.94 ± 0.04 | 0.96 ± 0.04 | 0.97 ± 0.05 | 0.63 ± 0.44 |
| R | 0.93 ± 0.04 | 0.93 ± 0.07 | 0.94 ± 0.04 | 0.97 ± 0.05 | 0.63 ± 0.44 |
Table 3
Results per method, piano only (mean ± SD).
| MIDI transcription (1) | Spectral flux (2) | CNN: no filtering (3) | CNN: narrow filter (4) | |
|---|---|---|---|---|
| F | 0.77 ± 0.13 | 0.84 ± 0.06 | 0.92 ± 0.03 | 0.92 ± 0.03 |
| P | 0.71 ± 0.16 | 0.79 ± 0.10 | 0.90 ± 0.06 | 0.95 ± 0.03 |
| R | 0.86 ± 0.09 | 0.90 ± 0.04 | 0.93 ± 0.03 | 0.89 ± 0.05 |
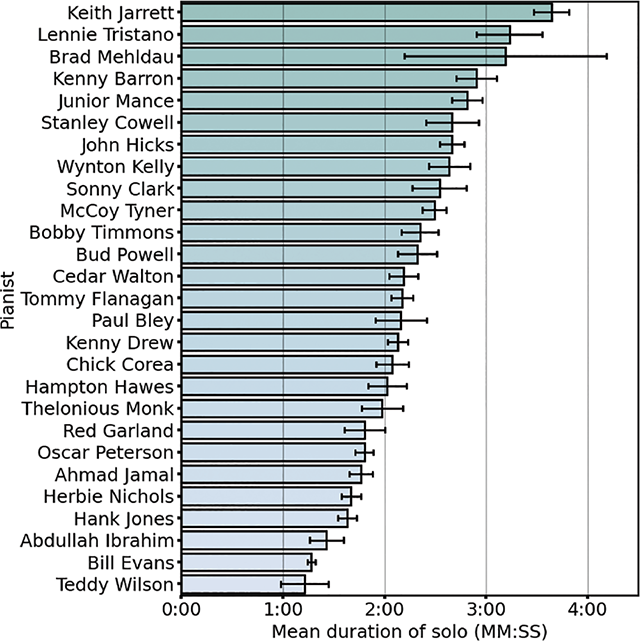
Figure 6
Mean duration of solos by different JTD pianists. Error bars show standard errors.
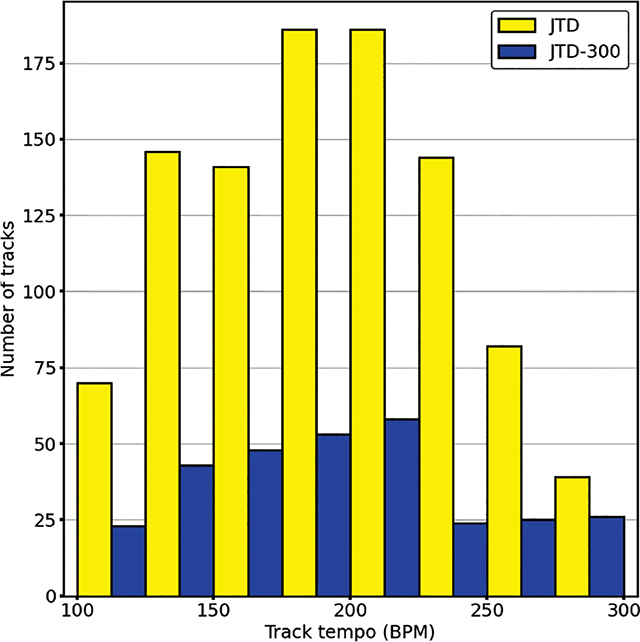
Figure 7
Distribution of tempi (in quarter note beats per-minute).
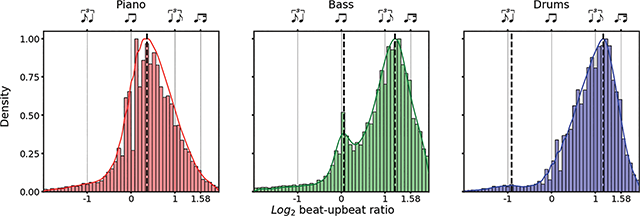
Figure 8
Each panel shows the distribution of log2 beat–upbeat ratios among instruments across JTD, normalized such that the height of the largest bar in each panel is 1. Dotted vertical lines show peaks of the density estimates; straight lines correspond to the musical notation given along the top of the panel.
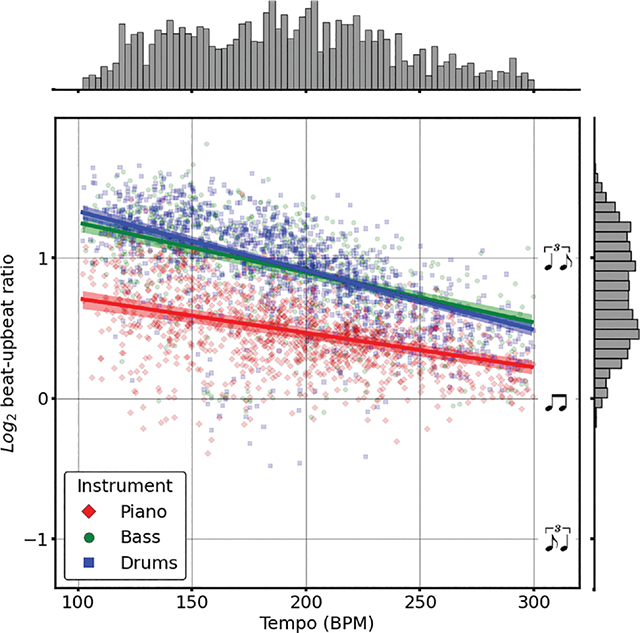
Figure 9
Markers show mean log2 beat–upbeat ratio and tempo; solid lines show predictions (without random effects); and shaded areas show 95% confidence intervals (obtained via bootstrapping over data from different pianists, N = 10,000)
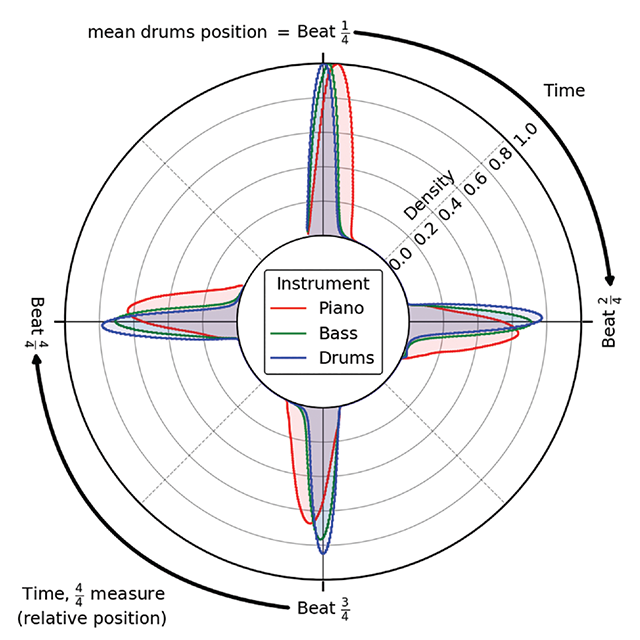
Figure 10
Diagram shows kernel density estimates for the relative position of beats by each instrument, indicated by color. Density estimates are scaled such that the maximum height of the curve for each instrument is 1.