
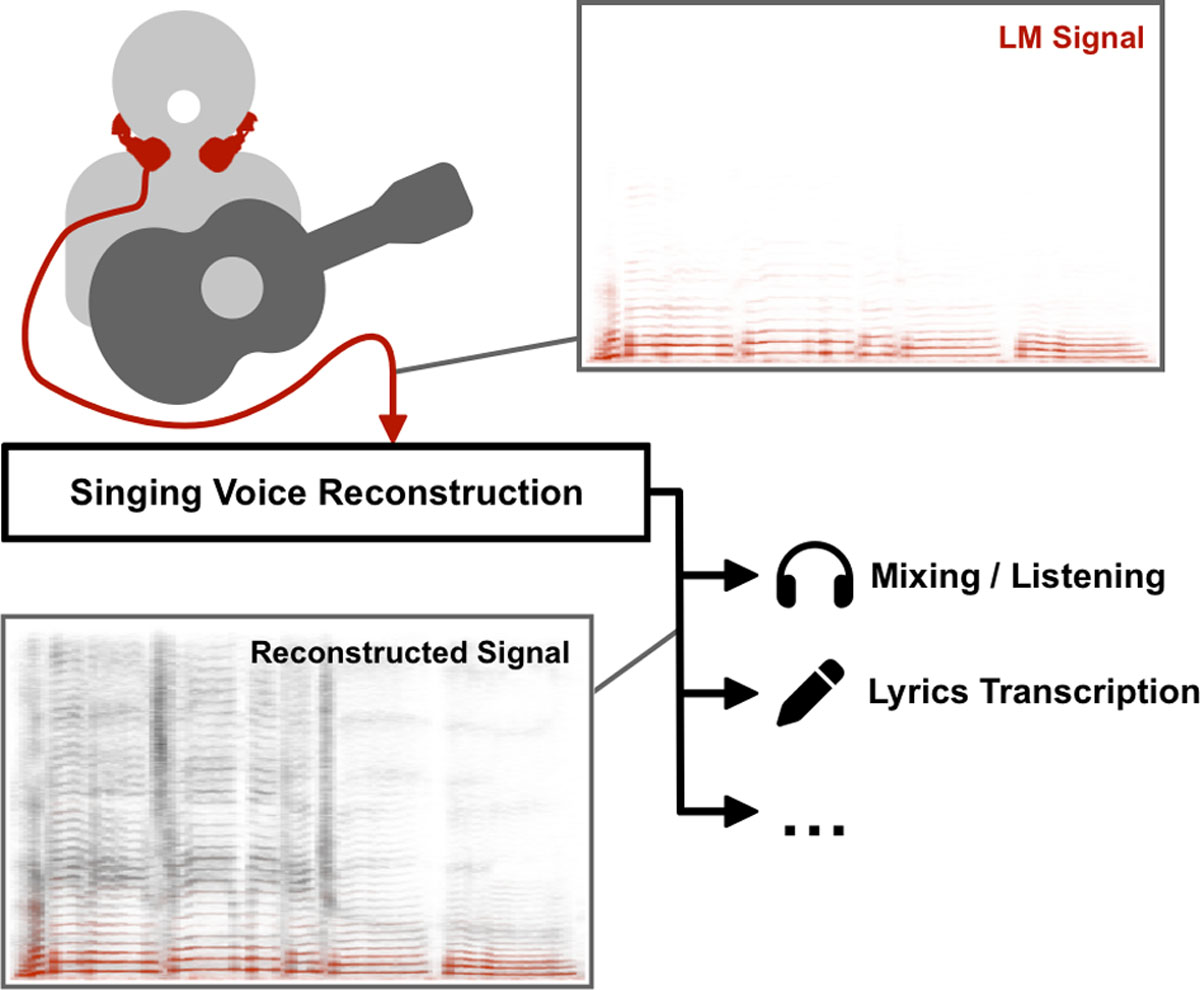
Figure 1
Conceptual overview of SVR from LM signals. Time-frequency representations of an exemplary LM signal and the corresponding reconstructed signal are depicted in red and grey, respectively.
Table 1
Overview of the songs and takes in LM-SSD. C1 and C0 represent the number of takes with and without crosstalk, respectively. Songs marked with * have German lyrics.
| ID | SONG NAME | ORIGINAL ARTIST | SINGER ID | TAKES C1 | LM-A C0 | TAKES C1 | LM-B C0 | DURATION (MM:SS) |
|---|---|---|---|---|---|---|---|---|
| AA | All Alone | Michael Fast | 1M | 1 | 2 | 1 | 2 | 27:03 |
| TS | The Scientist | Coldplay | 1M | 1 | 2 | 1 | 2 | 21:37 |
| YF | Your Fires | All The Luck In The World | 1M | 1 | 2 | 1 | 2 | 24:21 |
| DL | Dezemberluft* | Heisskalt | 2M | 1 | 2 | 1 | 2 | 14:47 |
| BB | Books From Boxes | Maxïmo Park | 2M | 1 | 2 | 1 | 2 | 17:39 |
| NB | Narben* | Alligatoah | 2M | 1 | 2 | 1 | 2 | 11:47 |
| SG | Supergirl | Reamonn | 3F, 1M | 1 | 2 | 1 | 2 | 26:34 |
| OC | One Call Away | Charlie Puth | 3F, 1M | 1 | 2 | 1 | 2 | 19:32 |
| PL | Past Life | Trevor Daniel & Selena Gomez | 3F, 1M | 1 | 2 | 1 | 2 | 17:45 |
| CC | Chasing Cars | Snow Patrol | 4F | 1 | 2 | 1 | 2 | 28:10 |
| BT | Breakfast At Tiffany’s | Deep Blue Something | 4F | 1 | 2 | 1 | 2 | 22:16 |
| LL | Little Lion Man | Mumford & Sons | 4F | 1 | 2 | 1 | 2 | 19:06 |
| Total | 12 | 24 | 12 | 24 | 250:37 |
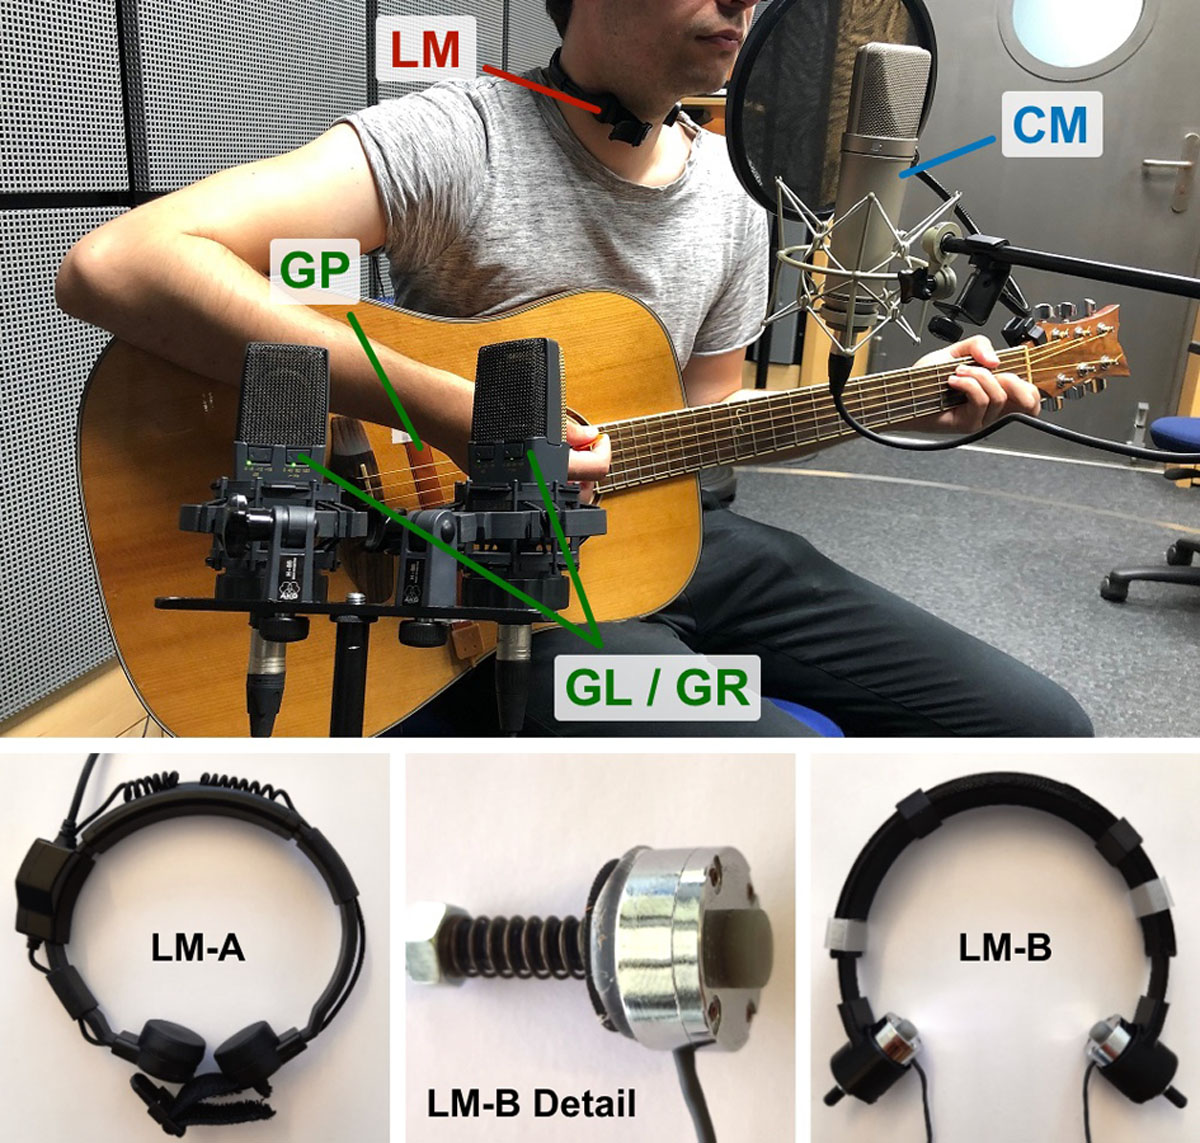
Figure 2
Photograph of the recording setup (top) and detailed depiction of the LMs used (bottom). LM-A: Albrecht AE-38-S2a larynx microphone; LM-B: self-made larynx microphone with TE Connectivity CM-01B sensor; CM: close-up microphone (Neumann U87); GP: guitar pickup (AMG Electronics C-Ducer); GL/GR: guitar stereo left/right (AKG C414).
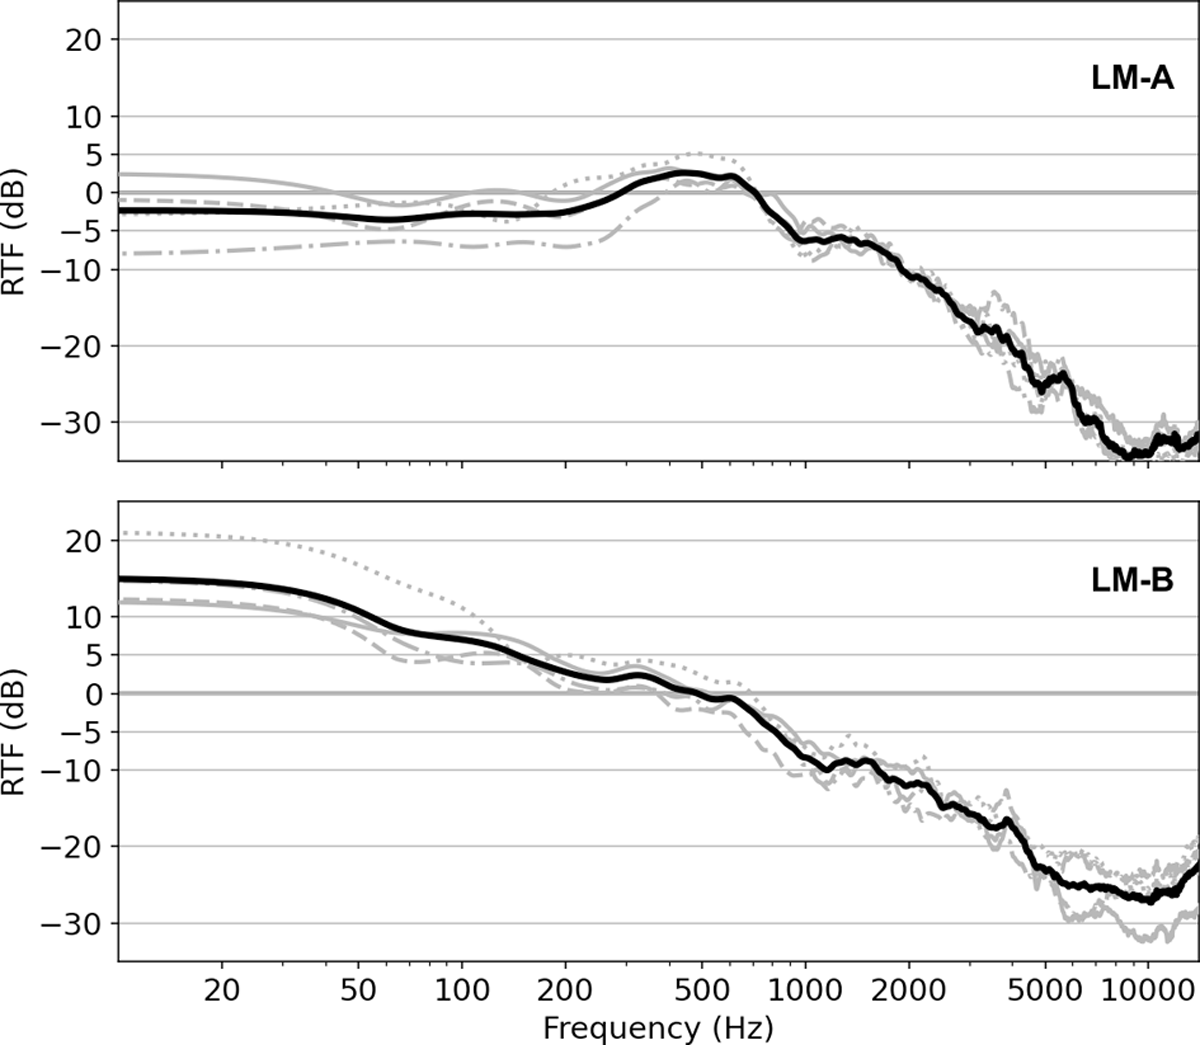
Figure 3
Relative transfer function (RTF) estimates w.r.t. CM for LM-A (top) and LM-B (bottom). RTF estimates for individual singers are shown in grey (1M: solid, 2M: dashed, 3F: dotted, 4F: dash-dotted). The black line indicates the mean RTF across singers for each LM model.
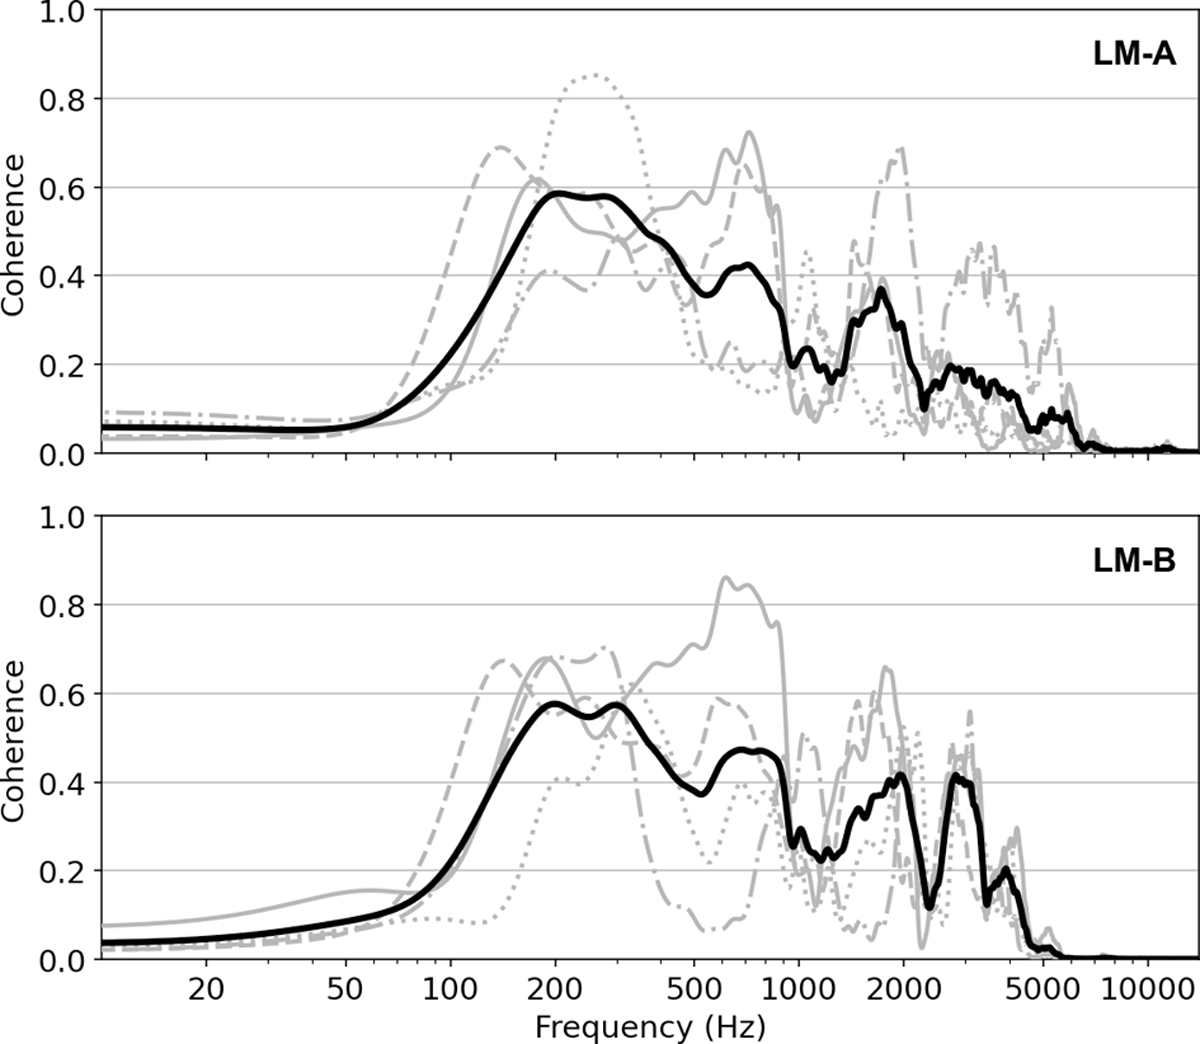
Figure 4
Coherence estimates w.r.t. CM for LM-A (top) and LM-B (bottom). Coherence estimates for individual singers are shown in grey (1M: solid, 2M: dashed, 3F: dotted, 4F: dash-dotted). The black line indicates the mean coherence across singers for each LM model.
Table 2
Dataset dimensions and naming scheme.
| FIELD | DESCRIPTION | VALUES |
|---|---|---|
| UID | Unique numerical identifier for a take across songs | 001 – 072 |
| SongID | Two-letter abbreviation of the song | cf. Table 1 |
| Type | Microphone type or mix setting | LM-A, LM-B, CM, GP, GL, GR, MixA, MixB |
| Crosstalk | Whether guitar crosstalk is present on CM (C1) or not (C0) | C1, C0 |
| Singer | Singer identifier (with gender) | 1M, 2M, 3F, 4F |
| Take | Take number for the given song (T1-T3 use LM-A, T4-T6 use LM-B) | T1 – T6 |
Figure 5
Architecture of the DDSP-based baseline system. Blue color is used for differentiable DSP building blocks, yellow color for NN building blocks with learnable parameters, and white color for fixed pre-processing steps. Control parameter flow is denoted with dashed line arrows, while solid lines indicate flow of audio signals. The spectrograms show signal content at the indicated position in the signal flow diagram. The shown example uses an excerpt from the LM-B signal of song AA T5 as the input signal xLM and a corresponding model trained with the OF scenario (see Section 6).
Table 3
Word error rate (WER) of lyrics transcription with the Whisper (Radford et al., 2022) medium model for a selection of songs from LM-SSD. Song DL uses the dedicated German Whisper model.
| WER (%) | ||||||
|---|---|---|---|---|---|---|
| SONG | SINGER | CM | LM | OF | DT | DS |
| AA | 1M | 1.83 | 72.56 | 1.83 | 22.56 | 20.73 |
| TS | 1M | 2.82 | 31.69 | 2.82 | 24.65 | 33.10 |
| DL | 2M | 2.16 | 10.81 | 2.70 | 5.95 | 7.03 |
| BB | 2M | 7.40 | 11.25 | 9.65 | 11.90 | 21.22 |
| SG | 3F | 3.70 | 11.11 | 5.76 | 11.11 | 57.61 |
| OC | 3F | 3.31 | 84.30 | 4.96 | 12.40 | 58.68 |
| CC | 4F | 0.49 | 92.65 | 0.49 | 29.41 | 91.67 |
| LL | 4F | 1.98 | 85.71 | 1.98 | 15.87 | 69.44 |
| Average | 3.27 | 49.05 | 4.25 | 15.89 | 46.13 | |
Figure 6
Listening test results according to stimulus and singer ID. LM: Larynx Microphone; NA: Naive Approach (linear filtering); OF, DT, DS: Overfitting, Different Take, and Different Song training scenarios; HR: Hidden Reference (CM signal).