
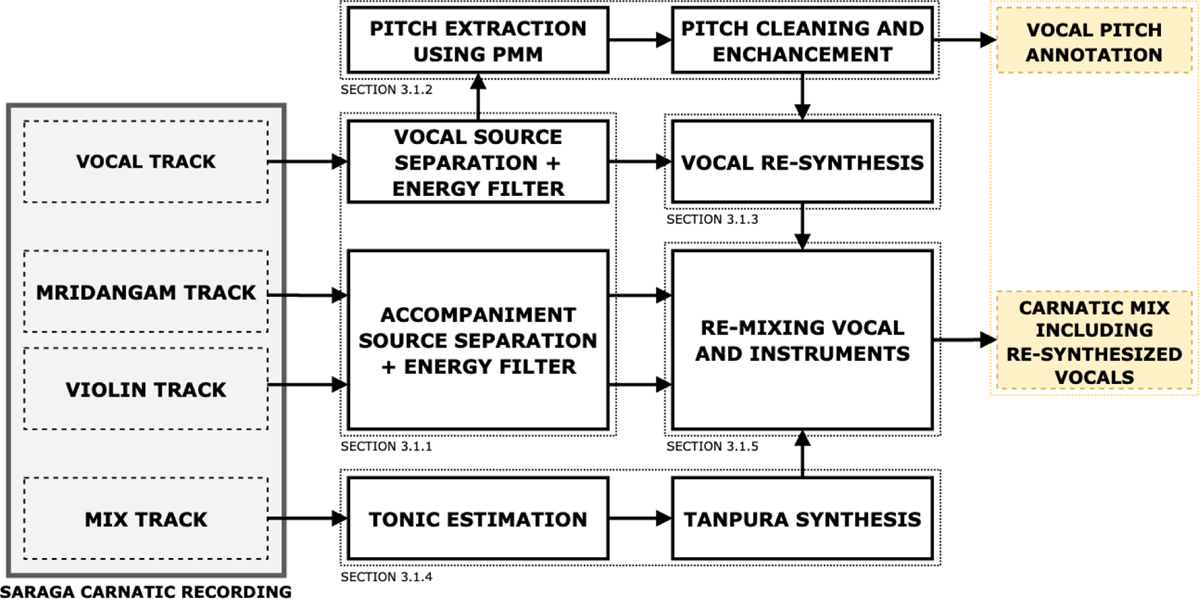
Figure 1
Block diagram of the data generation pipeline for a particular Saraga recording. We also indicate in which sections in this paper each building block is presented.
Table 1
Specification comparison between our SCMS and different state-of-the-art-melody datasets (Goto et al., 2002)*, (LabROSA, 2005)⊚, (Hsu and Jang, 2010)†, (Bittner et al., 2014)∧, (Salamon et al., 2017)⋉. Table inspired by a similar comparison by Bittner et al. (2014).
| DATASET | CONSIDERED GENRES | LENGTH | % VOCAL | NO. SAMPLES | SAMPLE LENGTH | AVAILABLE AUDIO? |
|---|---|---|---|---|---|---|
| MedleyDB V1∧ | Rock, pop, jazz, rap | ⋍447 min | 57% | 108 | ∼20–600 sec | Upon request |
| MedleyDB V2∧ | Rock, pop, jazz, rap | ⋍750 min | 57% | 196 | ∼20–600 sec | Upon request |
| MDB-mel-synth⋉ | Rock, pop, jazz, rap | ⋍190 min | 64% | 65 | ∼20–600 sec | Yes |
| MIR1K† | Chinese pop | ⋍113 min | 100% | 1000 | ∼4–13 sec | Yes |
| RWC* | Japanese & US pop | ⋍407 min | 100% | 100 | ∼240 sec | No |
| ADC2004⊚ | Rock, pop, opera | ⋍10 min | 60% | 20 | ∼30 sec | Yes |
| MIREX05⊚ | Rock, pop | ⋍6 min | 80% | 12 | ∼30 sec | Yes |
| MIREX09 | Chinese pop | ⋍167 min | 100% | 374 | ∼20–40 sec | No |
| INDIAN08 | Hindustani Music | ⋍8 min | 100% | 8 | ∼60 sec | No |
| SCMS | Carnatic Music | ⋍1235 min | 100% | 2460 | ∼30 sec | Yes |
Table 4
Comparison of different pitch extraction methods for melodic pattern discovery.
| PITCH TRACK | STEM | COVERAGE (%) | PRECISION | RECALL | F1 | NO. PATTERNS | NO. GROUPS | Φ |
|---|---|---|---|---|---|---|---|---|
| Melodia | Mix | 69.0 | 0.323 | 0.297 | 0.310 | 164 | 21 | 2.7 |
| Melodia-S | Mix | 71.4 | 0.341 | 0.371 | 0.356 | 170 | 20 | 2.8 |
| FTA-W | Mix | 74.8 | 0.250 | 0.007 | 0.113 | 4 | 2 | 2.9 |
| FTA-C | Mix | 80.3 | 0.396 | 0.655 | 0.494 | 283 | 66 | 2.2 |
| Melodia | Vocal | 76.0 | 0.514 | 0.574 | 0.542 | 181 | 48 | 1.0 |
| Melodia-S | Vocal | 75.3 | 0.523 | 0.574 | 0.547 | 197 | 50 | 1.0 |
| FTA-W | Vocal | 75.3 | 0.395 | 0.155 | 0.223 | 43 | 20 | 2.9 |
| FTA-C | Vocal | 78.0 | 0.485 | 0.669 | 0.562 | 227 | 49 | 2.4 |
Table 2
Performance comparison between FTA-Net trained using the SCMS (FTA-C) and MDB-synth (FTA-W). Results presented as percentages (%).
| MELODY EXTRACTION METRICS | ||||||||||
|---|---|---|---|---|---|---|---|---|---|---|
| VR | VFA | RPA | RCA | OA | ||||||
| ↓TEST SET/MODEL → | FTA-C | FTA-W | FTA-C | FTA-W | FTA-C | FTA-W | FTA-C | FTA-W | FTA-C | FTA-W |
| SCMS (test) | 96.35 | 83.26 | 8.38 | 31.43 | 90.17 | 69.30 | 90.46 | 70.62 | 90.99 | 67.72 |
| SHMS | 91.25 | 80.18 | 17.04 | 17.53 | 78.96 | 68.76 | 81.78 | 70.20 | 81.39 | 73.84 |
| MIREX05 | 86.74 | 89.21 | 21.40 | 19.23 | 68.11 | 73.94 | 69.68 | 74.18 | 72.44 | 76.66 |
| ADC2004 | 77.25 | 87.79 | 29.17 | 27.94 | 64.01 | 77.98 | 66.62 | 79.98 | 64.46 | 77.32 |
Table 3
Performance comparison between FTA-Net trained using the SCMS (FTA-C) and Melodia (Salamon and Gomez, 2012). Results presented as percentages (%).
| MELODY EXTRACTION METRICS | ||||||||||
|---|---|---|---|---|---|---|---|---|---|---|
| VR | VFA | RPA | RCA | OA | ||||||
| MODEL → ↓ TEST SET | FTA-C | MELODIA | FTA-C | MELODIA | FTA-C | MELODIA | FTA-C | MELODIA | FTA-C | MELODIA |
| SCMS (test) | 96.35 | 85.75 | 8.38 | 17.17 | 90.17 | 77.51 | 90.46 | 79.81 | 90.99 | 77.07 |
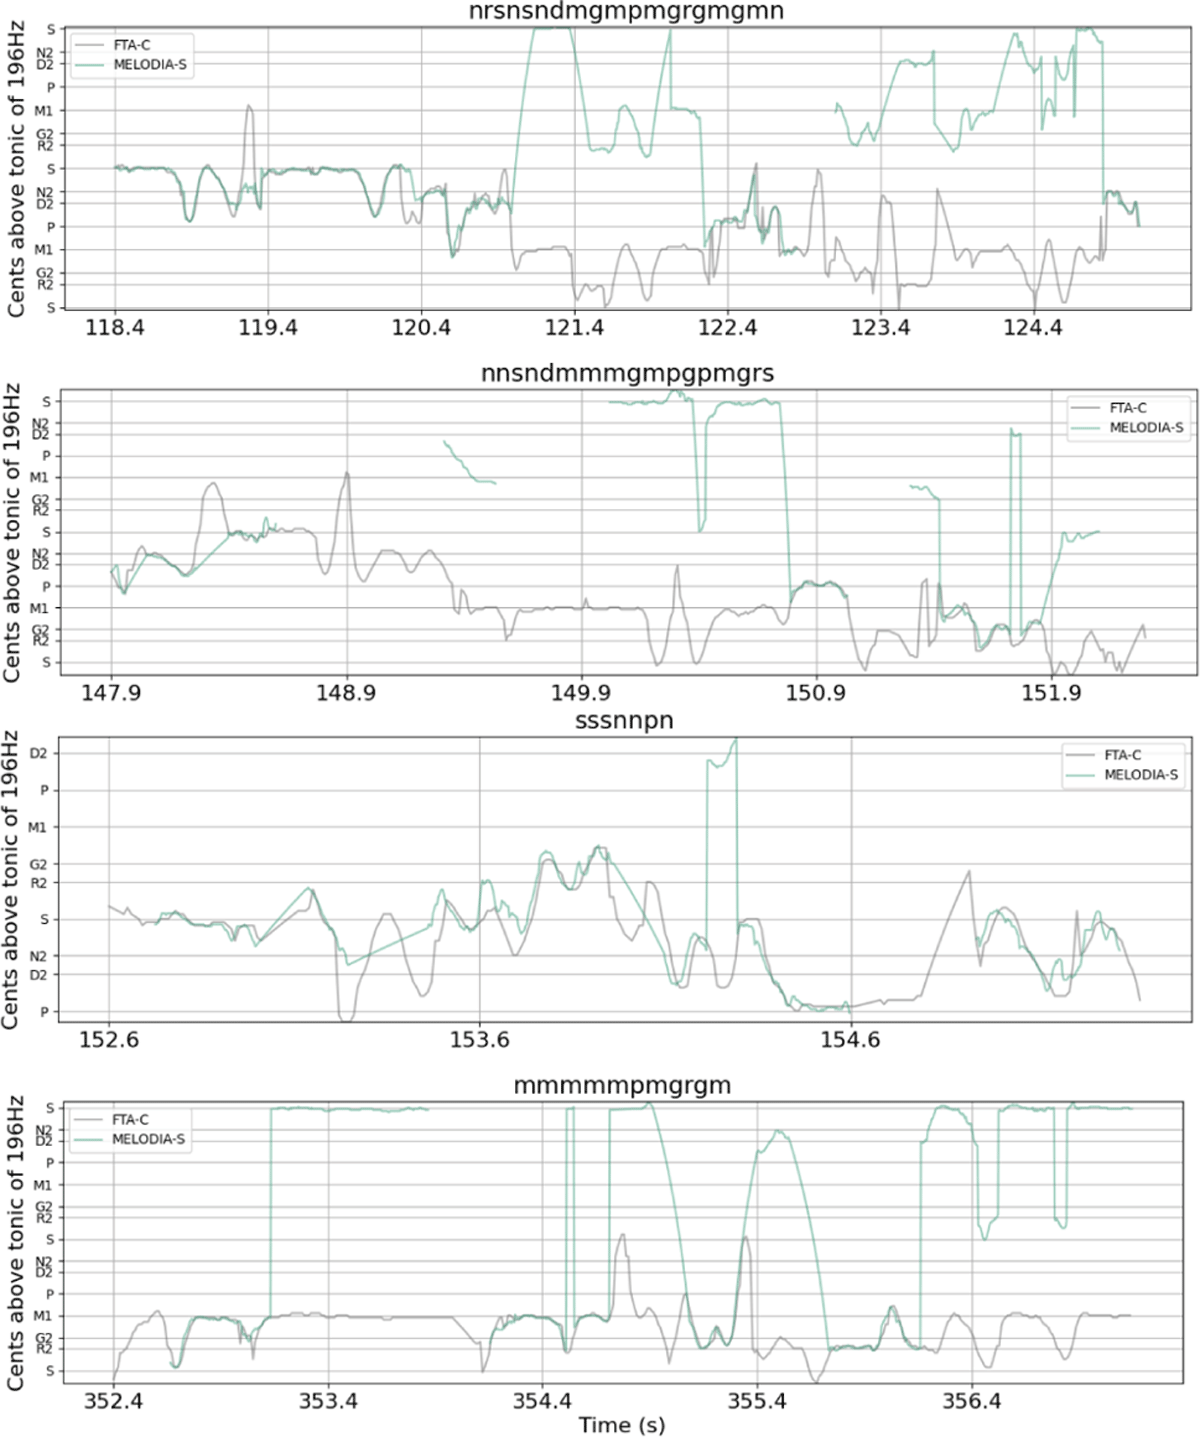
Figure 2
Four different example patterns identified by FTA-C but disregarded by Melodia-S (pitch extraction run on the mixture audio).
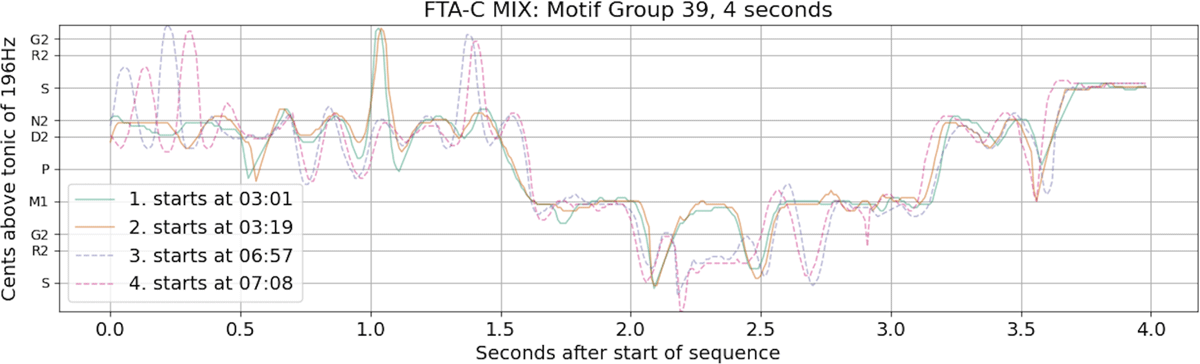
Figure 3
4 occurrences of motif 39 retrieved using FTA-C on the mixed recording. The dashed and solid lines refer to two distinct variations of the same underlying melodic pattern.