
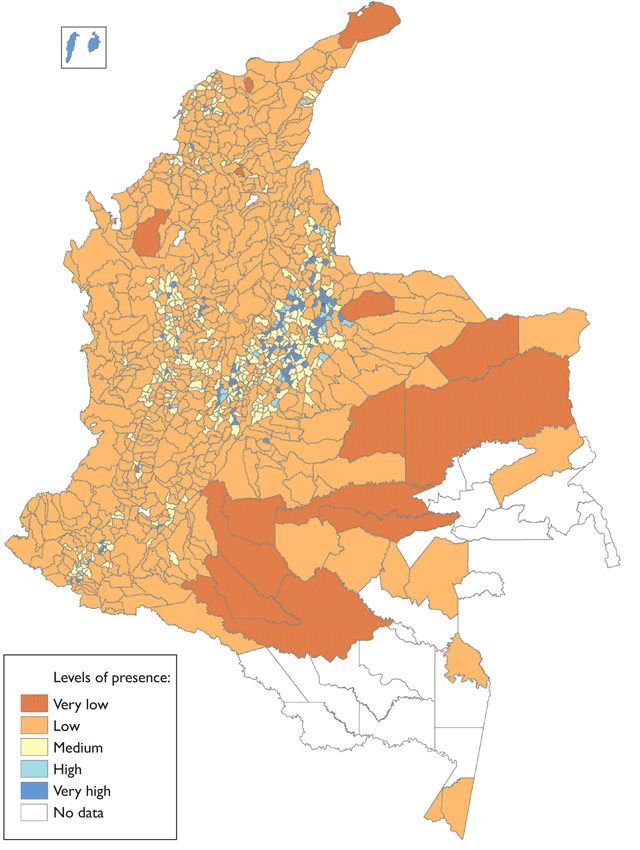
Map 1
Presence of Judges. Source: Superior Judicial Council (Consejo Superior de la Judicatura – CSJ), National Administrative Statistics Department (Departamento Administrativo Nacional de Estadistica - DANE), Agustin Codazzi Geography Institute (Instituto Geografico Agustin Codazzi– IGAC) (2012).
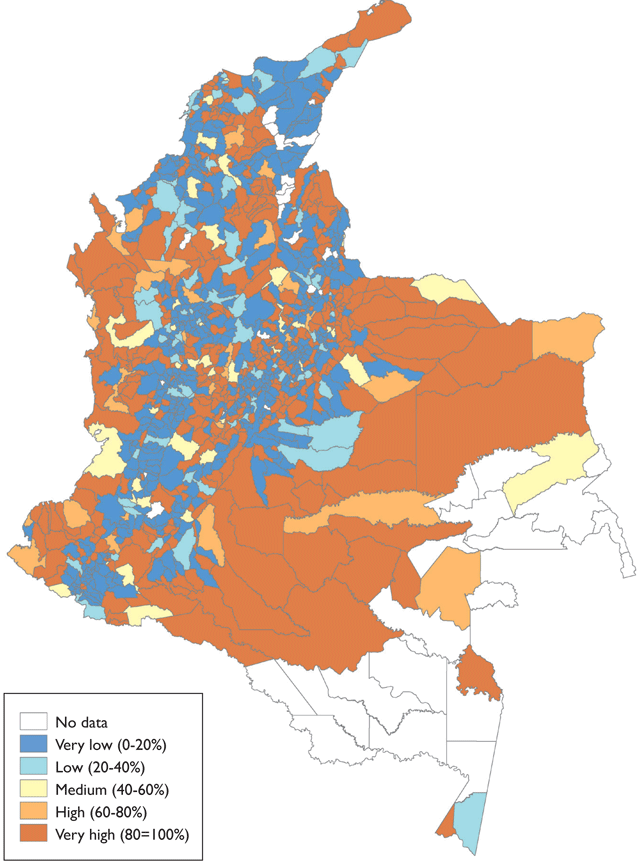
Map 2
Provisional Nature of Justice Offices. Source: Sectional judicial councils (Consejos seccionales de la judicature) (2013). Authors’ own calculations.
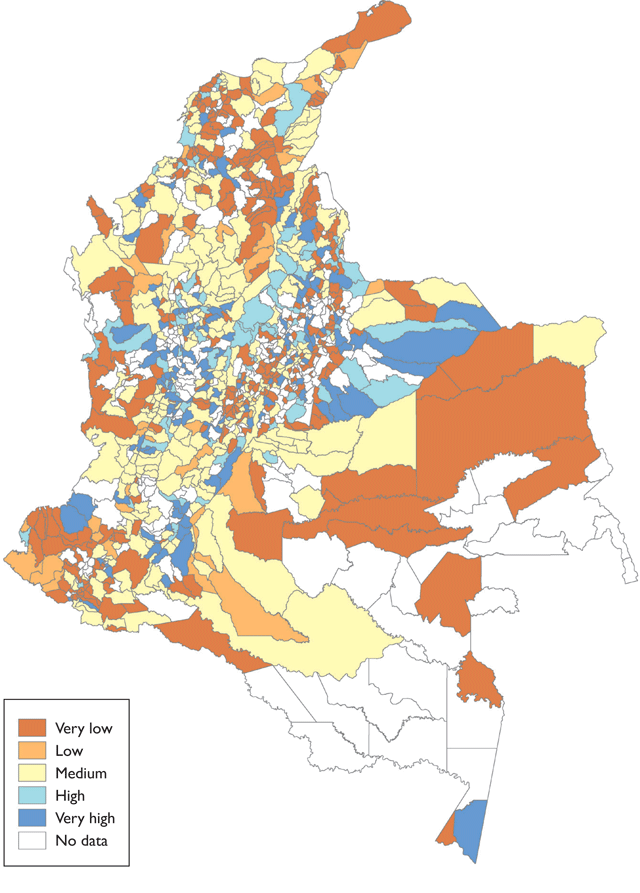
Map 3
Efficacy. Source: AGO (Fiscalía General de la Nación). Authors’ own calculations.
Table 1
Municipalities by levels of local justice performance.
| Level | Number of municipalities | % Municipalities |
|---|---|---|
| Very low | 136 | 16% |
| Low | 239 | 28% |
| Medium | 356 | 42% |
| High | 97 | 11 % |
| Very high | 20 | 2 % |
| Total | 848 | 100 % |
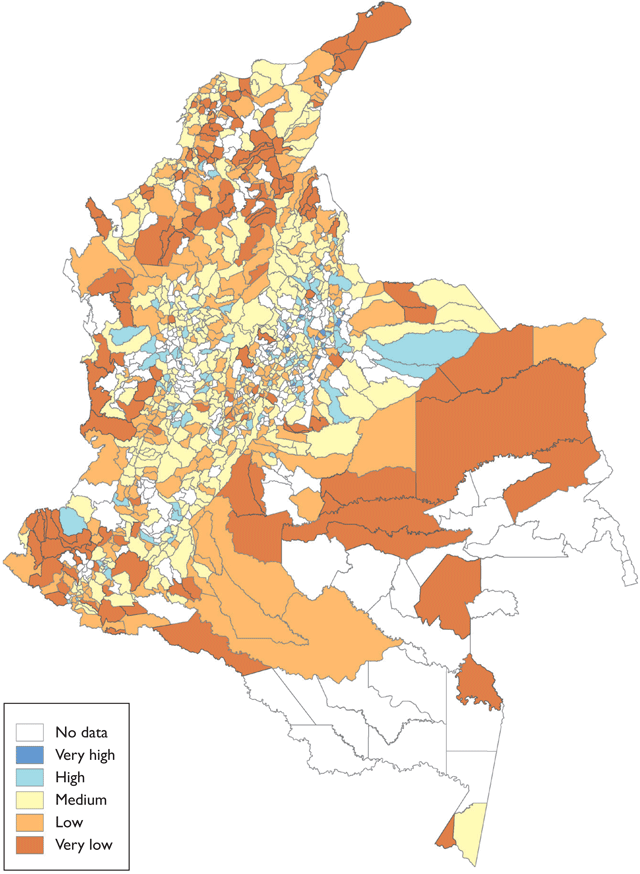
Map 4
Local justice performance. Source: SJC/AGO, own calculations.
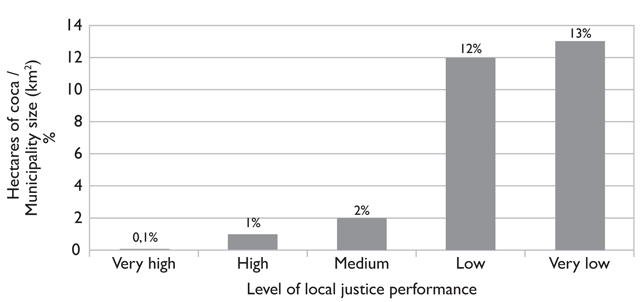
Graph 1
Density of crops and levels of local justice performance. Source: SIMCI 2012; Authors’calculations.
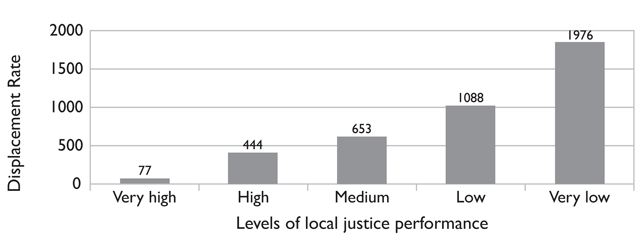
Graph 2
Average displacement rate by categories of local justice performance. Source: Vice President’s Office 2005–2011. Authors’ calculations.
Table 2
Presence of illegal armed groups broken down in years between 2000 and 2012.
| Category of justice | Number of years with illegal groups presence 2000–2012 | ||
|---|---|---|---|
| Guerrilla | Paramilitaries (2000–2006) | BACRIM (2007–2012) | |
| Very high | 1.3 | 0 | 0 |
| High | 2.9 | 1.03 | 1.8 |
| Medium | 4.2 | 1.68 | 2.69 |
| Low | 5.3 | 1.66 | 2.3 |
| Very low | 5.1 | 1.4 | 2.3 |
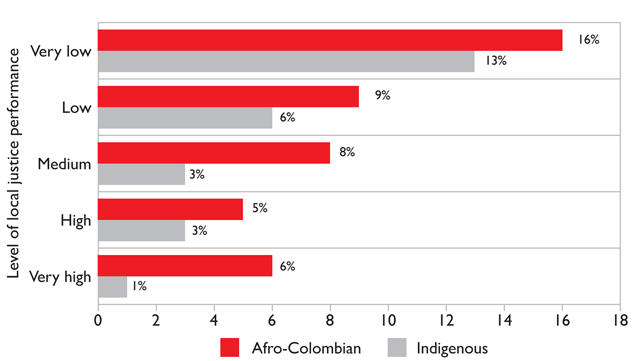
Graph 3
Percentage of Afro-Colombians and indigenous people by municipality by category of local justice performance. Source: Dane 2012. Authors’ calculations.