
Table 1
Sri Lanka’s Public Finances (2011–2014). Source: IMF 2014b.
| Preliminary | Projected | |||
|---|---|---|---|---|
| Public Finances (as per cent of GDP) | 2011 | 2012 | 2013 | 2014 |
| Revenue | 14.3 | 13.0 | 12.2 | 13.1 |
| Grants | 0.2 | 0.2 | 0.2 | 0.3 |
| Expenditure | 21.4 | 19.7 | 18.3 | 18.7 |
| Central Government Balance | - 6.9 | - 6.5 | - 5.9 | - 5.2 |
| Central Government Domestic Financing | 3.5 | 2.7 | 4.6 | 1.8 |
| Government Debt (domestic and external) | 78.5 | 79.2 | 78.3 | 76.8 |
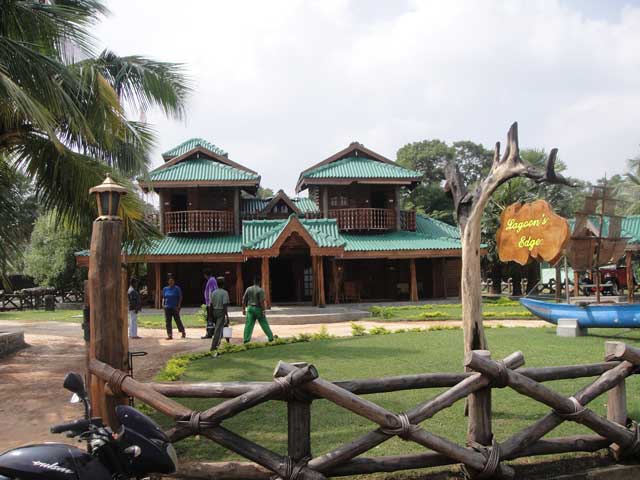
Figure 1
Lagoon’s Edge Resort near Wadduwakal Causeway. Source: Author photo (2013).
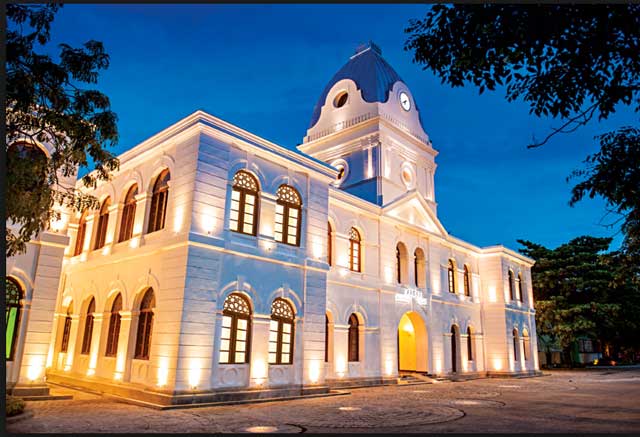
Figure 2
Arcade at Independence Square in Colombo. Source: Colombo Gazette (2014).
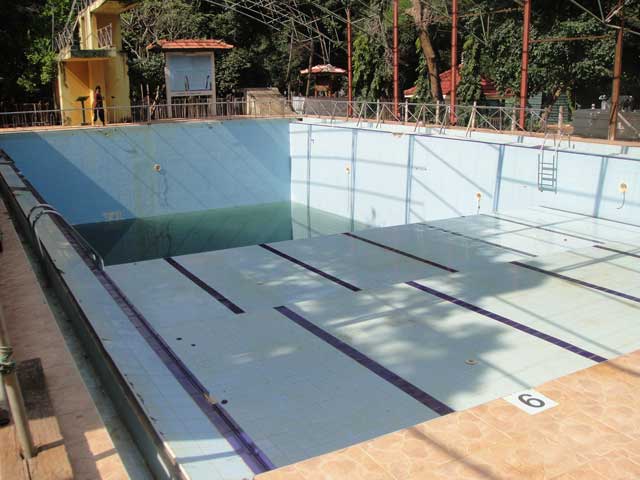
Figure 3
‘Terrorist Swimming Pool’. Source: Author photo (2013).
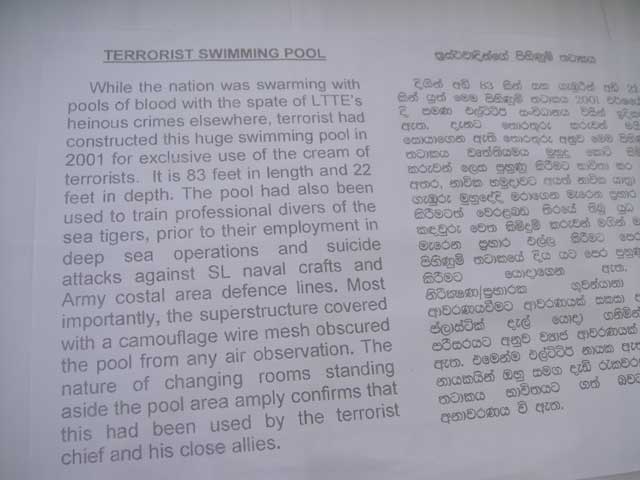
Figure 4
Text accompanying the swimming pool. Source: Author photo (2013).