
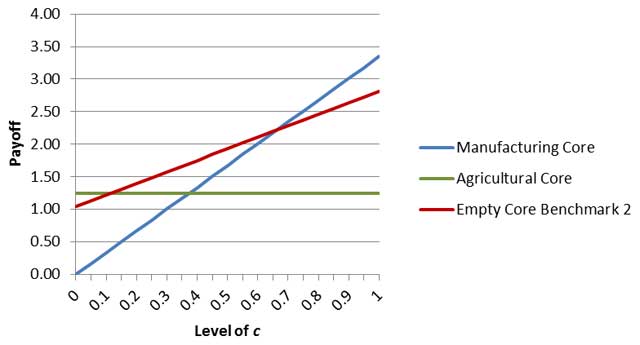
Figure 1
Stable and unstable economies as a function of rising industrial efficiency under mixed (increasing for industry, decreasing for agriculture) returns to scale. L = 1, R = 2, a = 0.5, p = 0.5, α = 1.1, β = 0.2.
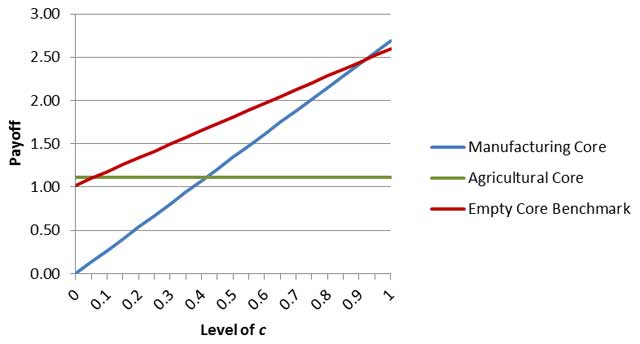
Figure 2
Stable and unstable economies as a function of rising industrial efficiency under decreasing returns to scale. L = 1, R = 2, a = 0.5, p = 0.5, α = 0.9, β = 0.1.
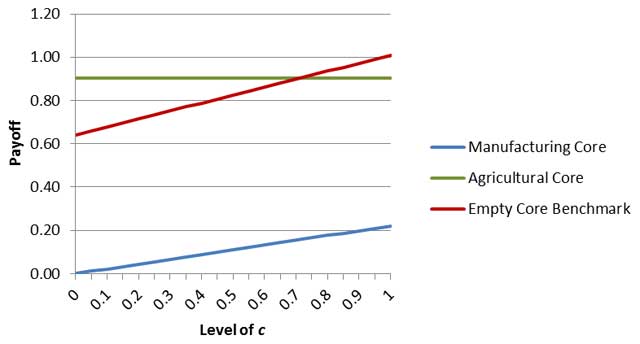
Figure 3
Stable and unstable economies as a function of rising industrial efficiency under negative returns to scale. L = 1, R = 5, a = 0.5, p = 0.5, α = –0.75, β = –0.05.
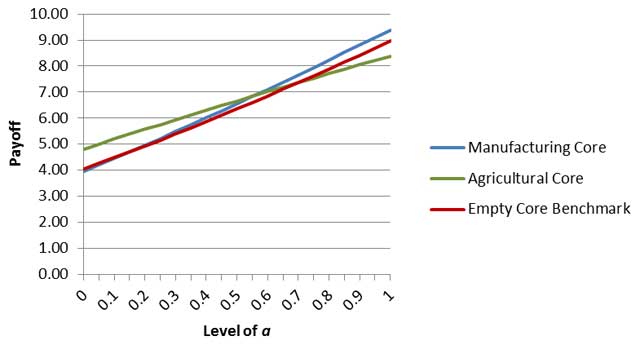
Figure 4
Stable and unstable economies as a function of growing industrial assets under mixed (increasing for industry, decreasing for agriculture) returns to scale. C = 1, L = 2, R = 3, p = 0.5, α = 1.25, β = 0.75.
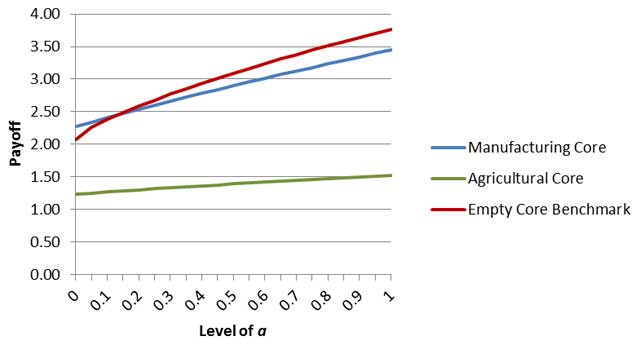
Figure 5
Stable and unstable economies as a function of growing industrial assets under decreasing, and returns to scale. C = 1.5, L = 1, R = 2, p = 0.5, α = 0.6, β = 0.3.
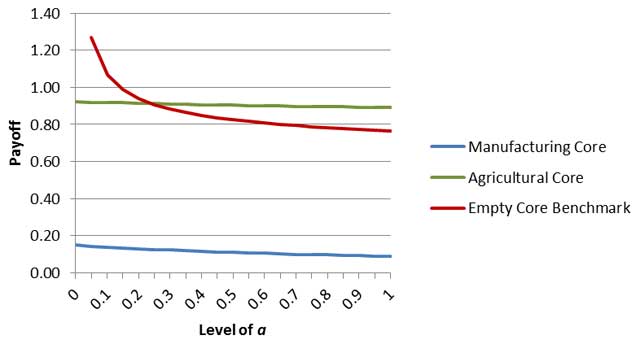
Figure 6
Stable and unstable economies as a function of growing industrial assets under negative returns to scale. C = 0.5, L = 1, R = 5, p = 0.5, α = –0.75, β = –.05.
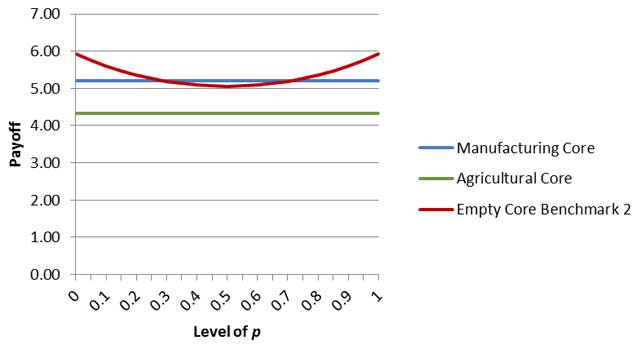
Figure 7
Stable and unstable economies as a function of farmer inequality under mixed (increasing for industry, decreasing for agriculture) returns to scale. Perfect equality is denoted by p = 0.5. C = 1, L = 2.5, R = 2, a = 0.5, α = 2, β = 0.5.
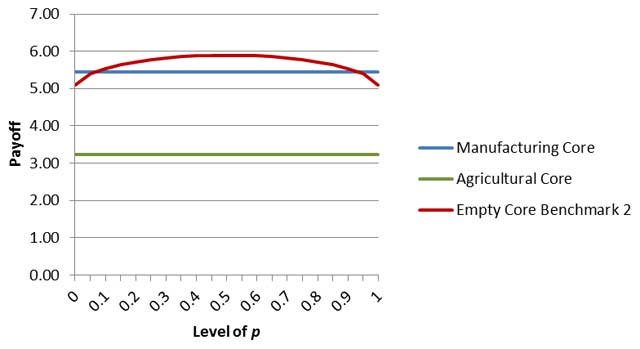
Figure 8
Stable and unstable economies as a function of farmer inequality under decreasing returns to scale. Perfect equality is denoted by p = 0.5. C = 3, L = 2, R = 3, a = 0.1, α = 0.5, β = 0.4.
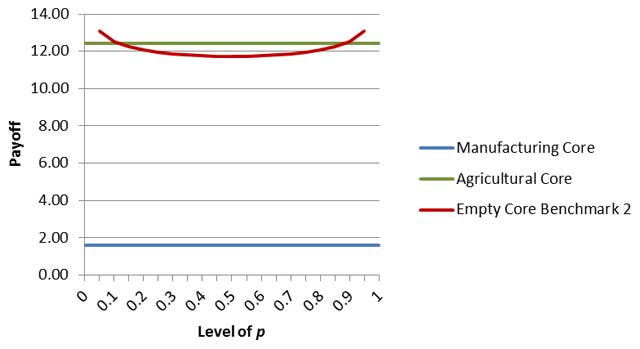
Figure 9
Stable and unstable economies as a function of farmer inequality under negative returns to scale. Perfect equality is denoted by p = 0.5. C = 1, L = 3, R = 0.1, a = 0.5, α = –0.25, β = –0.75.
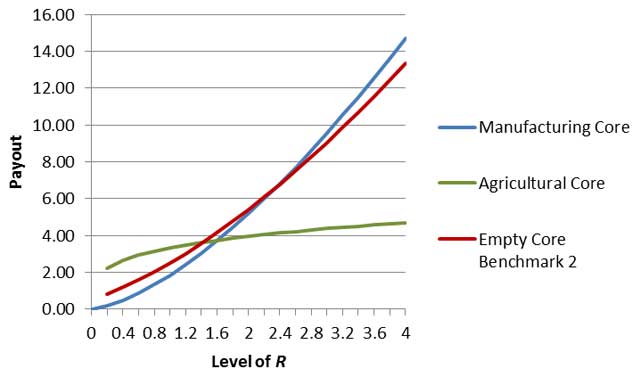
Figure 10
Stable and unstable economies as a function of resource levels (R) under mixed (increasing for industry, decreasing for agriculture) returns to scale. Perfect equality is denoted by p = 0.5. C = 1, L = 3, a = 0.5, p = 0.5, α = 1.5, β = 0.25.
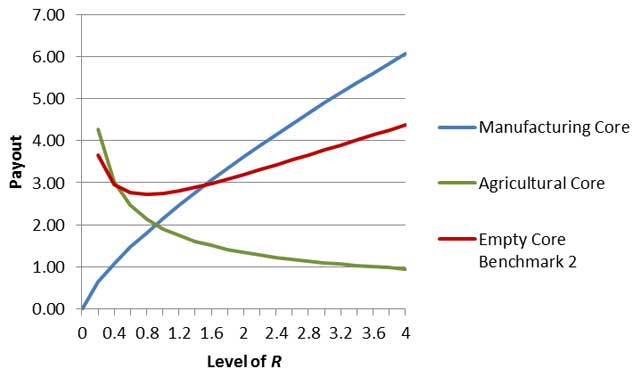
Figure 11
Stable and unstable economies as a function of resource levels (R) under decreasing returns to scale. Perfect equality is denoted by p = 0.5. C = 2, L = 2, a = 0.1, p = 0.3, α = 0.9, β = 0.3.
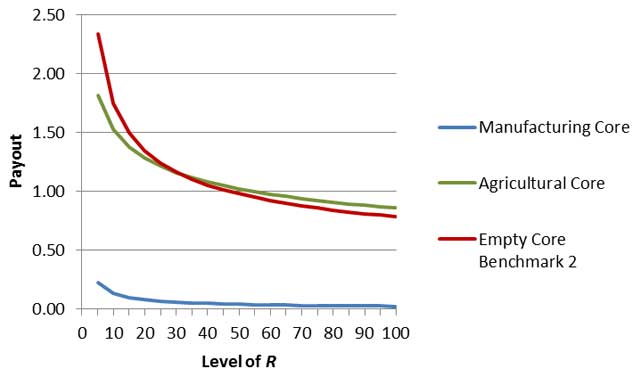
Figure 12
Stable and unstable economies as a function of resource levels (R) under negative returns to scale. Perfect equality is denoted by p = 0.5. C = 1, L = 3, a = 0.5, p = 0.5, α = –0.75, β = –0.25.