
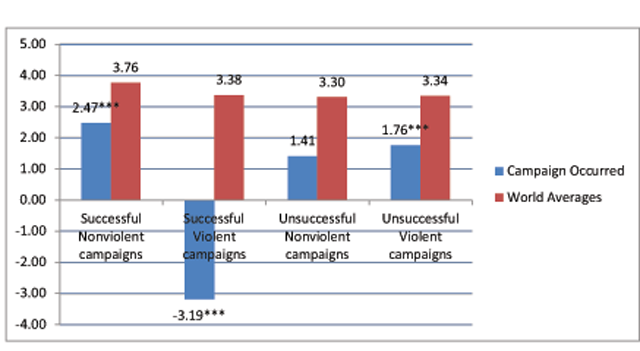
Figure 1
Predicted changes in years of life expectancy from birth, five years after the campaign ended compared to world averages.
Note: Predicted changes in years of Life Expectancy by transition type, five years after the campaign ended holding pre-campaign Life Exp. constant at the Mean. Squared Multiple R=0.833, *** p<0.01, N=74, Tolerance > 10% in all bars. All campaigns < two years in duration.
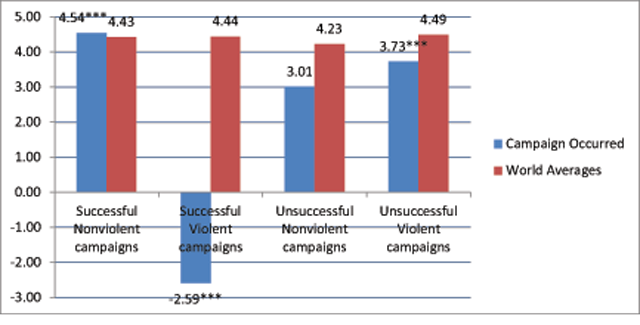
Figure 2
Predicted changes in years of life expectancy from birth, ten years after the campaign ended compared to world averages.
Note: Predicted changes in years of Life Expectancy by transition type, ten years after the campaign ended holding pre-campaign Life Exp. constant at the Mean. Squared Multiple R=0.791, *** p<0.01, N=67, Tolerance > 10% for all bars. All campaigns < two years in duration.