
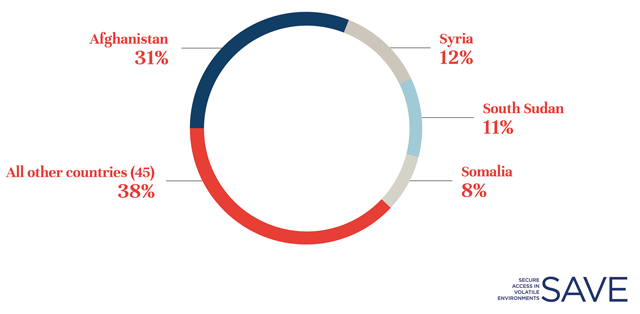
Figure 1
Attacks on aid workers in case-study countries relative to total, 2011–2014. Source: Humanitarian Outcomes 2015b, Aid Worker Security Database, aidworkersecurity.org.
Table 1
Summary statistics.
| Variable | Mean | Std. Dev. | Min. | Max. | N |
|---|---|---|---|---|---|
| Organizations | 14.38 | 17.41 | 1 | 110 | 367 |
| Projects | 49.50 | 61.69 | 1 | 371 | 235 |
| Personnel | 469.76 | 1323.54 | 1 | 10637 | 193 |
| Population In Need Estimates (Per 100,000) | 1.85 | 2.37 | 0 | 25.75 | 518 |
| AWSD Incidents | 1.34 | 2.11 | 0 | 15 | 518 |
| GTD Incidents | 23.39 | 35.44 | 0 | 336 | 371 |
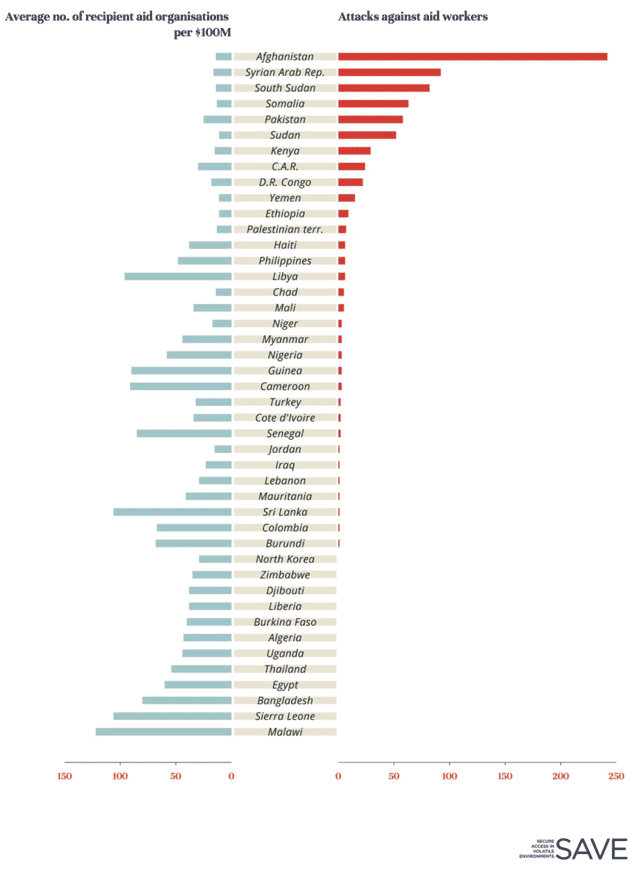
Figure 2
Comparison of emergency responses by insecurity and presence, 2011–2014. Sources: Aid Worker Security Database (aidworkersecurity.org) and FTS (fts.unocha.org).
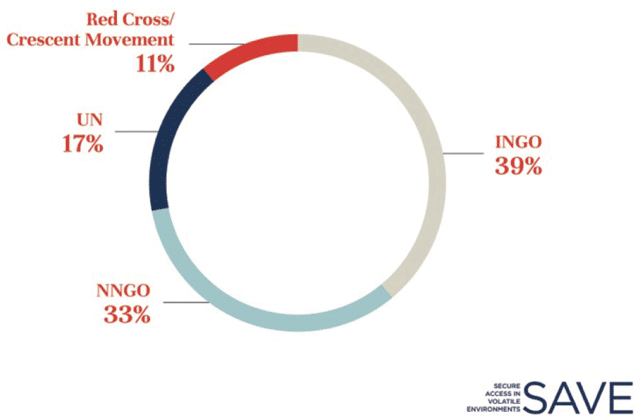
Figure 3
Most present humanitarian actors.
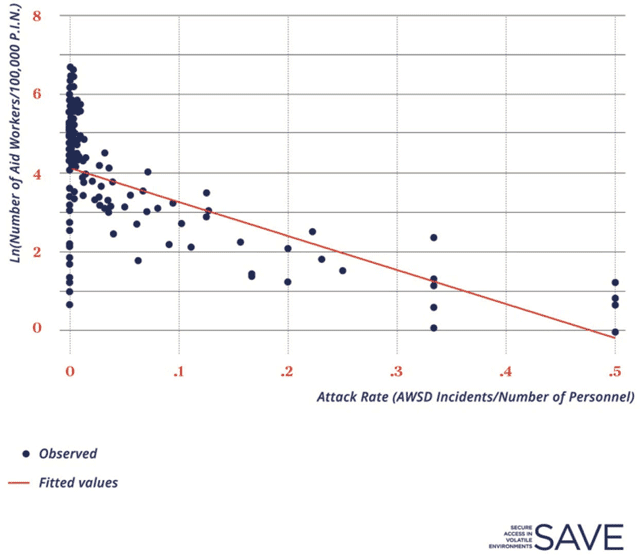
Figure 4
Humanitarian coverage and aid worker attack rates.
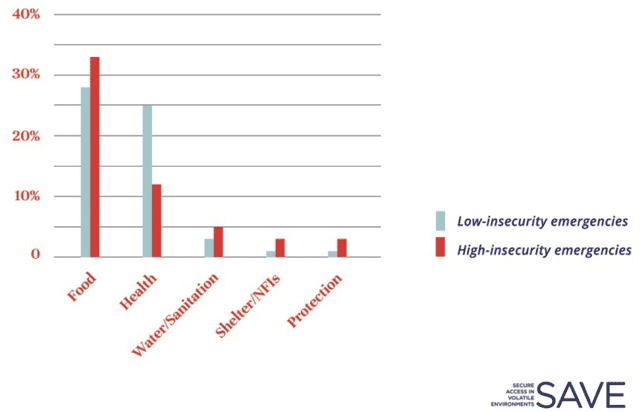
Figure 5
Funding by sector as a percentage of total contributions, 2011–2014.
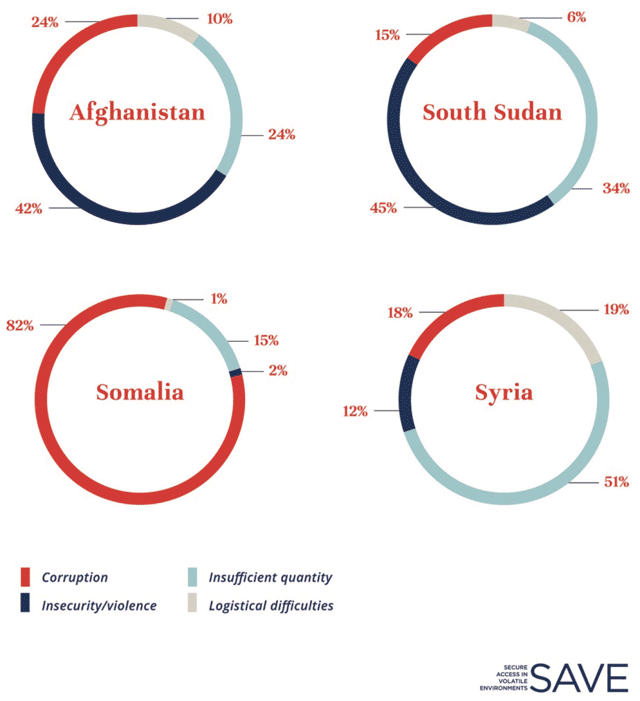
Figure 6
Perceptions of biggest obstacles to aid in the four countries.
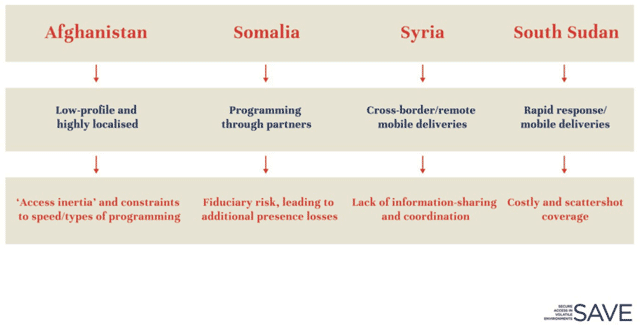
Figure 7
Prevailing operational models in the four contexts.
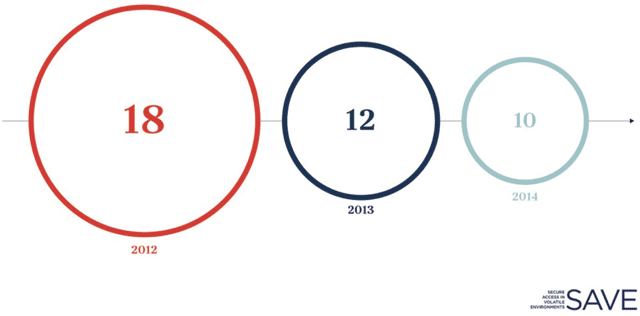
Figure 8
Declining district presence of humanitarian organizations in Afghanistan.
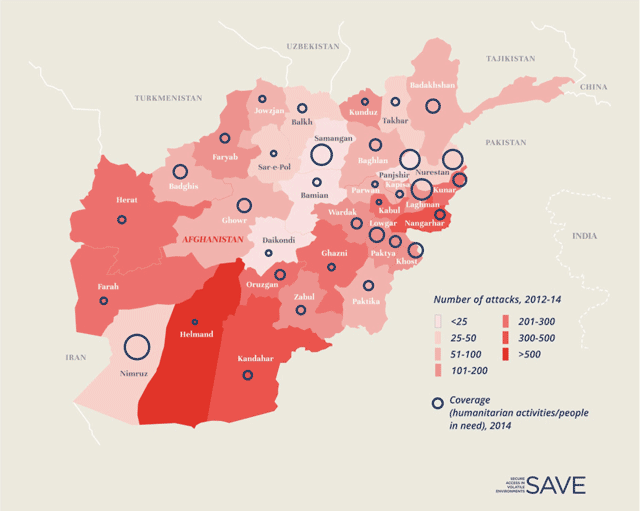
Map 1
Insecurity and humanitarian coverage in Afghanistan, 2014.
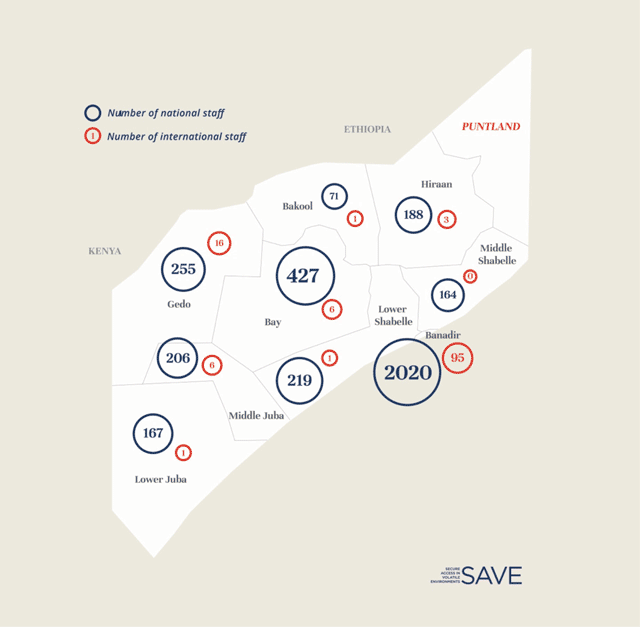
Map 2
South Central Somalia NGO (international and national) presence per region, 2014.
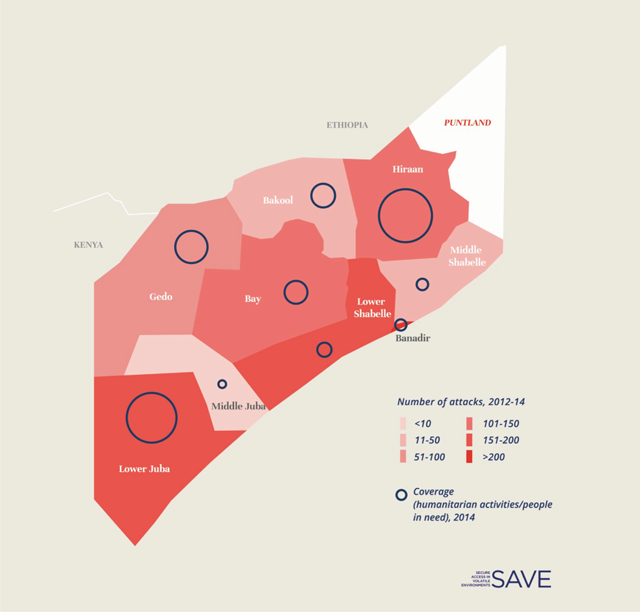
Map 3
Insecurity and humanitarian coverage in South Central Somalia, 2014.
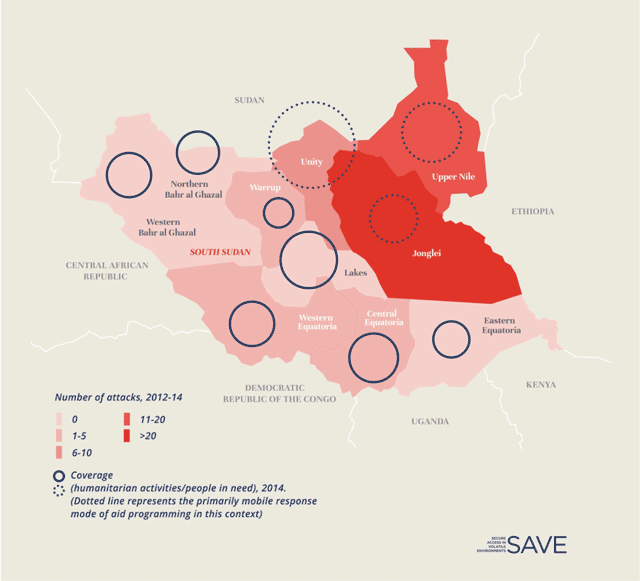
Map 4
Insecurity and humanitarian coverage in South Sudan, 2014.
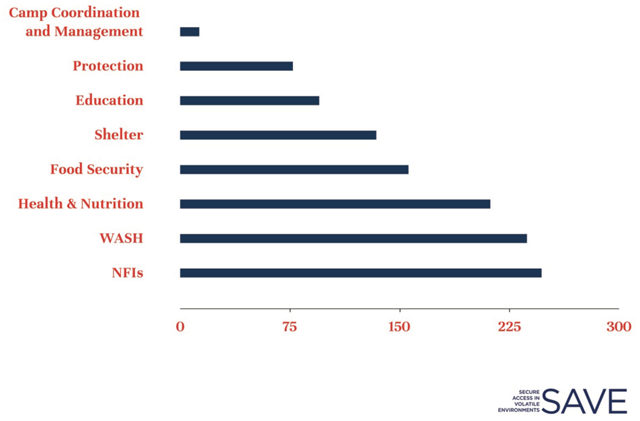
Figure 9
Aid activities reported by sector in Syria, 2014.
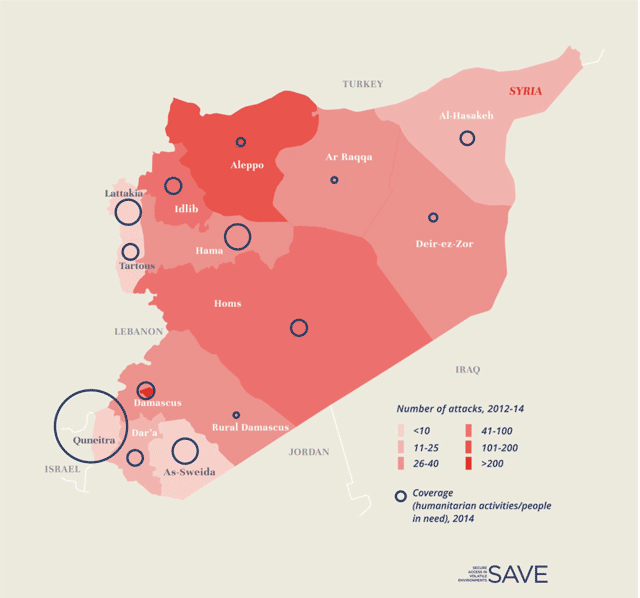
Map 5
Insecurity and humanitarian coverage in Syria, 2014.