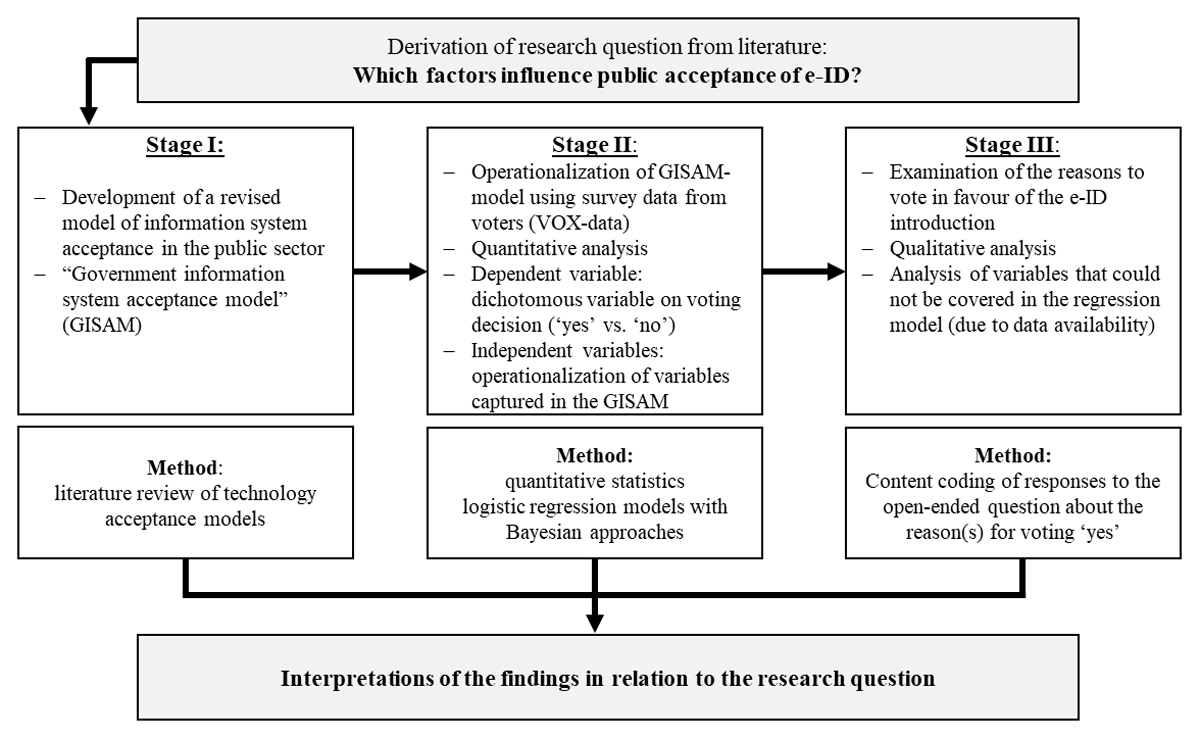
Figure 1
Government information system acceptance model (GISAM).
Table 1
National results on the electronic identity compared to the sample results.
| NATIONAL RESULTS | SAMPLE RESULTS | |
|---|---|---|
| per cent (N) | per cent (N) | |
| “Yes” votes | 36% | 36% |
| “No” votes | 64% | 64% |
| Total N | 2,762,625 | 2,092 |
[i] Source: Own representation; data for the national results from the Swiss Confederation, Federal Chancellery.
Table 2
Voter acceptance determinants of electronic proof of identity.
| DIMENSION | DETERMINANTS | MODEL 1 | CI | ||
|---|---|---|---|---|---|
| MEAN | S.D. | 2.5% | 97.5% | ||
| Individual socio-demographic characteristics | Constant | 7.398 | 5.163 | –5.949 | 16.716 |
| Age | –0.003 | 0.003 | –0.008 | 0.004 | |
| Gender (ref. male) | –0.190 | 0.168 | –0.519 | 0.140 | |
| Education level low (ref. medium) | 0.604 | 0.305 | 0.003 | 1.199 | |
| Education level high (ref. medium) | 0.124 | 0.185 | –0.238 | 0.490 | |
| Individual competencies and values | Subjective norms related to digitisation | 0.064 | 0.063 | –0.059 | 0.185 |
| Digital literacy/Attitude towards digitisation | –0.459 | 0.063 | –0.562 | –0.337 | |
| Attitudes towards information system characteristics | Perceived risks | –1.053 | 0.118 | –1.282 | –0.823 |
| Trust and political orientation | Trust in government | 0.026 | 0.046 | –0.065 | 0.116 |
| Trust in private businesses | 0.506 | 0.041 | 0.428 | 0.588 | |
| Political orientation | 0.160 | 0.049 | 0.064 | 0.256 | |
| Political interest | –0.125 | 0.133 | –0.390 | 0.132 | |
| DIC: | 1007.298 | ||||
[i] Notes: Dependent variable is the voting decision at the ballot (dichotomous variable “yes/no”). Models ran with MLwiN 3.02 through MCMC estimation. DIC = deviance information criterion. Bold: 95%-credible interval does not contain zero (systematic relationship). Logit-model; posterior mean, standard deviations (S.D.) and 95% credible interval of log odds, based on Bayesian estimation (100,000 iterations, burn-in: 500, thinning: 1).
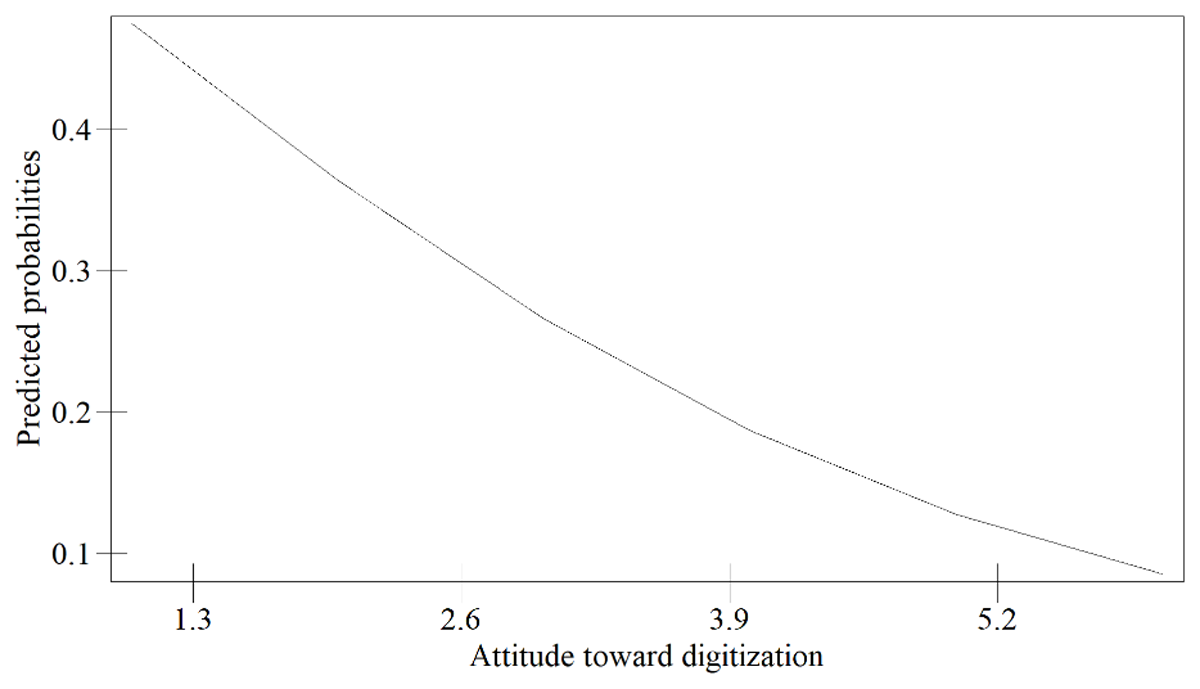
Figure 2
Attitude toward digitisation and probability of voting “yes”.
Note: Agreement on a scale between “digitisation networks society and simplifies life” (= 1) or “digitisation promotes anonymity and brings social problems” (= 6).
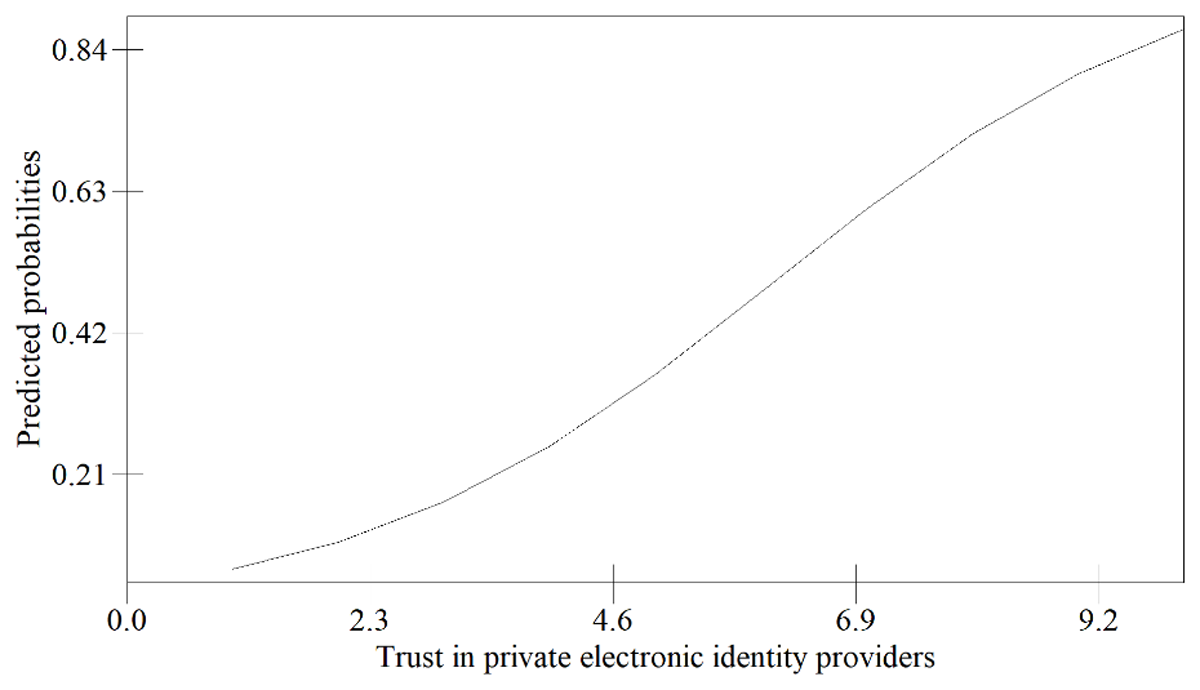
Figure 3
Trust in private electronic identity providers and probability of voting “yes”.
Note: Self-rating trust in private providers of digital ID cards on a scale between no trust at all (=0) and complete trust (=10)
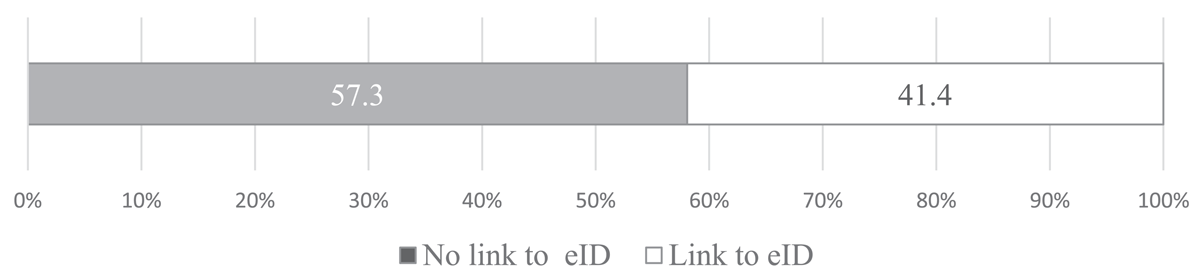
Figure 4
Coding results for a link between reason to accept and e-ID.
Note: Bars represent percentages (N = 497).
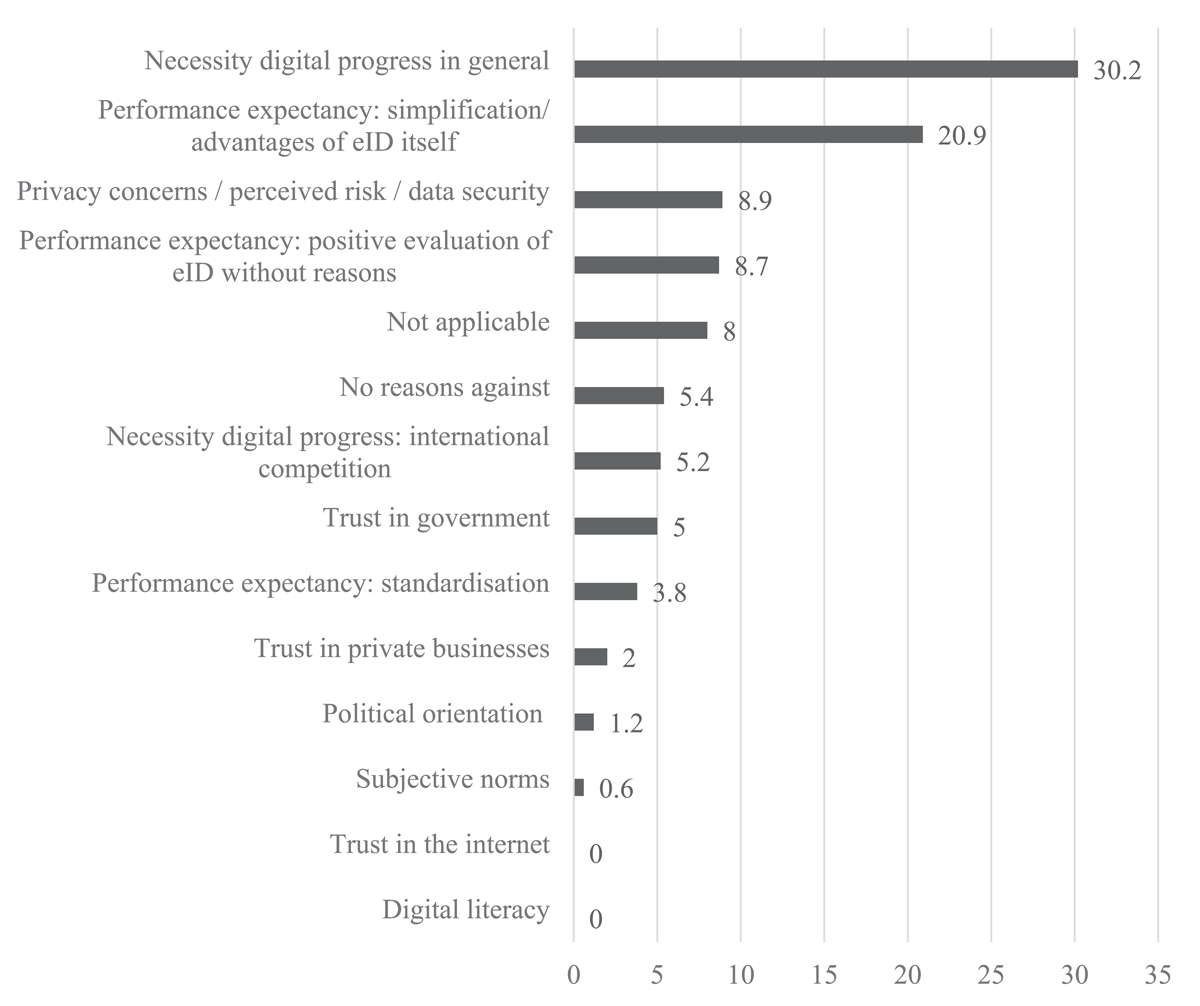
Figure 5
Coding results of reasons for accepting e-ID.
Note: Bars represent percentages. The question read: “What was the main reason you accepted the proposal for the Federal Act on Electronic Identification Services (e-ID Act)? (N = 497).
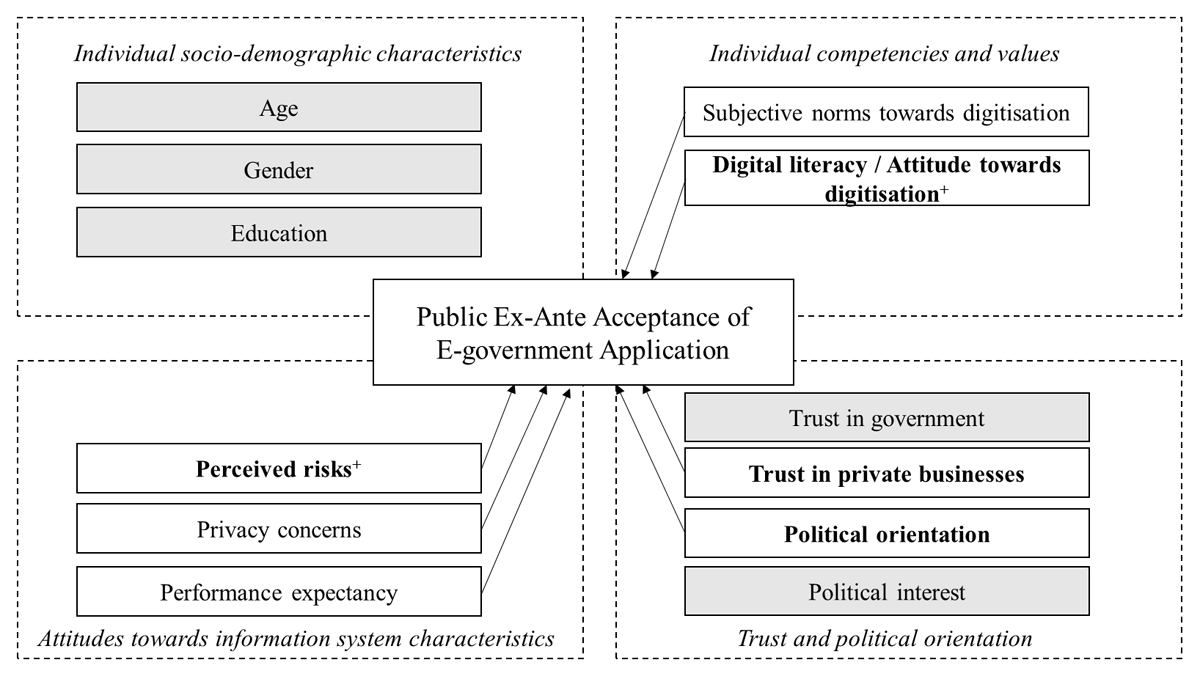
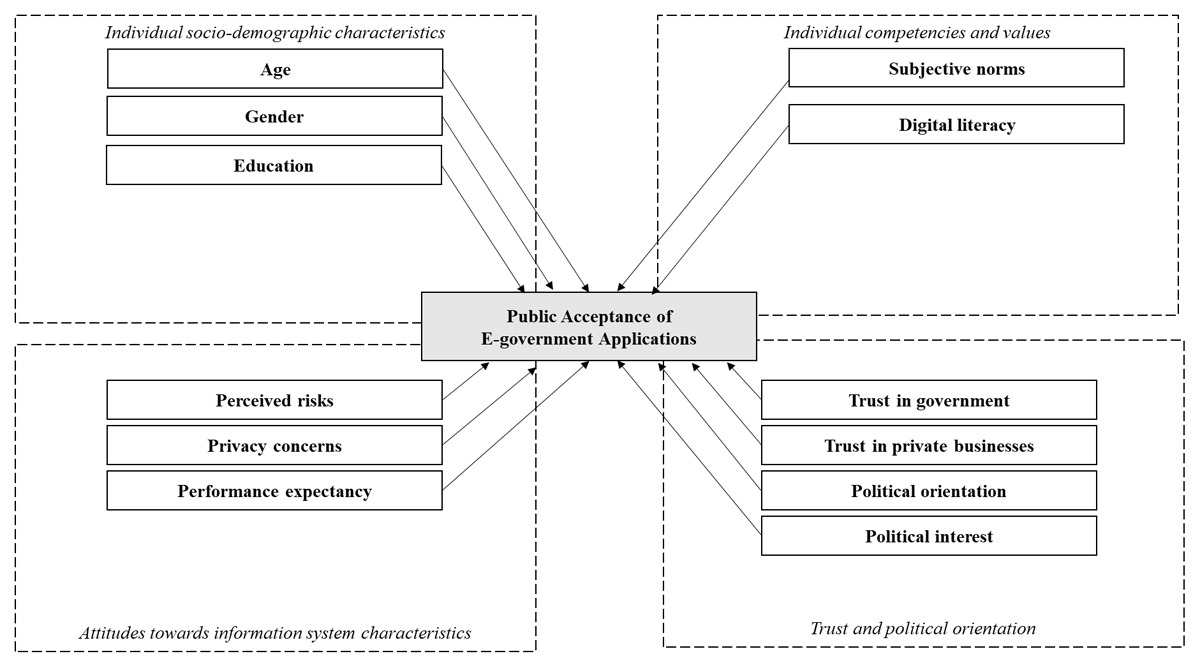
Figure 6
Factors from the GISAM impacting the public acceptance of e-government applications.
Note: Factors that produced systematic results in the quantitative analysis are shown in white boxes and in bold font. Factors from the qualitative analysis are shown in white boxes and in regular font. Factors showing influences in both analyses are marked by +. No influence could be detected for the factors in grey boxes.
| VARIABLE | OPERATIONALISATION | SUMMARY STATISTICS | |
|---|---|---|---|
| Voting decision | Dummy: 0 = Accept proposal 1 = Reject proposal | Shares(N): Yes: 36 (753) No: 64 (1339) (Total N: 2092) | |
| Individual socio-demographic characteristics | Age | Year of birth | Average (SD): 1967 (17.3) Minimum: 1939 Maximum: 2003 (Total N: 2092) |
| Gender | Dummy: 1 = Male 0 = Female | Shares(N): Male:49.0 (1026) Female: 50.3 (1052) (Total N: 2078) | |
| Education | 0 = Low level of education (no completed school education/primary school, compulsory school transitional education, general education without baccalaureate) 1 = Low level of education (no completed school education/primary school, compulsory school, transitional education, general education without baccalaureate) 2 = Medium level of education (Basic vocational training or apprenticeship, baccalaureate or teacher training seminar, post-secondary non-tertiary level, higher vocational training with federal certificate of proficiency, master craftsman diploma) 3 = High level of education (University of applied sciences, university, PhD, Habilitation) | Shares(N): Low: 9.8 (206) Medium: 59 (1234) High: 27.8 (581) (Total N: 2021) | |
| Individual competencies and values | Digital literacy/Attitude towards digitisation | Agreement to a scale between “digitisation connects society and simplifies life (= 1) and digitisation promotes anonymity and brings social problems (= 6).” | Average (SD): 3.26 (1.57) Minimum: 1 Maximum: 6 (Total N: 1925) |
| Subjective norms towards digitisation | Agreement to a scale between “Switzerland that goes with the spirit of the times (= 1) and a Switzerland that protects its traditions (= 6).” | Average (SD): 3.20 (1.61) Minimum: 1 Maximum: 6 (Total N: 2004) | |
| Information system characteristics | Perceived risks | Agreement on a scale between 1 (= not at all agree) and 4 (= fully agree) with the statement, “the use of the e-ID is recorded at a private company and stored centrally. This creates a potential for fraud.” | Average (SD): 3.08 (0.86) Minimum: 1 Maximum: 4 (Total N: 1846) |
| Trust and political orientation | Trust in government | Self-rating trust in government on a scale between no trust at all (= 0) and complete trust (= 10) | Average (SD): 6.95(2.22) Minimum: 0 Maximum: 10 (Total N: 2041) |
| Trust in private businesses | Self-rating trust in private providers of digital ID cards on a scale between no trust at all (= 0) and complete trust (= 10) | Average (SD): 3.34 (2.68) Minimum: 0 Maximum: 10 (Total N: 1937) | |
| Political interest | Self-rating political interest as an answer to the question “How interested are you in politics in general?” on a scale between not interested at all (= 1) and very interested (= 4). | Average (SD): 3.03 (0.69) Minimum: 0 Maximum: 4 (Total N: 2082) | |
| Political orientation | Self-rating political orientation on a scale between far left (= 0) and far right (= 10) | Average (SD): 4.56 (1.98) Minimum: 0 Maximum: 10 (Total N: 1724) |
| ELIGIBLE TO VOTE | VOTES RECEIVED | VOTER TURNOUT | YES-VOTES | NO-VOTES | YES-VOTES (PER CENT) | NO-VOTES (PER CENT) |
|---|---|---|---|---|---|---|
| 5’496’858 | 2’819’201 | 51.29% | 984’574 | 1’778’196 | 35.6% | 64.4% |