
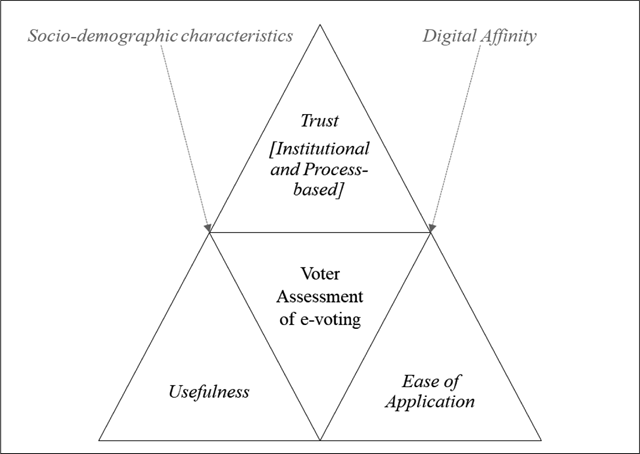
Figure 1
Schematic Model of Assessment Dimensions of e-voting systems by voters.
Table 1
Education and highest educational qualification of respondents.
| Education | Percent | N | Age | Percent | N |
|---|---|---|---|---|---|
| Mandatory school [no educational qualification] | 1 | 4 | 18–29 | 4 | 21 |
| Secondary level | 2 | 13 | 30–39 | 7 | 43 |
| Apprenticeship | 29 | 171 | 40–49 | 14 | 84 |
| High school diploma [Matura] | 12 | 68 | 50–59 | 24 | 144 |
| Bachelor | 19 | 114 | 60–69 | 27 | 158 |
| Master | 26 | 154 | 70–79 | 21 | 123 |
| PhD | 12 | 68 | 80–90+ | 3 | 20 |
| N = 592 | N = 593 |
Table 2
Approval of statements dealing with institutional trust and trust in e-voting systems.
| Statements addressing institutional trust and trust in e-voting processes | M | SD | N | |
|---|---|---|---|---|
| Institutional trust | The regulation of e-voting systems through the Swiss state is important for me. | 6.3 | 1.0 | 591 |
| The security of the e-voting procedure is ensured by the Swiss state. | 6.0 | 1.2 | 588 | |
| I consider the protection of data in e-voting as safe. | 5.8 | 1.3 | 591 | |
| I consider the Internet as a secure environment for e-voting. | 5.7 | 1.3 | 592 | |
| Process-based trust | E-Government simplifies the bureaucratic processes. | 6.0 | 1.4 | 574 |
| My experiences with e-government services are positive. | 5.6 | 1.4 | 570 | |
| Through my experience with e-government, I have more confidence in e-voting. | 5.2 | 1.6 | 570 | |
[i] Note: Scale represents the degree of respondents’ approval to statements on a scale between 1 (= entirely disagree) and 7 (= entirely agree).
Table 3
Correlations between trust and willingness to make use of e-voting systems.
| Variables capturing trust | Correlation with willingness to make use of e-voting systems | |||
|---|---|---|---|---|
| Institutional trust | The regulation of e-voting systems through the Swiss state is important for me. | r | .484 | *** |
| N | 272 | |||
| The security of the e-voting procedure is ensured through the Swiss state. | r | .483 | *** | |
| N | 270 | |||
| I consider the protection of data in e-voting as safe. | r | .495 | *** | |
| N | 268 | |||
| I consider the Internet as a secure environment for e-voting. | r | .246 | *** | |
| N | 270 | |||
| Process-based trust | E-Government simplifies the bureaucratic processes. | r | .317 | |
| N | 261 | |||
| My experiences with e-government services are positive. | r | .306 | *** | |
| N | 260 | |||
| Through my experience with e-government, I have more confidence in e-voting | r | .349 | *** | |
| N | 258 | |||
[i] Note: * p < .05, ** p < .01, *** p < .001, two tailed. r = Pearson product-moment correlation coefficient.
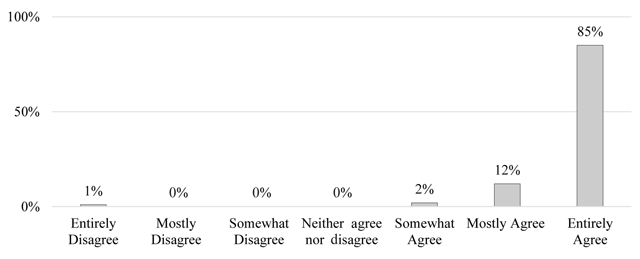
Figure 2
Agreement with the statement that e-voting is useful.
Note: Bars represent percentages, N = 356.
Table 4
Correlations between perceived usefulness and willingness to make use of e-voting systems.
| Variables capturing usefulness | Correlation with willingness to make use of e-voting systems | ||
|---|---|---|---|
| E-voting simplifies my voting process | r | .447 | *** |
| N | 226 | ||
| I think e-voting is useful | r | .554 | *** |
| N | 226 | ||
[i] Note: * p < .05, ** p < .01, *** p < .001, two tailed. r = Pearson product-moment correlation coefficient.
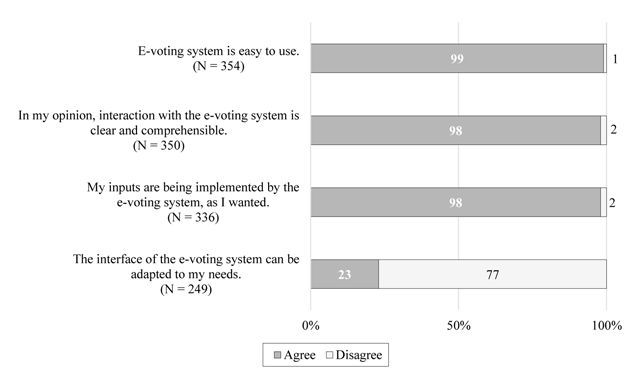
Figure 3
Perceived ease of use of e-voting systems.
Notes: Bars represent percentages.
Table 5
Correlations between ease of use and willingness to make use of e-voting systems.
| Variables capturing ease of use | Correlation with willingness to make use of e-voting systems | ||
|---|---|---|---|
| E-voting system is easy to use. | r | .374 | *** |
| N | 226 | ||
| In my opinion, interaction with the e-voting system is clear and comprehensible. | r | .555 | *** |
| N | 223 | ||
| My inputs are being implemented by the e-voting system, as I wanted. | r | .297 | *** |
| N | 221 | ||
| The interface of the e-voting system can be adapted to my needs. | r | .196 | ** |
| N | 223 | ||
[i] Note: * p < .05, ** p < .01, *** p < .001, two tailed. r = Pearson product-moment correlation coefficient.