
Table 1
Sample demographics.
| Gender | Male | 7 |
| Female | 3 | |
| Position | Cantonal govt. staff | 5 |
| Scientific advisor | 3 | |
| Federal govt. staff | 2 | |
| Area of Expertise* | Medicine | 4 |
| Computer Science | 4 | |
| Public Health | 2 | |
| Public Admin. / Management | 2 | |
| Epidemiology | 2 | |
| Law | 1 | |
| Number of interviewees | 10 | |
[i] *Interviewees can have expertise in multiple areas.
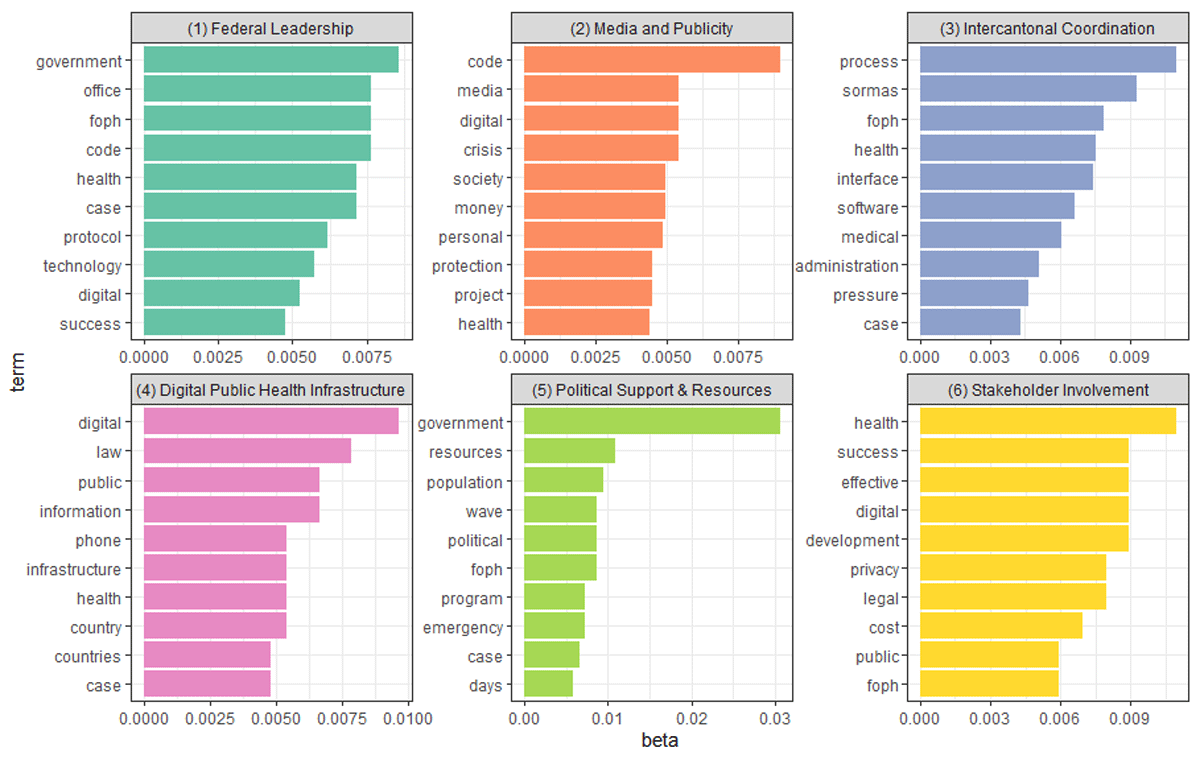
Figure 1
Overview of topics identified by the topic modeling algorithm. The y-axis of the graph shows the top 10 terms identified as part of each topic. Beta on the x-axis measures the relevance of each term to a topic.