
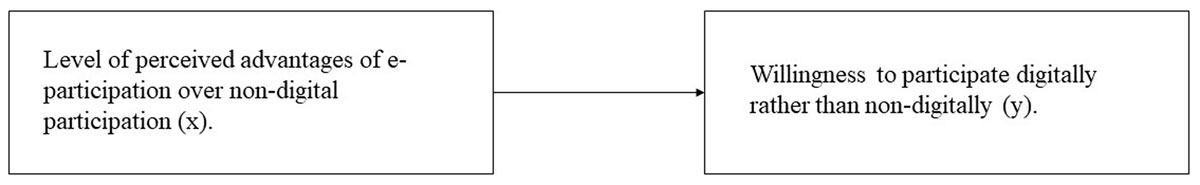
Figure 1
Influence of perceived advantages on the willingness to participate digitally (Zheng & Schachter 2017).
| Proposition 1: | If simplicity is perceived as an advantage of e-participation, the willingness to participate digitally increases. |
| Proposition 2: | If time saving is perceived as an advantage of e-participation, the willingness to participate digitally increases. |
| Proposition 3: | If independence of location is perceived as an advantage of e-participation, the willingness to participate digitally increases. |
| Proposition 4: | If cost reduction is perceived as an advantage of e-participation, the willingness to participate digitally increases. |
| Proposition 5: | If data protection is perceived as an advantage of non-digital participation, the willingness to participate non-digitally increases. |
| Proposition 6: | If data security is perceived as an advantage of non-digital participation, the willingness to participate non-digitally increases. |
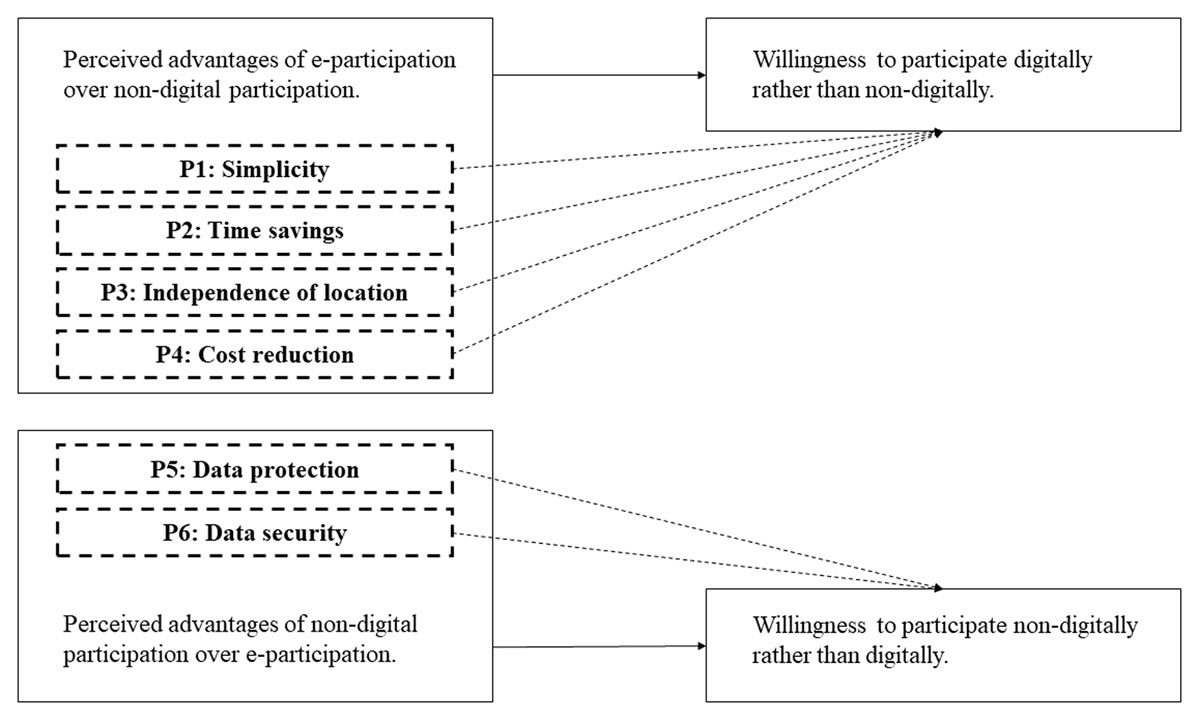
Figure 2
Analytical framework of this study.
Table 1
Variables.
| VARIABLE | CATEGORIES/RANGE | |
|---|---|---|
| Dependent variable | Willingness to participate | Model 1: (0) No, I would not participate digitally, (1) Yes, I would participate digitally. Model 2: (0) No, I would not participate non-digitally, (1) Yes, I would participate non-digitally. |
| Independent variable | Perceived advantage of e-participation or non-digital participation | Simplicity (1–7), time savings (1–7), independence of location (1–7), cost reduction (1–7), data security1 (1–7), data protection2 (1–7)* |
| Control variables | Age | 16–99 |
| Gender | (1) Male, (2) Female, (3) Other | |
| Education | (1) No education, (2) compulsory school, (3) vocational apprenticeship, (4) (vocational) Baccalaureate, (5) university degree | |
| Importance of participation Digitalisation as an opportunity Political interest | 1 (= do not agree at all) – 7 (= fully agree) 1 (= do not agree at all) – 7 (= fully agree) 1 (= not interested at all) – 7 (= very interested) |
[i] * 1 = do not agree at all, 7 = fully agree.
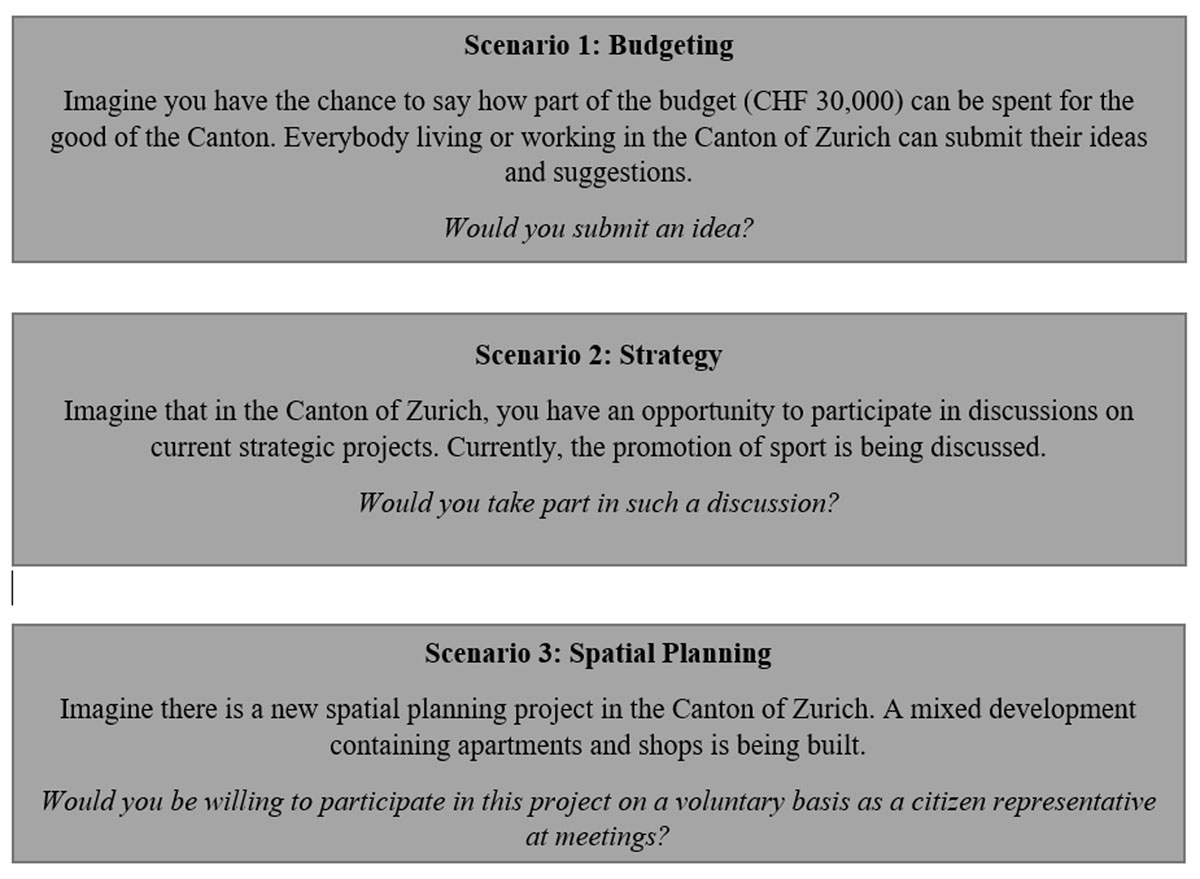
Figure 3
Three scenarios of citizen participation.
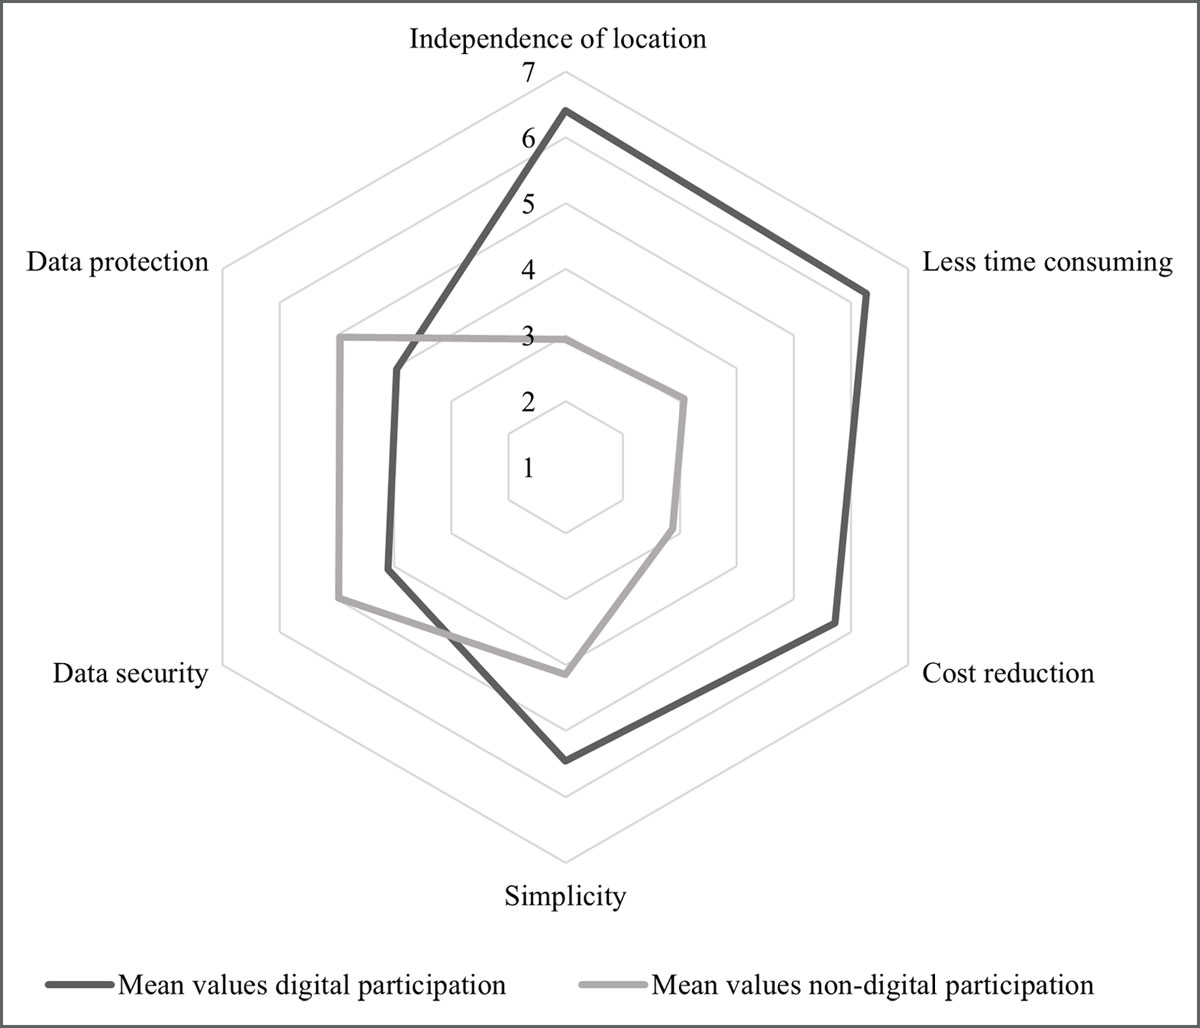
Figure 4
Advantages of digital and non-digital participation.
Table 2
Relationship between perceived advantages and willingness to participate (S1: Budget).
| DEPENDENT VARIABLE: WILLINGNESS TO PARTICIPATE | ||
|---|---|---|
| E-PARTICIPATION (1) | NON-DIGITAL PARTICIPATION (3) | |
| Simplicity | 0.38*** | –0.17* |
| (0.10) | (0.10) | |
| Time savings | –0.04 | 0.10 |
| (0.17) | (0.17) | |
| Independence of location | –0.12 | –0.10 |
| (0.13) | (0.12) | |
| Cost reduction | 0.16* | –0.03 |
| (0.09) | (0.10) | |
| Data protection | 0.01 | –0.18 |
| (0.11) | (0.13) | |
| Data security | 0.13 | –0.05 |
| (0.12) | (0.14) | |
| Age | –0.01 | 0.01 |
| (0.01) | (0.01) | |
| Gender [female] | –0.10 | 0.24 |
| (0.22) | (0.25) | |
| Education | ||
| Compulsory school | –0.13 | –0.93 |
| (0.55) | (0.61) | |
| Vocational apprenticeship | –0.23 | –0.17 |
| (0.62) | (0.64) | |
| (vocational) Baccalaureate | 0.002 | –0.69 |
| (0.53) | (0.57) | |
| University degree | –0.20* | 0.17 |
| (0.10) | (0.12) | |
| Political interest | –0.02 | –0.07 |
| (0.10) | (0.11) | |
| Importance of participation | 0.24*** | –0.01 |
| (0.08) | (0.09) | |
| Digitalisation as an opportunity | –2.20** | 0.36 |
| (1.03) | (1.01) | |
| Observations | 473 | 473 |
| Log Likelihood | –279.03 | –217.57 |
| Akaike Inf. Crit. | 588.06 | 465.15 |
[i] Note: * p < 0.1; ** p < 0.05; *** p < 0.01.
Table 3
Relationship between perceived advantages and willingness to participate (S2: Strategy).
| DEPENDENT VARIABLE: WILLINGNESS TO PARTICIPATE | ||
|---|---|---|
| E-PARTICIPATION (1) | NON-DIGITAL PARTICIPATION (2) | |
| Simplicity | 0.20** | –0.11 |
| (0.10) | (0.11) | |
| Time savings | 0.003 | 0.19 |
| (0.17) | (0.17) | |
| Independence of location | –0.07 | –0.04 |
| (0.13) | (0.13) | |
| Cost reduction | 0.26** | –0.17 |
| (0.10) | (0.10) | |
| Data protection | –0.08 | 0.01 |
| (0.12) | (0.13) | |
| Data security | 0.33*** | –0.35** |
| (0.12) | (0.14) | |
| Age | –0.01* | 0.02* |
| (0.01) | (0.01) | |
| Gender [female] | –0.50** | 0.43* |
| (0.23) | (0.25) | |
| Education | ||
| Compulsory school | 0.15 | –0.95 |
| (0.57) | (0.62) | |
| Vocational apprenticeship | –0.53 | –0.04 |
| (0.62) | (0.65) | |
| (vocational) Baccalaureate | 0.11 | –0.47 |
| (0.54) | (0.58) | |
| University degree | –0.11 | 0.06 |
| (0.11) | (0.12) | |
| Political interest | –0.04 | 0.002 |
| (0.10) | (0.11) | |
| Importance of participation | 0.23*** | –0.05 |
| (0.09) | (0.09) | |
| Digitalisation as an opportunity | –3.01*** | 0.41 |
| (1.10) | (1.02) | |
| Observations | 445 | 445 |
| Log Likelihood | –260.13 | –218.89 |
| Akaike Inf. Crit. | 550.25 | 467.78 |
[i] Note: * p < 0.1; ** p < 0.05; *** p < 0.01.
Table 4
Relationship between perceived advantages and willingness to participate (S3: Spatial planning).
| DEPENDENT VARIABLE: WILLINGNESS TO PARTICIPATE | ||
|---|---|---|
| E-PARTICIPATION (1) | NON-DIGITAL PARTICIPATION (2) | |
| Simplicity | 0.50*** | –0.13 |
| (0.13) | (0.10) | |
| Time savings | –0.21 | –0.01 |
| (0.20) | (0.17) | |
| Independence of location | –0.08 | 0.04 |
| (0.15) | (0.13) | |
| Cost Reduction | 0.32*** | –0.14 |
| (0.11) | (0.10) | |
| Data Protection | –0.01 | –0.11 |
| (0.13) | (0.12) | |
| Data Security | 0.23* | –0.09 |
| (0.13) | (0.13) | |
| Age | –0.01 | –0.004 |
| (0.01) | (0.01) | |
| Gender [female] | –0.60** | 0.23 |
| (0.24) | (0.23) | |
| Education | ||
| Compulsory school | –0.19 | –1.00 |
| (0.71) | (0.65) | |
| Vocational apprenticeship | –0.30 | –0.33 |
| (0.78) | (0.70) | |
| (vocational) Baccalaureate | –0.38 | –0.63 |
| (0.68) | (0.62) | |
| University degree | –0.13 | 0.21* |
| (0.12) | (0.12) | |
| Political interest | –0.13 | –0.06 |
| (0.11) | (0.11) | |
| Importance of participation | 0.20** | 0.09 |
| (0.09) | (0.09) | |
| Digitalisation as an opportunity | –3.06** | 0.88 |
| (1.25) | (1.01) | |
| Observations | 422 | 422 |
| Log Likelihood | –233.37 | –239.84 |
| Akaike Inf. Crit. | 496.74 | 509.67 |
[i] Note: * p < 0.1; ** p < 0.05; *** p < 0.01.
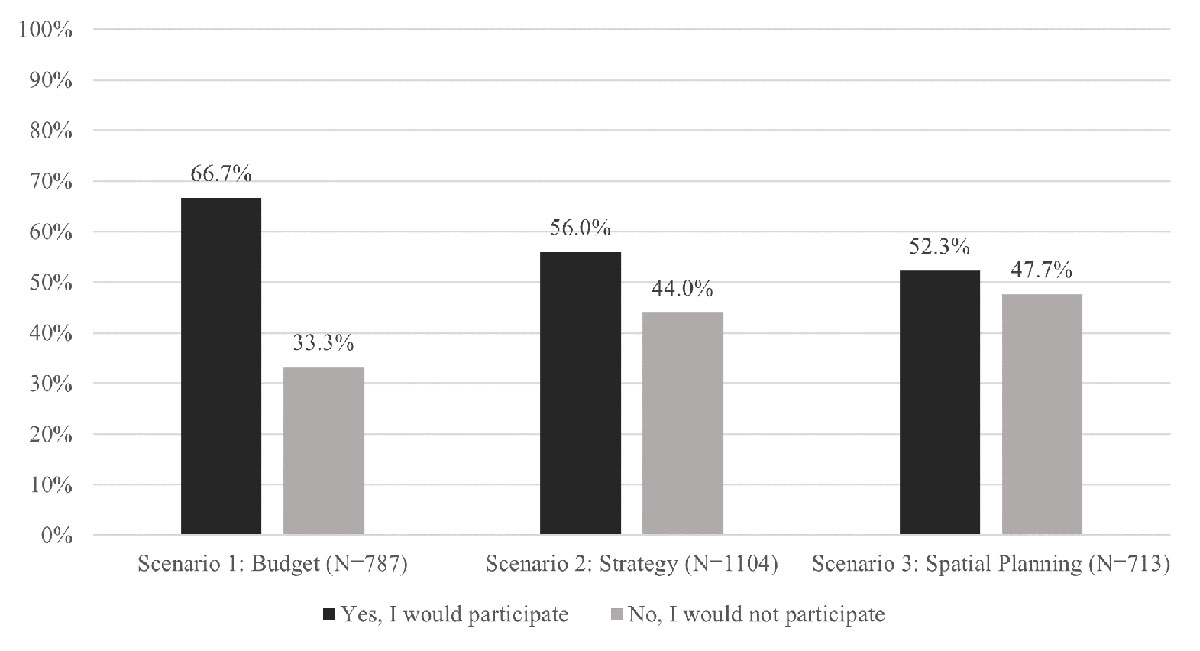
Figure 5
Distribution of the preferred form chosen by the participants for the three scenarios.