
Table 1
Summary of the questions in the questionnaire and descriptive data on the variables used.
| VARIABLE | QUESTION | OPTIONS | RESULT |
|---|---|---|---|
| Dependent Variable 1 | |||
| Vote Intention | In the 4 September election, will you vote to Approve or Reject the Constitutional Convention’s proposed new constitution? | Approve Reject No Vote, Don’t Know, No Answer (NV/DK/NA) | Approve = 31.3 Reject = 41.5 NV/DK/NA = 27.2 |
| Dependent Variable 2 | |||
| Contents of the Constitutional Proposal | Mean | ||
| Plurinationality | The proposed new constitution includes several reforms to the current form. On a scale of 1 to 5, where 1 = Strongly disagree, and 5 = Strongly agree, how much do you agree with recognising a plurinational country? | 5 = Strongly Agree/1 = Strongly disagree. The values were normalised on a scale from 0 to 100. | 46.0 |
| Gender parity | The proposed new constitution includes several reforms to the current form. On a scale of 1 to 5, where 1 = strongly disagree and 5 = strongly agree, how much do you agree with the promotingly? | 5 = Strongly Agree/1 = Strongly disagree. The values were normalised on a scale from 0 to 100. | 64.4 |
| Replacing the Senate | The proposed new constitution includes several reforms to the current form. On a scale of 1 to 5, where 1 = Strongly disagree, and 5 = Strongly agree, how much do you agree with replacing the Senate with the House of Regions? | 5 = Strongly Agree/1 = Strongly disagree. The values were normalised on a scale from 0 to 100. | 50.2 |
| Abortion | The proposed new constitution includes several reforms to the current form. On a scale of 1 to 5, where 1 = Strongly disagree, and 5 = Strongly agree, how much do you agree to establish the right to voluntary termination of pregnancy? | 5 = Strongly Agree/1 = Strongly disagree. The values were normalised on a scale from 0 to 100. | 49.5 |
| National Health System (NHS) | The proposed new constitution includes several reforms to the current form. On a scale of 1 to 5, where 1 = Strongly Disagree and 5 = Strongly Agree, how much do you agree with creating a universal, public and integrated National Health System? | 5 = Strongly Agree/1 = Strongly disagree. The values were normalised on a scale from 0 to 100. | 56.8 |
| Independent Variables | |||
| Political Variables | |||
| Ideological Identification | People generally classify their political positions as left, centre, and right. On a scale of 0 to 10, where 0 means that your political position is “completely to the left” and 10 means that your political position is “completely to the right,” where would you place yourself? | Scale from 0 to 10 | 5.1 |
| Presidential approval | Regardless of your political position, do you approve or disapprove of how Gabriel Boric conducts his government? | Approve Disapprove DK/NA | 25.1 44.9 30.0 |
| Religious Variables | |||
| Religion | Which religion or religious group do you feel closest to or most identified with? | Catholic Evangelical Other Agnostic No Religion | 39.6 10.9 9.5 8.6 31.4 |
| Frequency of attendance at religious services | How often do you attend mass or religious services at your church (not including baptisms, marriages or funerals)? | 0 = Never/5 = Very often | Mean = 2.0 |
| Socio-demographic variables | |||
| Socio-economic level | It is a question that measures people’s socioeconomic status. The highest income level is ABC1. It is followed by C2, C3, D and E, which are the poorest. | 5 = ABC1/0 = E. The values were normalised on a scale from 0 to 100. | Mean = 4.0 |
| Sex | ¿Are you? | 0 = Man 1 = Woman | 46.7 53.3 |
| Age | ¿How old are you? | Years | Mean = 44.3 |
| Area of residence | Corresponds to the area where each respondent lives. Chile is divided into 16 regions. The capital city – Santiago – is located in the Metropolitan Region. | 0 = Ohers Regions (OR) 1 = Metropolitan Region (MR) | OR = 58.1 MR = 41.9 |
[i] NV = No vote/NA = No Answer/DK = Do not know.
Source: Compiled with data from www.mepop.cl.

Figure 1
Voting intentions in the constitutional referendum, according to Religion.
Source: Compiled with data from www.mepop.cl.
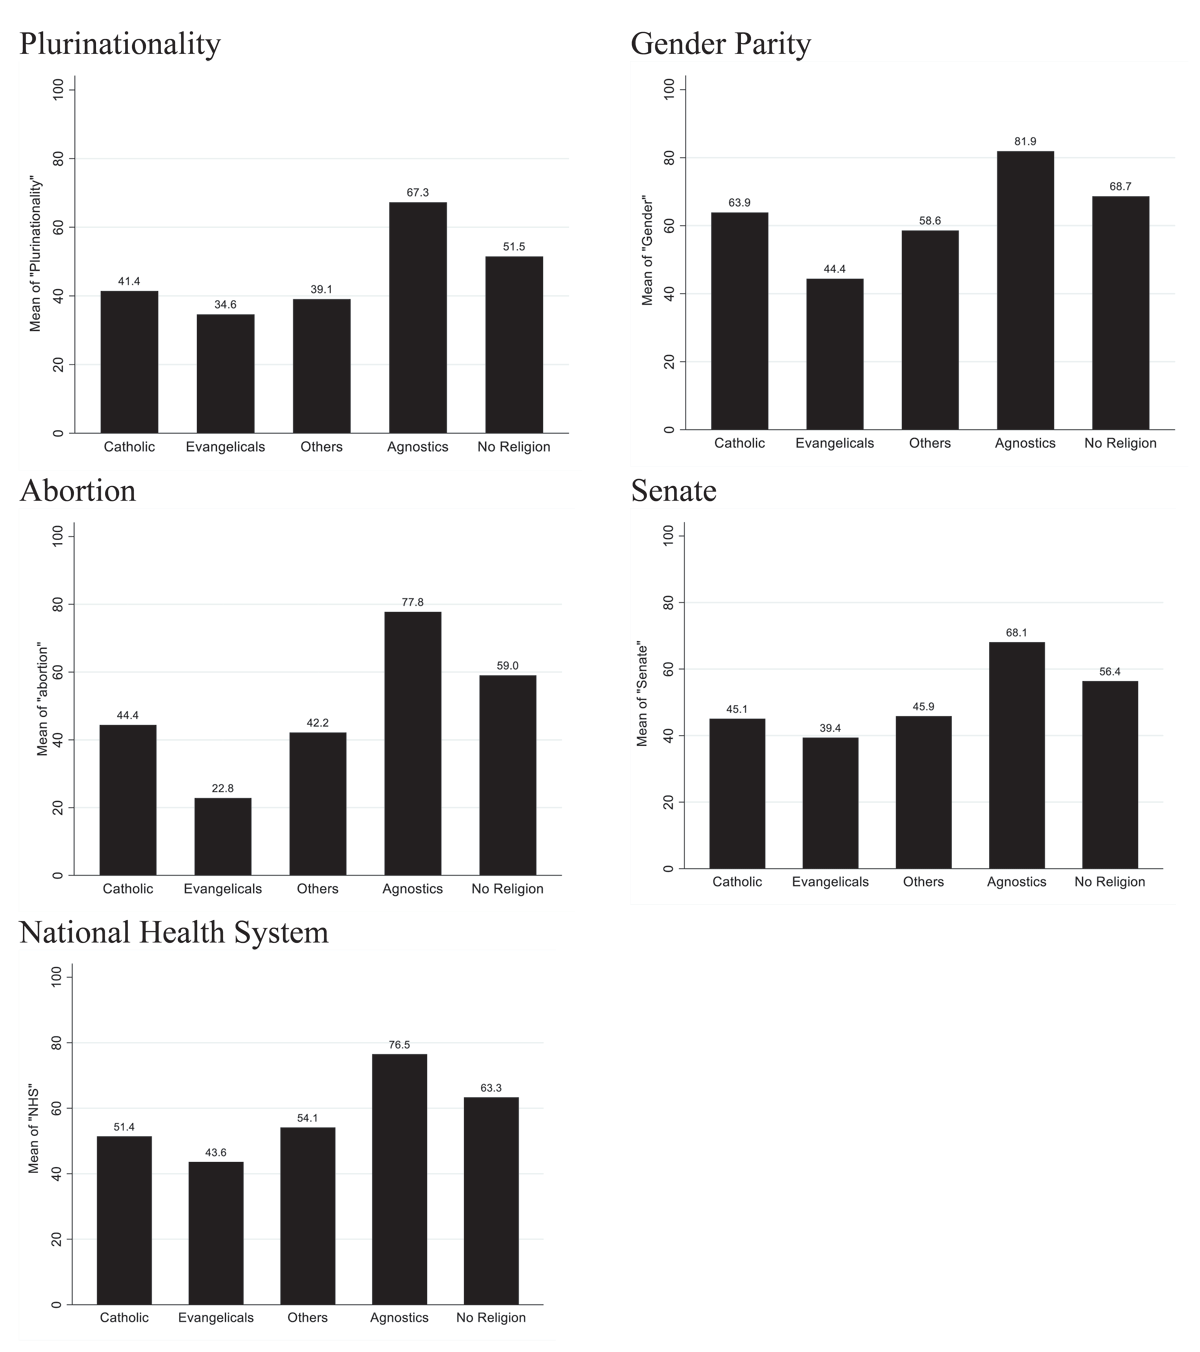
Figure 2
Support for five axes of the constitutional proposal, according to religion.
Source: Compiled with data from www.mepop.cl.
Table 2
Multinomial logit regression model. The dependent variable is the voting intention for the 2022 constitutional referendum.
| MODEL 1 REJECT | MODEL 2 NV/NA/DK | |
|---|---|---|
| Ideological Scale | 0.613*** | 0.381*** |
| (0.0496) | (0.0476) | |
| Presidential Approve | –4.719*** | –2.793*** |
| (0.354) | (0.231) | |
| Catholics (Ref. No Religion) | 0.495** | –0.257 |
| (0.234) | (0.234) | |
| Evangelicals (Ref. No Religion) | 1.358*** | 0.157 |
| (0.390) | (0.399) | |
| Others (Ref. No Religion) | 0.753** | 0.0138 |
| (0.368) | (0.368) | |
| Agnostics (Ref. No Religion) | –0.481 | –0.965*** |
| (0.334) | (0.364) | |
| Frequency of Church Attendance | 0.116 | 0.310*** |
| (0.0920) | (0.0907) | |
| Income Level | 0.174** | –0.148* |
| (0.0815) | (0.0844) | |
| Sex (0 = Man/1 = Woman) | –0.154 | 0.311 |
| (0.188) | (0.191) | |
| Age | 0.0156** | –0.00209 |
| (0.00683) | (0.00685) | |
| Area of Residence (0 = Others/1 = MR) | –0.310 | 0.0409 |
| (0.189) | (0.191) | |
| Constant | –3.008*** | –1.606*** |
| (0.535) | (0.527) | |
| Baseline | Approve | |
| Observations | 1,605 | |
| Pseudo-R: | 0.41 | |
| Log-Likelihood: | –983.38542 | |
| Prob > chi2 | 0 | |
[i] Standard errors in parentheses.
*** p < 0.01, ** p < 0.05, * p < 0.1.
Source: Compiled with data from www.mepop.cl.

Figure 3
Predicted values of voting intention, according to religion.
OR = Other Religions. NR = No Religion.
Source: Compiled with data from www.mepop.cl.
Table 3
Determinants of support for the five axes of the constitutional proposal.
| MODEL 1 | MODEL 2 | MODEL 3 | MODEL 4 | MODEL 5 | MODEL 6 | MODEL 7 | MODEL 8 | MODEL 9 | MODEL 10 | |
|---|---|---|---|---|---|---|---|---|---|---|
| ABORTION | ABORTION | GENDER | GENDER | SENATE | SENATE | PLURINATIONALITY | PLURINATIONALITY | NHS | NHS | |
| Ideological Scale (0 = Left/10 = Right) | –2.994*** | –3.630*** | –3.181*** | –3.802*** | –3.536*** | –3.305*** | –3.357*** | –4.646*** | –3.659*** | –4.120*** |
| (0.371) | (0.659) | (0.331) | (0.590) | (0.352) | (0.629) | (0.344) | (0.612) | (0.365) | (0.651) | |
| Presidential Approve(0 = Others/1 = Approve) | 23.21*** | 22.78*** | 22.89*** | 22.65*** | 35.95*** | 35.87*** | 38.47*** | 38.02*** | 33.45*** | 33.29*** |
| (2.210) | (2.220) | (1.974) | (1.988) | (2.102) | (2.117) | (2.054) | (2.063) | (2.179) | (2.193) | |
| Catholics (Ref. No Religion) | –4.467** | –7.900* | 4.324** | 1.694 | –3.310 | –1.294 | –1.175 | –12.21*** | –2.374 | –6.565 |
| (2.195) | (4.414) | (1.961) | (3.952) | (2.088) | (4.209) | (2.040) | (4.100) | (2.164) | (4.359) | |
| Evangelicals (Ref. No Religion) | –22.89*** | –41.02*** | –10.00*** | –15.53** | –8.058*** | –12.41* | –6.471** | –14.17** | –5.817* | –12.75* |
| (3.245) | (7.327) | (2.898) | (6.560) | (3.086) | (6.986) | (3.015) | (6.807) | (3.199) | (7.236) | |
| Others (Ref. No Religion) | –9.676*** | –3.875 | –3.021 | –11.24* | –3.367 | 0.309 | –5.540* | –7.653 | –1.405 | 4.467 |
| (3.435) | (7.223) | (3.068) | (6.466) | (3.266) | (6.887) | (3.192) | (6.710) | (3.386) | (7.133) | |
| Agnostics (Ref. No Religion) | 10.08*** | 8.440 | 7.233*** | 3.376 | 4.603 | 7.151 | 8.938*** | 6.764 | 5.716* | 4.283 |
| (3.136) | (5.665) | (2.801) | (5.072) | (2.982) | (5.402) | (2.914) | (5.263) | (3.091) | (5.595) | |
| Frequency of Church Attendance | –4.162*** | –4.196*** | –2.007*** | –2.019*** | 0.0494 | 0.0404 | –0.139 | –0.218 | –1.472* | –1.491* |
| (0.780) | (0.780) | (0.697) | (0.698) | (0.742) | (0.743) | (0.725) | (0.724) | (0.769) | (0.770) | |
| Socio-economic Level | 0.900 | 0.873 | 0.497 | 0.508 | –3.039*** | –3.051*** | –2.741*** | –2.773*** | –3.370*** | –3.390*** |
| (0.723) | (0.722) | (0.646) | (0.646) | (0.687) | (0.688) | (0.672) | (0.670) | (0.712) | (0.713) | |
| Sex (0 = Man/1 = Woman) | 7.498*** | 7.234*** | 8.714*** | 8.742*** | 4.693*** | 4.627*** | 5.550*** | 5.394*** | 2.713 | 2.539 |
| (1.710) | (1.710) | (1.528) | (1.531) | (1.627) | (1.630) | (1.590) | (1.588) | (1.686) | (1.689) | |
| Age | –0.336*** | –0.337*** | –0.105* | –0.0996* | –0.206*** | –0.206*** | –0.175*** | –0.178*** | –0.145** | –0.149** |
| (0.0604) | (0.0605) | (0.0540) | (0.0541) | (0.0575) | (0.0576) | (0.0562) | (0.0562) | (0.0596) | (0.0597) | |
| Area of Residence (0 = Others/1 = RM) | 3.584** | 3.753** | 1.287 | 1.198 | –2.037 | –1.977 | 2.344 | 2.375 | –1.097 | –0.967 |
| (1.727) | (1.726) | (1.543) | (1.545) | (1.642) | (1.646) | (1.605) | (1.604) | (1.702) | (1.705) | |
| Catholics*Ideological Axis | 0.734 | 0.581 | –0.405 | 2.230*** | 0.843 | |||||
| (0.782) | (0.700) | (0.745) | (0.726) | (0.772) | ||||||
| Evangelicals*Ideological Axis | 3.197*** | 1.072 | 0.677 | 1.608 | 1.277 | |||||
| (1.180) | (1.056) | (1.125) | (1.096) | (1.165) | ||||||
| Others**Ideological Axis | –1.041 | 1.661 | –0.739 | 0.575 | –1.073 | |||||
| (1.264) | (1.132) | (1.206) | (1.175) | (1.249) | ||||||
| Agnostics**Ideological Axis | 0.311 | 0.918 | –0.642 | 0.299 | 0.288 | |||||
| (1.218) | (1.091) | (1.162) | (1.132) | (1.203) | ||||||
| Constant | 71.99*** | 75.54*** | 67.47*** | 70.12*** | 71.75*** | 70.88*** | 60.43*** | 66.95*** | 83.42*** | 86.03*** |
| (4.836) | (5.454) | (4.320) | (4.883) | (4.599) | (5.200) | (4.494) | (5.067) | (4.767) | (5.386) | |
| Observations | 1,605 | 1,605 | 1,605 | 1,605 | 1,605 | 1,605 | 1,605 | 1,605 | 1,605 | 1,605 |
| R-squared | 0.329 | 0.333 | 0.295 | 0.296 | 0.371 | 0.371 | 0.398 | 0.402 | 0.345 | 0.346 |
| Log Lik | –7928 | –7923 | –7747 | –7745 | –7847 | –7846 | –7810 | –7805 | –7905 | –7903 |
[i] Standard error in parentheses.
*** p < 0.01, ** p < 0.05, * p < 0.1.
Source: Compiled with data from www.mepop.cl.

Figure 4
Predicted values of support for Abortion and Plurinationality, according to Religion.
Source: Compiled with data from www.mepop.cl.