
Table 1
Intercorrelations and Descriptive Statistics.
| 1 | 2 | 3 | 4 | 5 | 6 | 7 | 8 | M | SD | ||||||||
|---|---|---|---|---|---|---|---|---|---|---|---|---|---|---|---|---|---|
| 1. All close relationships | – | 7.51 | 5.09 | ||||||||||||||
| 2. SA close relationships | .65 | ** | – | 1.21 | 1.87 | ||||||||||||
| 3. SA Sunday attendance | .05 | .19 | – | 1.99 | 0.49 | ||||||||||||
| 4. Other SA activities | .20 | .50 | ** | .44 | ** | – | 1.55 | 0.58 | |||||||||
| 5. Non-SA activities | –.06 | –.15 | –.03 | –.11 | – | 1.75 | 0.66 | ||||||||||
| 6. WE wellbeing | .33 | ** | .23 | * | .03 | .18 | .09 | – | 3.71 | 0.44 | |||||||
| 7. ONS wellbeing | .14 | .10 | –.06 | .14 | .09 | .82 | ** | – | 7.28 | 1.15 | |||||||
| 8. Loneliness | –.41 | ** | –.32 | ** | .07 | –.22 | * | .03 | –.69 | ** | –.66 | ** | – | 2.24 | 0.79 | ||
| 9. Composite wellbeing | .32 | ** | .23 | * | –.03 | .21 | * | .05 | .92 | ** | .91 | ** | –.87 | ** | 0.07 | 0.78 | |
[i] Note. *p < .05, **p < .01. Descriptive statistics are averaged across all six surveys. SA = Sunday Assembly, WE = Warwick-Edinburgh, ONS = Office of National Statistics.
Table 2a–b
Effects of Activities on Sense of Community and Friendship Formation.
| a | b | ||
|---|---|---|---|
| Activity | % | Activity | % |
| 1. Socializing before/after service | 34 | 1. Socializing before/after service | 48 |
| 2. Helping organise/run service | 20 | 2. Helping organise/run service | 15 |
| 3. Singing | 15 | 3. Eating together after service | 10 |
| 4. Attending in general; event atmosphere | 08 | 4. Meeting people seated next to you | 09 |
| 5. Listening to speakers | 08 | 5. Attending in general; event atmosphere | 04 |
| 6. Greeting or being greeted | 05 | 6. Greeting or being greeted | 04 |
| 7. Meeting people seated next to you | 04 | 7. Singing | 03 |
[i] Note. For Table 2a–b, figures in the % column indicate mean percentage of participants (of those who mentioned at least one activity) per survey who mentioned the activity in response to the question of which SA Sunday service activities most contribute to sense of community (Table 2a) or friendship formation (Table 2b). Participants could name more than one activity per question. Only the seven most frequently mentioned activities are listed in each table.
Table 3
Coefficients, standard error (SE) and p-values of each of the activities predicting wellbeing measures in panel analysis.
| Wellbeing measure | Predictor | Coefficient | SE | p-value |
|---|---|---|---|---|
| WE | SA Sunday attendance | –0.006 | 0.03 | .8 |
| Other SA activities | 0.008 | 0.004 | .02 | |
| Non-SA activities | 0.002 | 0.004 | .6 | |
| ONS | SA Sunday attendance | 0.05 | 0.07 | .5 |
| Other SA activities | 0.03 | 0.001 | <.01 | |
| Non-SA activities | 0.005 | 0.01 | .6 | |
| Composite | SA Sunday attendance | 0.04 | 0.04 | .3 |
| Other SA activities | 0.02 | 0.005 | <.01 | |
| Non-SA activities | 0.003 | 0.006 | .6 |
[i] Note. WE = Warwick-Edinburgh, ONS = Office of National Statistics, SA = Sunday Assembly.
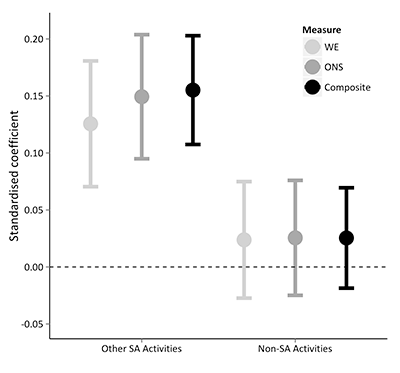
Figure 1
Standardized coefficients describing effects of Other SA Activities and Non-SA Activities on three wellbeing measures: Warwick-Edinburgh (WE), Office of National Statistics (ONS), and composite (composed of WE, ONS, and Loneliness). Effects are significant for Other SA Activities (all three p values ≤ .02) and non-significant for Non-SA Activities (all three p values ≥ .6). Error bars represent one standard error.