
Table 1
Demographic characteristics of study participants, as well as mean (standard deviation) McCroskey Introversion Scale (MIS) and Clance Imposter Phenomenon Score (CIPS) scores.
| VARIABLE | N (%) | MIS | CIPS |
|---|---|---|---|
| Gender2 | |||
| Women | 398 (69.9%) | 31.6 (7.3) | 65.1 (14.2) |
| Men | 165 (29.0%) | 32.6 (8.0) | 59.2 (14.7) |
| Gender Diverse | 6 (1.1%) | 36.5 (5.7) | 74.8 (9.6) |
| Sexual and relationship minority | |||
| No | 438 (82.6%) | 31.9 (7.3) | 63.2 (15.1) |
| Yes | 92 (17.4%) | 31.3 (8.3) | 65.5 (12.8) |
| Race and Ethnicity | |||
| non-URIM | 483 (90.8%) | 31.8 (7.5) | 63.2 (14.8) |
| URIM | 49 (9.2%) | 31.5 (8.2) | 65.9 (13.7) |
| Disability | |||
| No | 434 (77.4%) | 32.0 (7.5) | 62.1 (14.5) |
| Yes | 127 (22.6%) | 31.7 (7.4) | 68.4 (14.0) |
| First-generation medical student | |||
| No | 128 (22.7%) | 32.5 (7.1) | 64.3 (15.8) |
| Yes | 436 (77.3%) | 31.8 (7.6) | 63.2 (14.3) |
| Training Level | |||
| UGME | 235 (40.7%) | 31.1 (7.2) | 64.8 (13.5) |
| PGME | 213 (36.9%) | 31.7 (7.6) | 64.1 (14.5) |
| Practicing physician | 130 (22.5%) | 33.8 (7.5) | 60.37 (16.3) |
[i] URIM = under-represented in medicine; UGME = undergraduate medical education; PGME = postgraduate medical education.
Note. Responses to demographic questions were optional; therefore, totals may not sum to 578.
Table 2
Multiple linear regression coefficients for imposter phenomenon (CIPS).
| PREDICTOR VARIABLE | UNSTANDARDIZED REGRESSION COEFFICIENT (B) | STANDARDIZED REGRESSION COEFFICIENT (β) | |
|---|---|---|---|
| B | 95% CONFIDENCE INTERVAL | ||
| Introversion (MIS) | 0.68*** | 0.52–0.84 | 0.34 |
| Gender (vs. Men) | |||
| Women | 6.18*** | 3.37–8.99 | 0.18 |
| Sexual and relationship minority (vs. No) | |||
| Yes | 0.37 | –3.04–3.79 | 0.01 |
| Race and Ethnicity (vs. non-URIM) | |||
| URIM | 2.97 | –1.35–7.28 | 0.06 |
| Disability (vs. No) | |||
| Yes | 4.93*** | 1.91–7.95 | 0.14 |
| First-generation medical student (vs. No) | |||
| Yes | –0.28 | –3.25–2.69 | –0.01 |
| Training Level (vs. Practicing Physician) | |||
| UGME | 3.74* | 0.46–7.01 | 0.12 |
| PGME | 2.83 | –0.44–6.10 | 0.09 |
[i] *p ≤ 0.05, **p ≤ 0.01, ***p ≤ 0.001.
CIPS = Clance Imposter Phenomenon Score; MIS = McCroskey Introversion Scale; URIM = under-represented in medicine; UGME = undergraduate medical education; PGME = postgraduate medical education.
Unstandardized regression coefficient (B) indicates how much CIPS scores change with the predictor.
Standardized regression coefficient (β) indicates the relative strength of each predictor in the model; larger values reflect stronger relationships and allow comparison across variables.
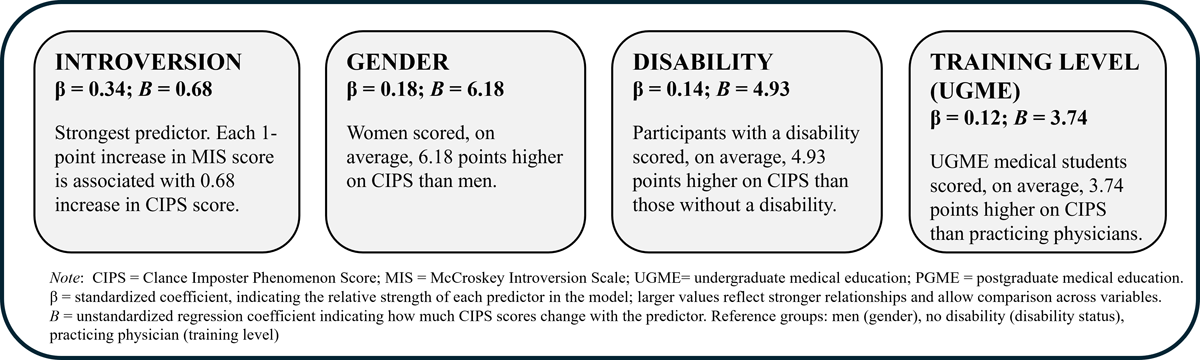
Figure 1
Significant predictors of Imposter Phenomenon (CIPS) from multiple linear regression. Each box displays the standardized (β) and unstandardized (B) regression coefficients, along with an interpretation of the association. Non-significant predictors (PGME training level, race/ethnicity, sexual and relationship minority status, and first-generation medical student status) are not shown.