
Table 1
Study Design.
| STUDENT ETHNICITY | ASCENDING PERFORMANCE | DESCENDING PERFORMANCE | ||
|---|---|---|---|---|
| MAJORITY | MINORITY | MAJORITY | MINORITY | |
| Group 1 | Script A (video 1) | Script B (video 4) | Script C (video 5) | Script D (video 8) |
| Group 2 | Script B (video 3) | Script A (video 2) | Script D (video 7) | Script C (video 6) |
[i] Notes. Scripts: A cough, B stomach complaints, C headache complaints, D tiredness.
Group 1 watched videos 1, 4, 5, and 8. Group 2 watched videos 2, 3, 6, and 7. Within both groups, videos were presented in four different orders.

Figure 1
LMM Estimates of First Impression and Final Ratings.
Notes. **p < .01, *p < .05, n.s. not significant. LMM estimates are controlled for script differences.
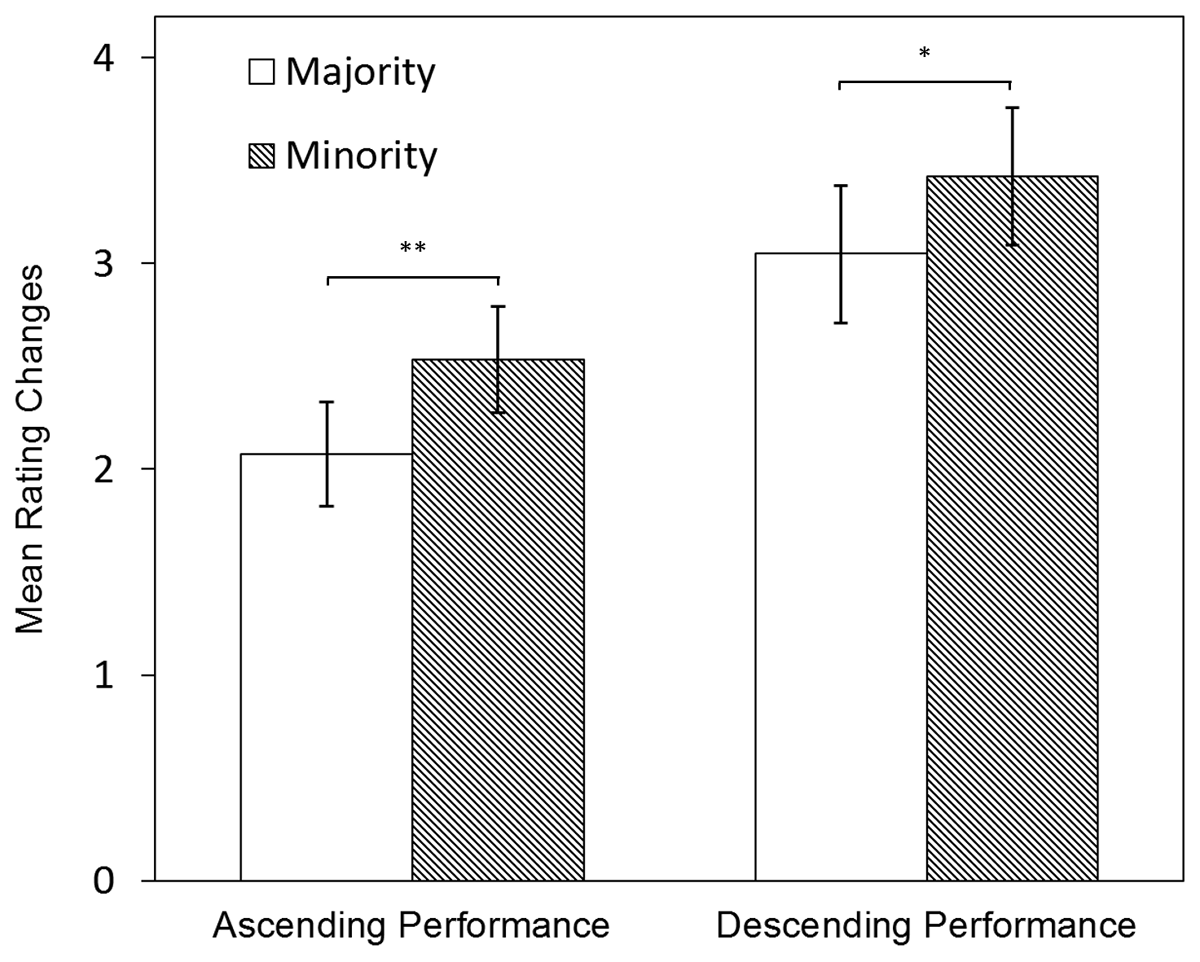
Figure 2
Rating Changes: LMM Estimates of Changes Between First Impressions and Final Ratings.
Notes. **p < .01, *p < .05. LLM estimates are controlled for script differences.