
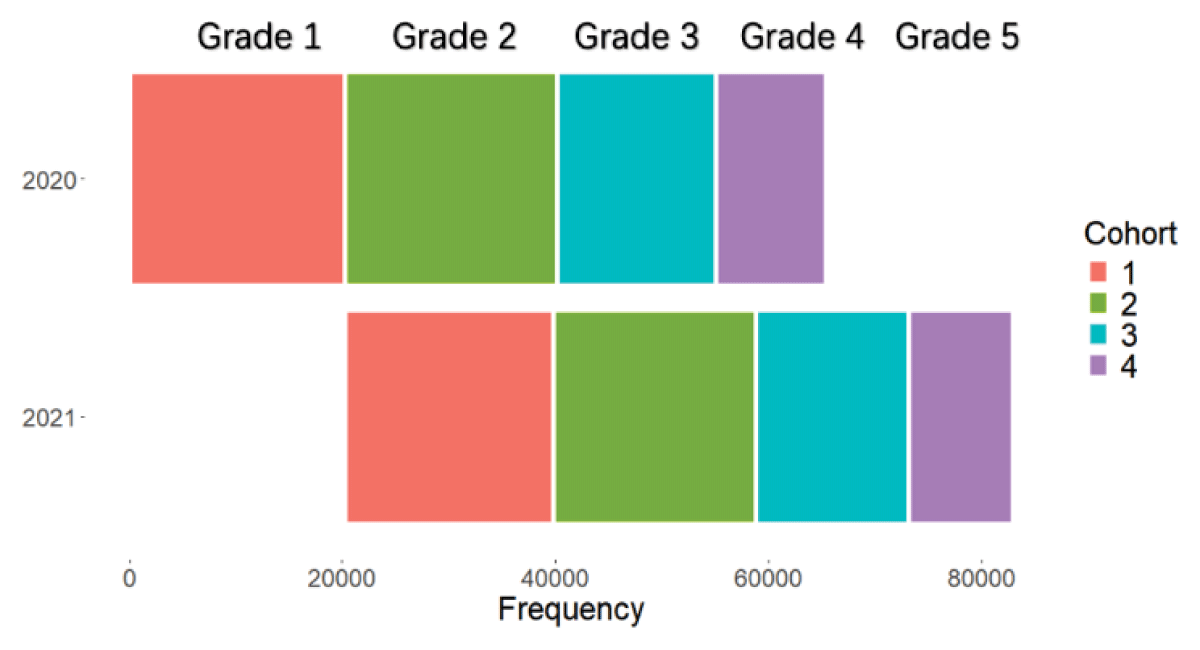
Figure 1
Data for the four CMSS cohorts used in this study.
Table 1
Measurement properties and descriptive statistics of student engagement scales.
| VARIABLES | MEAN | SD | |
|---|---|---|---|
| Behavioural engagement: Cronbach’s α: 0.78 (2020 wave); 0.75 (2021 wave) KMO:0.72 (2020 wave); 0.70 (2021 wave) | |||
| Behavioural clinical engagement | |||
| B1 | Participating in teaching rounds | 3.71 | 1.13 |
| B2 | Participating in case-reporting | 3.37 | 1.11 |
| B3 | Participating in clinical operations | 3.21 | 1.15 |
| Behavioural classroom engagement | |||
| B4 | Doing academic-related presentations | 2.80 | 1.02 |
| B5 | Participating in cooperative group learning or discussions | 3.47 | 0.88 |
| Emotional engagement: Cronbach’s α: 0.89 (2020 wave); 0.79 (2021 wave) KMO:0.69 (2020 wave); 0.69 (2021 wave) | |||
| E1 | I am interested in my field of study | 3.82 | 0.78 |
| E2 | I want my future career to be closely related to my profession | 4.05 | 0.77 |
| E3 | I am passionate about learning | 3.63 | 0.78 |
| Cognitive engagement: Cronbach’s α: 0.74 (2020 wave); 0.73 (2021 wave) KMO:0.70 (2020 wave); 0.72 (2021 wave) | |||
| C1 | When I encounter difficulties in my studies, I can usually think of some solutions to deal with them | 3.79 | 0.73 |
| C2 | I have participated as an active learner with responsibility for my own learning | 3.60 | 0.83 |
| C3 | I have assessed my competence | 3.68 | 0.82 |
| Agentic engagement: Cronbach’s α: 0.78 (2020 wave); 0.75 (2021 wave) KMO:0.70 (2020 wave); 0.68 (2021 wave) | |||
| A1 | My feedback has been considered in curriculum development | 3.51 | 0.90 |
| A2 | I have been involved formally and/or informally in peer teaching (explaining the appropriate knowledge to my peers) | 3.60 | 0.86 |
| A3 | I have engaged in peer assessment | 3.43 | 0.93 |
[i] Notes: 1) This table presents the items used to measure student engagement; 2) the table shows the Cronbach’s alpha reliability coefficients and KMO (Kaiser-Meyer-Olkin) calculated for each engagement measure, separately for the 2020 and 2021 cohorts; 3) because behavioural clinical and classroom engagement are highly dependent on medical students’ period (the curriculum design in different grade), samples with an original behavioural clinical engagement’s and behavioural classroom engagement’s value of 0 were not included in the calculation for mean and SD; 4) Confirmatory Factor Analysis (CFA) was conducted to further validate the distinctiveness of the engagement dimensions. The CFA model fit indices showed a satisfactory fit: Comparative Fit Index (CFI) values ranged from 0.92 to 0.95 across the engagement dimensions, indicating a good model fit (CFI > 0.90). Composite Reliability (CR) values ranged from 0.75 to 0.88, supporting the reliability of the constructs. These results collectively confirm the validity and reliability of the engagement scales used in this study.
Table 2
Student characteristics.
| VARIABLES | MEAN | SD | |
|---|---|---|---|
| 1 | Gender (Male) | 0.41 | 0.49 |
| 2 | Residence (Urban area) | 0.54 | 0.50 |
| 3 | Father’s education duration | 10.51 | 3.86 |
| 4 | Mother’s education duration | 9.44 | 4.32 |
| 5 | Father’s occupation ISEI | 33.04 | 18.89 |
| 6 | Mother’s occupation ISEI | 29.99 | 17.14 |
| 7 | Having medical worker(s) in the family | 0.11 | 0.31 |
[i] Notes: ISEI: International Socio-Economic Index of Occupational Status.
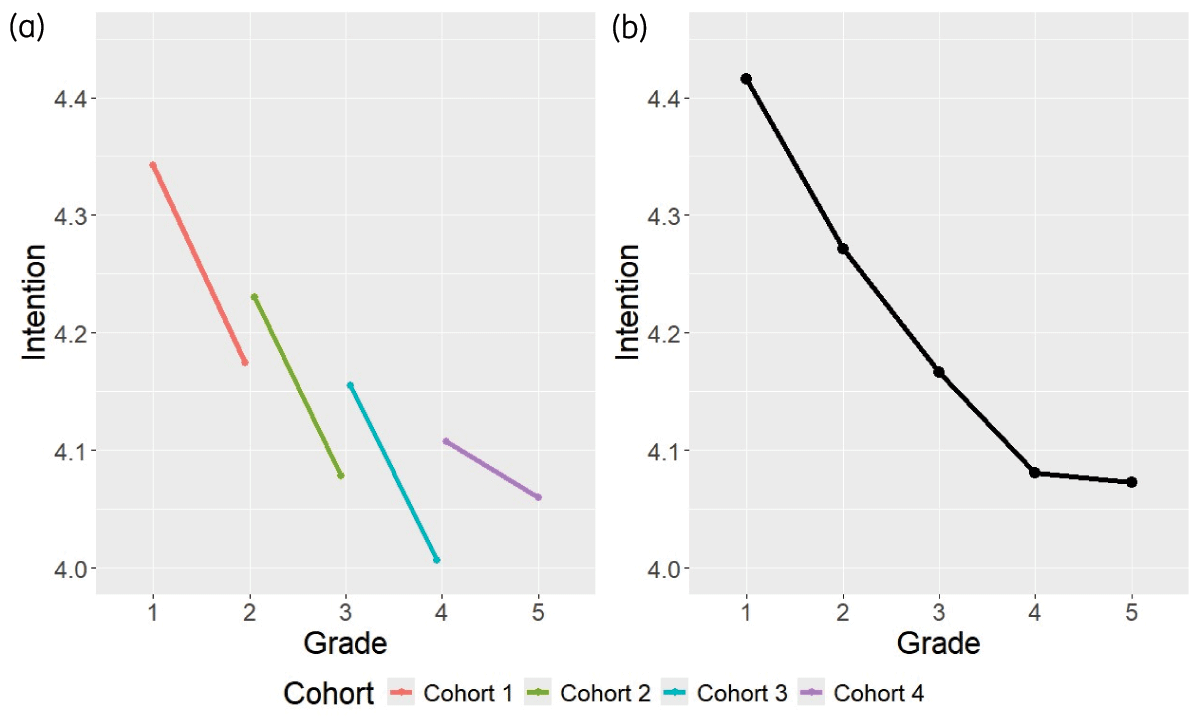
Figure 2
Students’ intention to practise medicine by year and cohort. (a) Descriptive mean intention by year for four cohorts; (b) Model-estimated trajectory from the multilevel growth model (without covariate adjustment).
Table 3
Regression results for the relationship between engagement and intention to practise medicine by year and cohort.
| MODEL 1 | MODEL 2 | MODEL 3 | MODEL 4 | MODEL 5 | MODEL 6 | MODEL 7 | |
|---|---|---|---|---|---|---|---|
| G2 | –0.087*** | –0.063* (0.029) | –0.109*** (0.027) | –0.089*** (0.005) | –0.099*** (0.005) | –0.089*** (0.005) | –0.079** (0.029) |
| G3 | –0.138*** | –0.108*** (0.028) | –0.123*** (0.026) | –0.128*** (0.006) | –0.145*** (0.006) | –0.131*** (0.006) | –0.096*** (0.027) |
| G4 | –0.183*** | –0.152*** (0.028) | –0.124*** (0.026) | –0.160*** (0.006) | –0.157*** (0.007) | –0.172*** (0.007) | –0.105*** (0.027) |
| G5 | –0.176*** | –0.203*** (0.028) | –0.127*** (0.026) | –0.176*** (0.007) | –0.198*** (0.008) | –0.180*** (0.008) | –0.155*** (0.027) |
| BEcli | 0.016 (0.019) | –0.022 (0.018) | |||||
| G2 × BEcli | 0.051* (0.021) | 0.034 (0.020) | |||||
| G3 × BEcli | 0.035 (0.020) | 0.022 (0.019) | |||||
| G4 × BEcli | 0.096*** (0.019) | 0.065*** (0.019) | |||||
| G5 × BEcli | 0.118*** (0.020) | 0.064*** (0.019) | |||||
| BEcla | 0.050* (0.024) | –0.048 (0.025) | |||||
| G2 × BEcla | 0.048* (0.026) | 0.039 (0.027) | |||||
| G3 × BEcla | 0.027 (0.025) | 0.023 (0.025) | |||||
| G4 × BEcla | 0.035 (0.024) | 0.039 (0.025) | |||||
| G5 × BEcla | 0.029 (0.024) | 0.037 (0.025) | |||||
| EE | 0.336*** (0.005) | 0.330*** (0.029) | |||||
| G2 × EE | 0.026*** (0.005) | 0.006 (0.032) | |||||
| G3 × EE | 0.037*** (0.006) | 0.035 (0.030) | |||||
| G4 × EE | 0.056*** (0.006) | 0.027 (0.029) | |||||
| G5 × EE | 0.056*** (0.007) | 0.036 (0.030) | |||||
| CE | 0.193*** (0.005) | 0.065 (0.042) | |||||
| G2 × CE | 0.017** (0.005) | –0.027 (0.046) | |||||
| G3 × CE | 0.026*** (0.006) | –0.048 (0.043) | |||||
| G4 × CE | 0.042*** (0.006) | –0.043 (0.043) | |||||
| G5 × CE | 0.048*** (0.007) | –0.056 (0.043) | |||||
| AE | 0.140*** (0.005) | –0.022 (0.037) | |||||
| G2 × AE | 0.006 (0.006) | 0.061 (0.041) | |||||
| G3 × AE | 0.007 (0.006) | 0.067 (0.039) | |||||
| G4 × AE | 0.017** (0.006) | 0.052 (0.038) | |||||
| G5 × AE | 0.030*** (0.008) | 0.057 (0.038) | |||||
| Student controls | Yes | Yes | Yes | Yes | Yes | Yes | Yes |
| School variance | 0.005 | 0.007 | 0.006 | 0.001 | 0.003 | 0.004 | 0.002 |
| Student variance | 0.172 | 0.224 | 0.226 | 0.105 | 0.151 | 0.161 | 0.157 |
| Student-year variance | 0.338 | 0.298 | 0.298 | 0.303 | 0.320 | 0.329 | 0.262 |
| School-level ICC | 1.0% | 1.3% | 1.1% | 0.2% | 0.6% | 0.8% | 0.5% |
| Student-grade observations | 134878 | 51614 | 51614 | 134878 | 134878 | 134878 | 51614 |
| Num of students | 67439 | 25807 | 25807 | 67439 | 67439 | 67439 | 25807 |
| Num of schools | 94 | 94 | 94 | 94 | 94 | 94 | 94 |
[i] Note: 1) ICC, intraclass correlation coefficient (proportion of institution-level variance to total variance); 2) *p < 0.05, **p < 0.01, ***p < 0.001; 3) Student controls refer to the seven student characteristic variables listed in methods section; 4) G means Grade, G2 means Grade 2, the rest are similar; BEcli (Behavioural clinical engagement), BEcla (Behavioural classroom engagement), EE (Emotional engagement), CE (Cognitive engagement), AE (Agentic engagement); 5) Variance Inflation Factor (VIF) values were calculated to assess multicollinearity among the engagement dimensions included in Model 7. All VIF values were below the commonly used threshold of 10, indicating acceptable levels of multicollinearity. The VIF values were as follows: BEcli (Behavioural clinical engagement) = 1.271, BEcla (Behavioural classroom engagement) = 1.245, EE (Emotional engagement) = 1.955, CE (Cognitive engagement) = 3.073, AE (Agentic engagement) = 2.337; 6) To estimate the explanatory power of each engagement dimension, we calculated the marginal R² for each model (Models 2–6) and compared them with the baseline model (Model 1), which includes only control variables (grade and student-level covariates). The increase in R² after adding each engagement dimension reflects its individual contribution to explaining variance in medical students’ intention to practise medicine. The R² increments were as follows: EE (17.55%), CE (7.25%), AE (3.86%), BEcli (~0%), and BEcla (~0%). These values indicate that emotional engagement explains the most variance, followed by cognitive and agentic engagement, while the behavioural dimensions contribute minimally; 7) We also replaced the conventional linear model with Bayesian hierarchical modeling for this table, and the results remained broadly consistent.
Table 4
Bayesian model averaging estimates.
| PIP | POST MEAN | POST SD | |
|---|---|---|---|
| Student Engagement | |||
| EE | 1.000 | 0.452 | 0.005 |
| AE | 1.000 | 0.048 | 0.006 |
| BEcli | 0.999 | 0.016 | 0.003 |
| CE | 0.828 | 0.017 | 0.009 |
| BEcla | 0.349 | -0.004 | 0.005 |
| Student Characteristics | |||
| Mother’s education duration | 0.776 | 0.003 | 0.002 |
| Residence (Urban area) | 0.381 | 0.009 | 0.013 |
| Gender (Male) | 0.052 | 0.001 | 0.003 |
| Father’s education duration | 0.026 | 0.000 | 0.000 |
| Mother’s occupation ISEI | 0.013 | 0.000 | 0.000 |
| Having medical worker(s) in the family | 0.011 | 0.000 | 0.002 |
| Father’s occupation ISEI | 0.007 | 0.000 | 0.000 |
[i] Note: 1)PIP, posterior inclusion probability; 2)Variables are sorted by PIP values in engagement and student characteristics from highest to lowest. 0.000 indicates the numerical value being excessively small; 3)BEcli (Behavioural clinical engagement), BEcla (Behavioural classroom engagement), EE (Emotional engagement), CE (Cognitive engagement), AE (Agentic engagement); 4) Posterior Inclusion Probabilities (PIPs) for student engagement dimensions are analysed under three prior settings to assess robustness: (1) uniform (equal model probability), (2) fixed (constant model size), and (3) random (binomially distributed model size). PIPs remained consistent across priors, supporting the robustness of the findings.
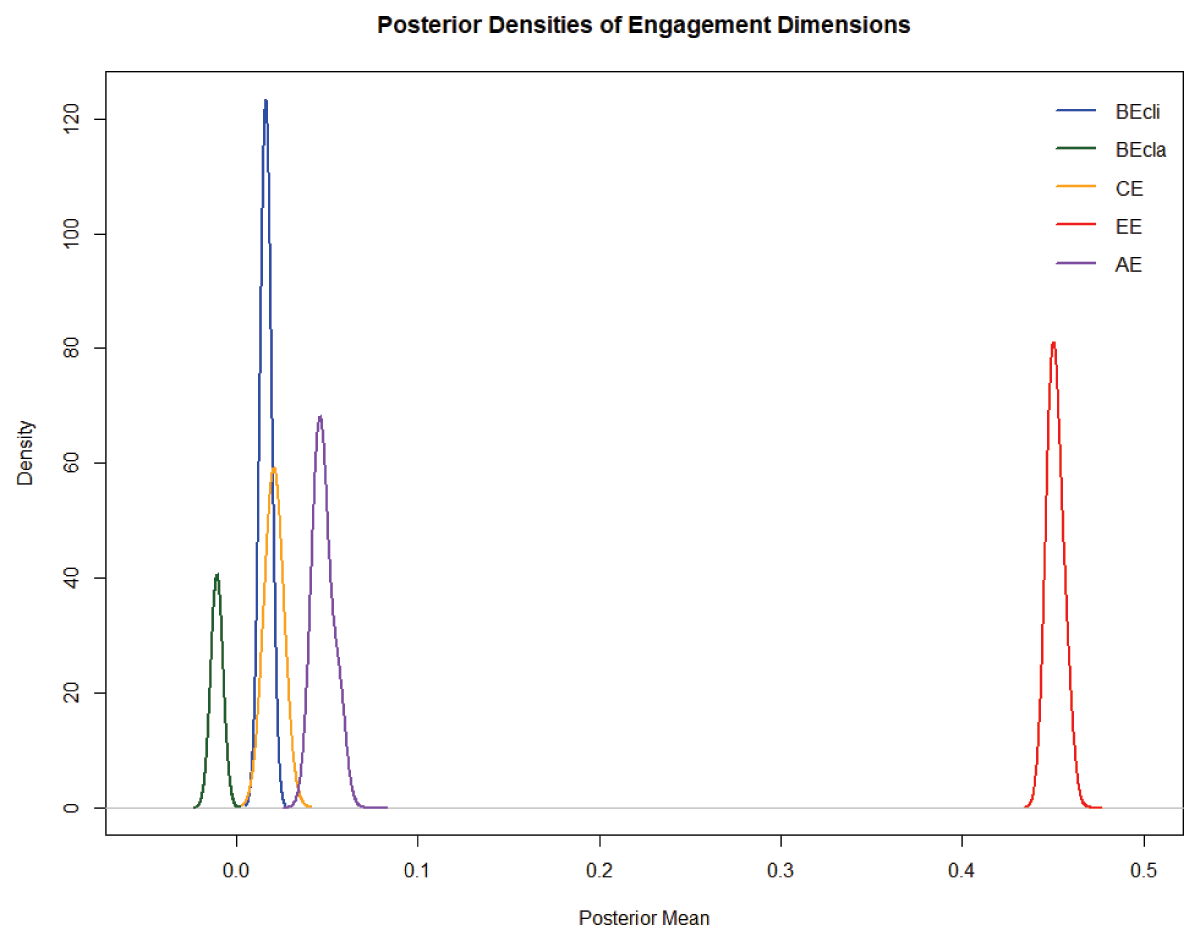
Figure 3
Posterior density plots.