
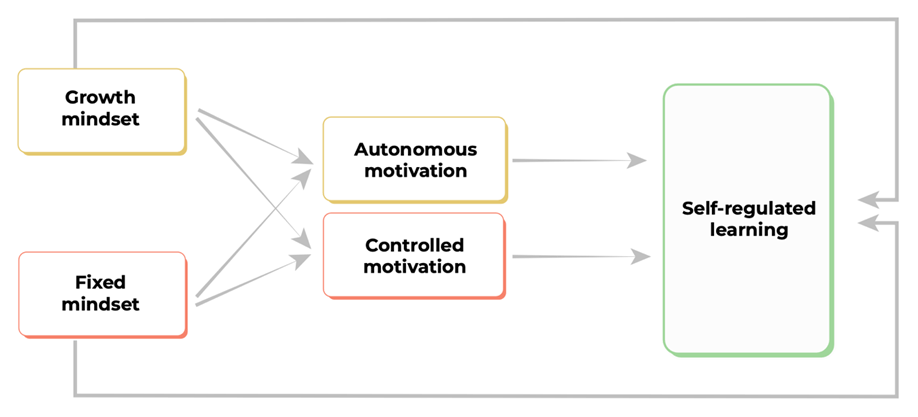
Figure 1
Conceptual model on the associations between mindset, motivation, and self-regulated learning.
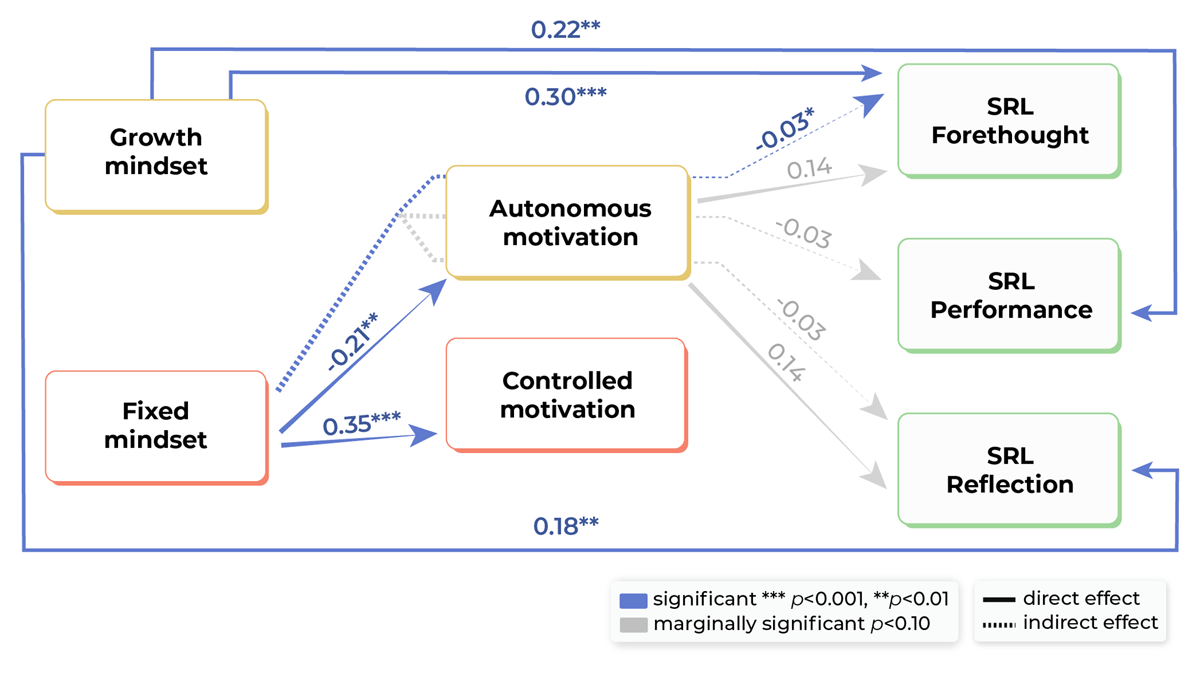
Figure 2
Results of the mediation path analysis.
Only (marginal) significant paths are displayed. Standardized path coefficients are reported for direct and indirect effects (represented by separate arrows). Total effects are not reported in Figure 2 but in Supplementary Table 3. The control path of years of work experience was omitted for figure clarity.
Table 1
Descriptive Statistics of and Bivariate Associations between Study and Potential Control Variables (N = 170).
| STUDY VARIABLES | 1 | 2 | 3 | 4 | 5 | 6 | 7 | M (SD) | CRONBACH’S ALPHA |
|---|---|---|---|---|---|---|---|---|---|
| 1 Growth mindseta | –0.09 | 0.13 | 0.07 | 0.33*** | 0.20* | 0.24** | 2.95 (0.42) | 0.80 | |
| 2 Fixed mindseta | –0.22** | 0.35*** | 0.01 | –0.01 | –.00 | 2.14 (0.39) | 0.67 | ||
| 3 Autonomous motivationb | –0.05 | 0.19* | 0.15(*) | 0.15(*) | 5.89 (0.72) | 0.74 | |||
| 4 Controlled motivationb | 0.04 | 0.03 | 0.03 | 3.48 (1.00) | 0.83 | ||||
| 5 SRL Forethoughtc | 0.36*** | 0.56*** | 3.43 (0.62) | 0.78 | |||||
| 6 SRL Performancec | 0.35*** | 3.23 (0.59) | 0.77 | ||||||
| 7 SRL Reflectionc | 3.50 (0.69) | 0.67 | |||||||
| Control variables | |||||||||
| 8 Work experience in years | 0.04 | –0.04 | 0.10 | –.14(*) | 0.28*** | –0.00 | 0.14(*) | 22.43 (11.66) | – |
| 9 Genderd | 0.08 | 0.02 | –0.05 | –0.08 | 0.00 | –0.05 | 0.03 | – | – |
[i] Note. ascale range 1–4; bscale range 1–7; cscale range 1–5; ddichotomous 1 = female, 2 = male. Coefficients between continuous variables 1–8 represent Pearson correlation coefficients. Coefficients involving the dichotomous variable 9 represent point-biserial correlation coefficients. (*)p < 0.10, *p < 0.05, **p < 0.01, ***p < 0.001.