
Table 1
Characteristics of participants.
| RESIDENTS (n = 11) | MEDICAL SPECIALISTS (n = 10) | |
|---|---|---|
| Age (median in years) | 32 [26–35] | 47 [33–65] |
| Female (n %) | 9 (82%) | 6 (60%) |
| Residency year (n %) | ||
| - year 1–2 | 4 (36%) | |
| - year 3–4 | 6 (55%) | |
| - year 5–6 | 1 (9%) | |
| Medical specialist, years in profession (n %) | ||
| - 1–10 years | 2 (20%) | |
| - 11–20 years | 3 (30%) | |
| - 21–30 years | 2 (20%) | |
| - 31–40 years | 3 (30%) | |
| Specialty (n %) | ||
| - Surgical | 4 (36%) | 2 (20%) |
| - Medical | 6 (55%) | 6 (60%) |
| - Primary care | 1 (9%) | 2 (20%) |
| Hospital (n %) | ||
| - General hospital | 3 (27%) | 3 (30%) |
| - University hospital | 7 (64%) | 5 (50%) |
| - General practice | 1 (9%) | 2 (20%) |
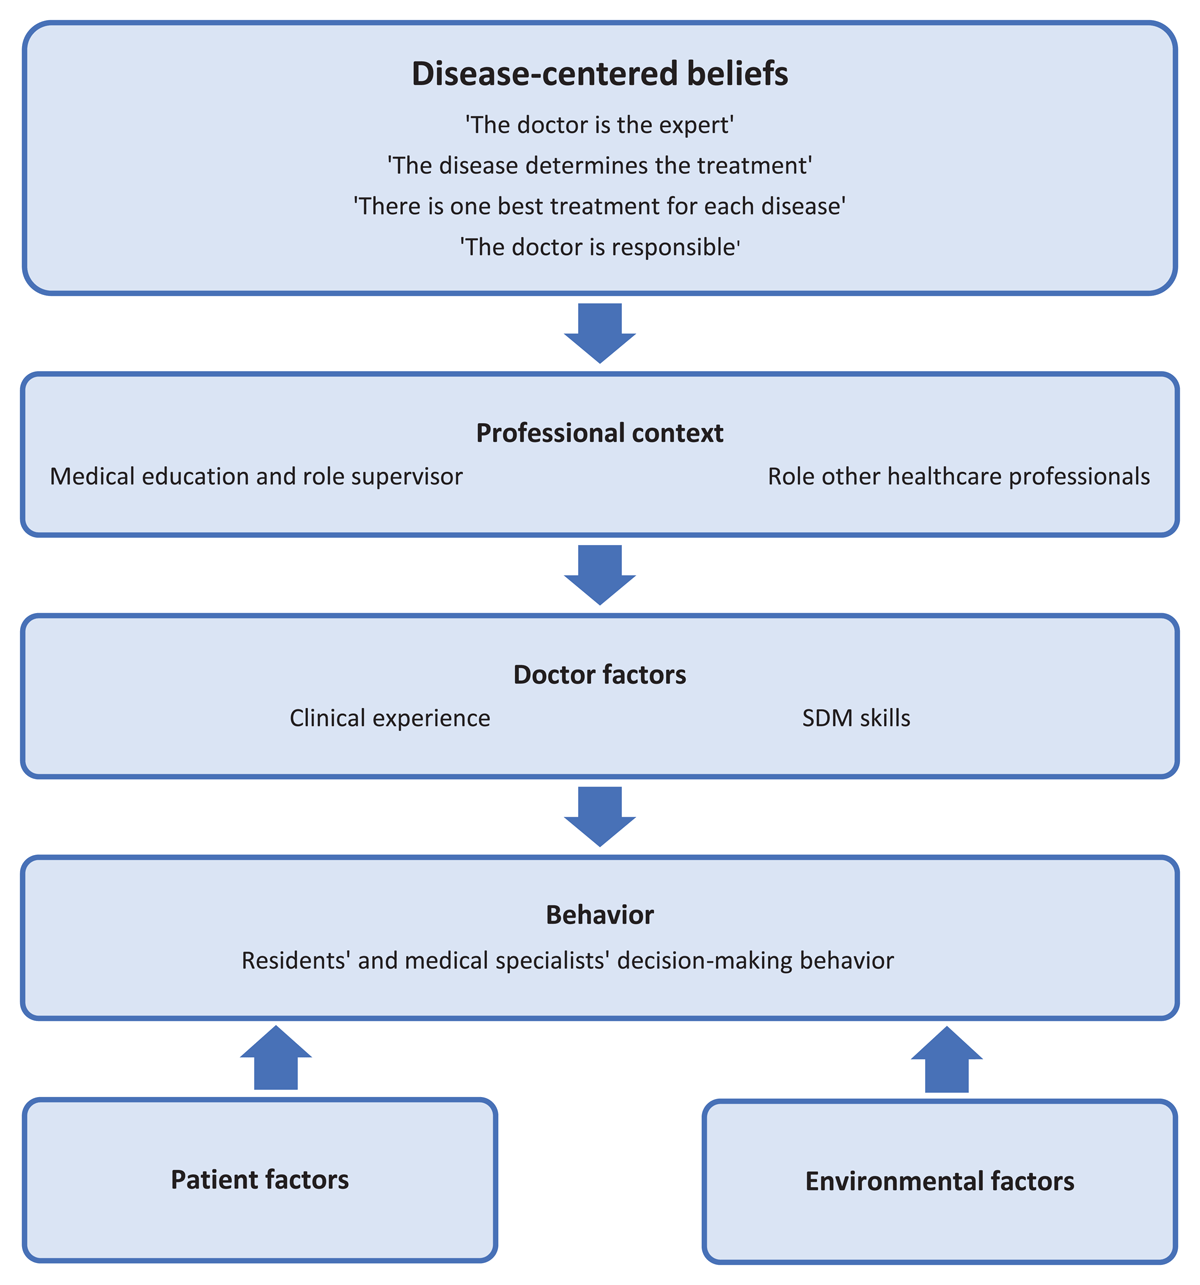
Figure 1
Interrelationship between themes.