
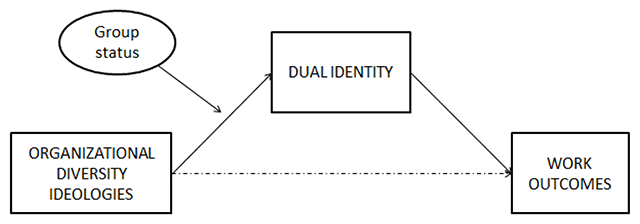
Figure 1
Theoretical model.
Table 1
Goodness-of-fit indices for confirmatory factor analysis.
| Model | χ2 | Df | χ2/df | RMSEA | NNFI | CFI |
|---|---|---|---|---|---|---|
| 5-factor model | 744.75 | 289 | 704.65 | .07 | .94 | .94 |
| 4-factor model (MC and AS = 1 factor) | 1562.48 | 293 | 2263.87 | .16 | .83 | .84 |
| 4-factor model (JS and IQ = 1 factor) | 960.34 | 293 | 1011.89 | .10 | .91 | .92 |
| 4-factor model (DI and JS = 1 factor) | 1678.69 | 293 | 2010.12 | .15 | .81 | .83 |
| 4-factor model (AS and DI = 1 factor) | 1597.73 | 293 | 1664.21 | .13 | .82 | .84 |
| 3-factor model (MC and AS = 1 factor; JS and IQ = 1 factor) | 1773.99 | 296 | 2597.53 | .17 | .80 | .82 |
| 3-factor model (DI, JS and IQ = 1 factor) | 2454.57 | 296 | 4002.27 | .22 | .71 | .74 |
| 3-factor model (AS and DI = 1 factor; JS and IQ = 1 factor) | 1813.27 | 296 | 1968.97 | .15 | .80 | .81 |
| 3-factor model (MC and AS = 1 factor; DI and JS = 1 factor) | 2792.02 | 296 | 3579.17 | .21 | .70 | .73 |
| 2-factor model (MC and AS = 1 factor; DI, JS and IQ = 1 factor) | 3268.22 | 298 | 5542.89 | .26 | .60 | .64 |
| 2-factor model (MC, AS, and DI = 1 factor; JS and IQ = 1 factor) | 2625.69 | 298 | 3675.02 | .21 | .69 | .72 |
| 1-factor model | 3467.03 | 299 | 5096.81 | .25 | .58 | .61 |
[i] Note: N = 261. χ2 = Chi-square Test; χ2/df = Normed Chi-square; RMSEA = Root mean square error of approximation; NNFI = Non-normed fit index; CFI = Comparative fit index; MC = Organizational multiculturalism; AS = Organizational assimilation; DI = Dual identity; JS = Job satisfaction; IQ = Intention to quit.
Table 2
Means, Standard Deviations, and Correlations between variables.
| M | SD | 1 | 2 | 3 | 4 | 5 | 6 | 7 | 8 | ||
|---|---|---|---|---|---|---|---|---|---|---|---|
| 0. Origin | – | – | – | –.07 | .17** | .22*** | .15** | .01 | .11† | –.02 | .02 |
| 1. Gender | – | – | – | –.10 | –.15* | .00 | .08 | –.13† | .22** | .11 | |
| 2. Age | 37.66 | 10.45 | – | .36** | .02 | .12 | –.08 | .02 | –.04 | –.16* | |
| 3. Level of education | – | – | – | –.16 | –.24* | –.19* | .13† | .19* | –.10 | –.11 | |
| 4. Organizational assimilation | 5.62 | .95 | .87 | .10 | .05 | –.10 | –.35** | .13† | –.05 | .21** | |
| 5. Organizational multiculturalism | 4.31 | 1.36 | .89 | .09 | .01 | –.19† | –.06 | .06 | –.04 | .06 | |
| 6. Job satisfaction | 5.30 | 1.36 | .92 | –.02 | .04 | .01 | .06 | .39*** | –.78*** | .16* | |
| 7. Intention to quit | 2.42 | 1.52 | .92 | –.08 | –.19 | .07 | –.02 | –.35** | –.74*** | –.16* | |
| 8. Dual identity | 20.53 | 10.99 | (.93)a (.90)b | .01 | –.03 | –.19 | .16 | .50*** | .36** | –.34** |
[i] Note: Mean, Standard Deviation and Reliability estimates (α) calculated on the total sample (N = 261). Origin was coded 1 = Belgian and –1 other. Gender was coded 1 = males and –1 females. Level of education was coded 1 = low educated, 2 = medium educated and 3 = high educated. a Cronbach’s alpha for Group Identity; b Cronbach’s alpha for Organizational Identity. Coefficients of the majority group (N = 184) appear above the diagonal and of the minority group (N = 77) appear below the diagonal.
* p < .05; ** p < .01; *** p < .001, † p < .10.
Table 3
Fit indices for Multigroup SEM analyses.
| Model | χ2 | Df | Δ χ2 (Δ df) | χ2/df | RMSEA | CFI | NNFI | Model comparison |
|---|---|---|---|---|---|---|---|---|
| Model 1 (hypothesized) | 1904.25 | 793 | – | 2.40 | .10 | .90 | .89 | |
| Model 2: adds path between MC and JS | 1897.52 | 792 | 6.73 (1) | 2.39 | .10 | .90 | .89 | Model 1 vs Model 2 |
| Model 3: adds path between MC and IQ | 1894.93 | 791 | 2.59 (1) | 2.39 | .10 | .90 | .89 | Model 2 vs Model 3 |
| Model 4: adds path between AS and JS | 1896.71 | 791 | 0.81 (1) | 2.40 | .10 | .90 | .89 | Model 2 vs Model 4 |
| Model 5: adds path between AS and IQ | 1897.16 | 791 | 0.36 (1) | 2.40 | .10 | .90 | .89 | Model 2 vs Model 5 |
[i] Note: N = 261. MC = organizational multiculturalism; AS = organizational assimilation; JS = job satisfaction; IQ = intention to quit; χ2 = Chi-square Test; df = degree of freedom; Δ χ2 = Chi2 difference tests between the best fitting model and alternative models; χ2/df = Chi2 goodness of fit to degrees of freedom ratio; RMSEA = Root Mean Square Error of Approximation; CFI = comparative fit index; NNFI = Non-normed fit index.
Table 4
Results of Multigroup analyses.
| Model | χ2 | Df | CFI | NNFI | RMSEA | Δ χ2 | p |
|---|---|---|---|---|---|---|---|
| Model 1 (groups equivalent) | 1904.25 | 793 | .90 | .89 | .10 | ||
| Model 2 (groups different on the path MC-DI) | 1891.44 | 790 | .90 | .89 | .10 | 12.81 | <.05 |
| Model 3 (groups different on the path MC-AS-DI) | 1891.69 | 789 | .90 | .89 | .10 | –0.25 | ns |
[i] Note: N = 261. MC = organizational multiculturalism; DI = dual identity; AS = organizational assimilation; χ2 = Chi-square Test; df = degree of freedom; GFI = Goodness of Fit Index; NFI = Normed Fit Index; NNFI = Non-normed fit index; RMSEA = Root Mean Square Error of Approximation.
These results suggest a moderating effect of origin on the relationship between organizational multiculturalism and dual identity, with a positive and significantly stronger path between organizational multiculturalism and dual identity for the minority group (β = .49, p < .001) compared with the majority group (β = .16, p < .05) (see Figure 2). Contrary to our expectations, the effects of organizational assimilation are not moderated by origin since paths do not significantly differ from majority to minority participants.
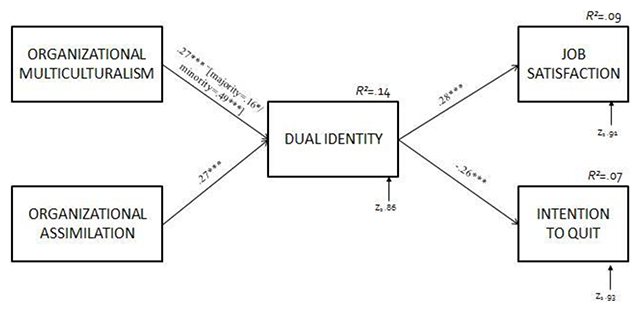
Figure 2
Standardized Path Coefficients for the model identified.
Table 5
Conditional Indirect Effects Multiculturalism on work outcomes.
| Level of moderator | Indirect effect | Boot SE | Boot LL CI | Boot UL CI |
|---|---|---|---|---|
| Multiculturalism ➔ Dual Identity ➔ Satisfaction | ||||
| Minority group | .10 | .04 | .03 | .19 |
| Majority group | .01 | .02 | –.02 | .05 |
| Multiculturalism ➔ Dual Identity ➔ Intention to quit | ||||
| Minority group | –.10 | .05 | –.21 | –.03 |
| Majority group | –.01 | .02 | –.06 | .02 |
[i] Note: Number of bootstrap samples for bias corrected bootstrap confidence intervals: 5,000. Level of confidence for all confidence intervals: 95 per cent. SE = standard error, LL = lower level, CI = confidence interval, UL = upper level, SD = standard deviation.