
Table 1
Intercorrelations and Descriptive Statistics for all Study Variables.
| 1 | 2 | 3 | 4 | 5 | 6 | 7 | 8 | 9 | ||||||||
|---|---|---|---|---|---|---|---|---|---|---|---|---|---|---|---|---|
| Pretest | ||||||||||||||||
| 1. State self-esteem | — | |||||||||||||||
| 2. State positive affect | .32 | *** | — | |||||||||||||
| 3. State negative affect | –.58 | *** | –.13 | — | ||||||||||||
| Posttest | ||||||||||||||||
| 4. State self-esteem | .69 | *** | .21 | * | –.47 | *** | — | |||||||||
| 5. State positive affect | .26 | ** | .59 | *** | –.07 | .59 | *** | — | ||||||||
| 6. State negative affect | –.50 | *** | –.10 | .72 | *** | –.75 | *** | –.37 | *** | — | ||||||
| 7. Future participation | .08 | .08 | –.05 | .15 | .23 | ** | –.11 | — | ||||||||
| 8. Difficulty level | .04 | .14 | –.01 | .26 | ** | .36 | *** | –.24 | ** | .07 | — | |||||
| 9. Actual score | –.11 | –.01 | .10 | .35 | *** | .47 | *** | –.32 | *** | .16 | .60 | *** | — | |||
| M | 5.20 | 3.06 | 1.66 | 5.04 | 2.88 | 1.68 | 1.61 | 3.60 | 9.89 | |||||||
| SD | 0.99 | 0.54 | 0.57 | 1.18 | 0.77 | 0.72 | 0.52 | 1.07 | 4.61 | |||||||
| Cronbach α | .85 | .82 | .86 | .88 | .90 | .90 | — | — | — | |||||||
[i] Note. * p < .05. ** p < .01. *** p < .001.
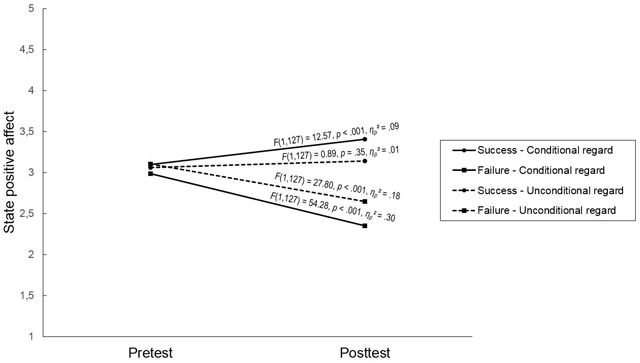
Figure 1
Three-way interaction between Time, Performance, and Regard on state positive affect.