
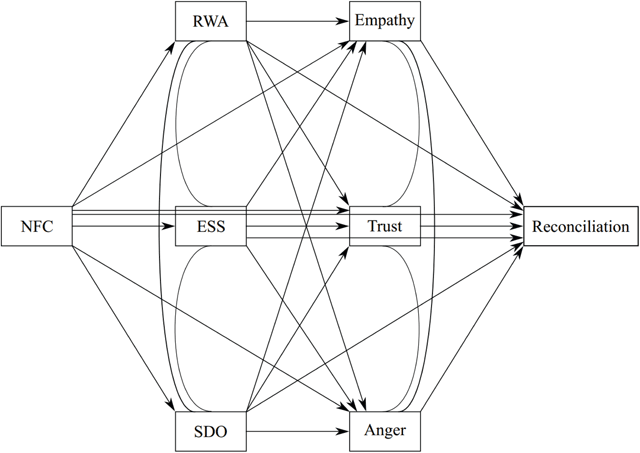
Figure 1
Conceptual Model.
Table 1
Variable Means, Standard Deviations (SD), Cronbach’s αs and Correlations.
| Mean (SD) | αa | 1 | 2 | 3 | 4 | 5 | 6 | 7 | |
|---|---|---|---|---|---|---|---|---|---|
| FLEMISH SAMPLE | |||||||||
| 1. NFC | 3.75 (0.63) | .82 | |||||||
| 2. RWA | 3.32 (0.91) | .82 | .43*** | ||||||
| 3. Essentialism | 3.70 (0.67) | .75 | .15* | .28*** | |||||
| 4. SDO | 2.91 (0.95) | .88 | .14* | .46*** | .33*** | ||||
| 5. Empathy | 4.62 (1.04) | .30*** | –.23*** | –.32*** | –.24*** | –.25*** | |||
| 6. Trust | 5.01 (0.88) | .47*** | –.17** | –.23*** | –.24*** | –.28*** | .53*** | ||
| 7. Anger | 2.75 (1.32) | .52*** | .26*** | .28*** | .20*** | .18** | –.31*** | –.32*** | |
| 8. Reconciliation | 5.45 (0.73) | .83 | –.14* | –.27*** | –.28*** | –.35*** | .52*** | .70*** | –.33*** |
| WALLOON SAMPLE | |||||||||
| 1. NFC | 3.54 (0.64) | .79 | |||||||
| 2. RWA | 3.51 (0.78) | .73 | .35*** | ||||||
| 3. Essentialism | 3.82 (0.67) | .75 | .16** | .19*** | |||||
| 4. SDO | 2.83 (0.86) | .83 | .08 | .37*** | .18*** | ||||
| 5. Empathy | 4.21 (1.01) | .23*** | –.06 | –.22*** | –.14** | –.16** | |||
| 6. Trust | 4.68 (1.05) | .48*** | –.10† | –.24*** | –.13* | –.25*** | .57*** | ||
| 7. Anger | 3.76 (1.28) | .66*** | .17** | .27*** | .14** | .04 | –.37*** | –.33*** | |
| 8. Reconciliation | 5.13 (0.70) | .79 | –.08 | –.27*** | –.18** | –.44*** | .48*** | .54*** | –.27*** |
[i] Notes: †: p < .10; *: p < .05; **: p < .01; ***: p < .001.
a: for two-item measures, the inter-item correlation is provided instead of α.
Table 2
Measurement Invariance: Multi-group CFA fit indices.
| Model Description | χ2 | Scaling Factor | df | Δχ2 | Δdf | p | SRMR | RMSEA | ΔSRMR | ΔRMSE |
|---|---|---|---|---|---|---|---|---|---|---|
| Model 1 (configural invariance) | 7622.26 | 1.13 | 3760 | <.001 | .084 | .057 | ||||
| Model 2 (metric invariance) | 7821.02 | 1.13 | 3818 | 198.76 | 58 | <.001 | .089 | .057 | .005 | <.001 |
| Model 3 (scalar invariance) | 9689.86 | 1.05 | 3876 | 1868.84 | 58 | <.001 | .095 | .069 | .006 | .012 |
| Model 4 (strict factorial invariance) | 9766.97 | 1.05 | 3881 | 77.11 | 5 | <.001 | .096 | .069 | .001 | <.001 |
[i] Note: χ2 refers to the Satorra-Bentler scaled chi-square statistic. SRMR: Standardized Root Mean square Residual. RMSEA: Root Mean Square of Error of Approximation.
Table 3
SEM: Coefficients of the Structural Model.
| Regressions: | Flemish Sample (N = 310) | Walloon Sample (N = 329) | |||||||
|---|---|---|---|---|---|---|---|---|---|
| From | To | Est. | SE | Std. Est. | p | Est. | SE | Std. Est. | p |
| Empathy | Reconciliation | 0.086 | 0.023 | 0.303 | <.001 | 0.077 | 0.023 | 0.278 | .001 |
| Trust | Reconciliation | 0.158 | 0.035 | 0.557 | <.001 | 0.082 | 0.023 | 0.298 | <.001 |
| Anger | Reconciliation | –0.023 | 0.011 | –0.080 | .040 | –0.029 | 0.014 | –0.104 | .044 |
| RWA | Reconciliation | 0.007 | 0.023 | 0.022 | .775 | –0.005 | 0.025 | –0.016 | .826 |
| SDO | Reconciliation | –0.023 | 0.020 | –0.070 | .265 | –0.115 | 0.034 | –0.329 | .001 |
| ESS | Reconciliation | –0.069 | 0.029 | –0.153 | .017 | –0.017 | 0.023 | –0.041 | .470 |
| NFC | Reconciliation | 0.061 | 0.030 | 0.119 | .043 | –0.008 | 0.029 | –0.017 | .773 |
| RWA | Empathy | –0.259 | 0.101 | –0.246 | .010 | –0.202 | 0.088 | –0.163 | .021 |
| SDO | Empathy | –0.055 | 0.092 | –0.048 | .552 | –0.129 | 0.091 | –0.102 | .178 |
| ESS | Empathy | –0.337 | 0.121 | –0.213 | .005 | –0.128 | 0.095 | –0.086 | .157 |
| NFC | Empathy | –0.066 | 0.128 | –0.036 | .608 | 0.051 | 0.110 | 0.029 | .645 |
| RWA | Trust | –0.028 | 0.084 | –0.027 | .737 | –0.138 | 0.101 | –0.112 | .172 |
| SDO | Trust | –0.247 | 0.112 | –0.217 | .002 | –0.276 | 0.095 | –0.217 | .004 |
| ESS | Trust | –0.214 | 0.080 | –0.136 | .057 | –0.075 | 0.113 | –0.050 | .510 |
| NFC | Trust | –0.144 | 0.109 | –0.080 | .178 | –0.67 | 0.130 | –0.038 | .609 |
| RWA | Anger | 0.305 | 0.130 | 0.290 | .019 | 0.474 | 0.127 | 0.383 | <.001 |
| SDO | Anger | –0.122 | 0.112 | –0.107 | .275 | –0.205 | 0.116 | –0.162 | .076 |
| ESS | Anger | 0.414 | 0.160 | 0.262 | .010 | 0.208 | 0.144 | 0.139 | .149 |
| NFC | Anger | 0.302 | 0.170 | 0.167 | .076 | 0.107 | 0.155 | 0.062 | .491 |
| NFC | RWA | .708 | 0.140 | 0.413 | <.001 | 0.502 | 0.118 | 0.359 | <.001 |
| NFC | SDO | .077 | 0.106 | 0.049 | .465 | 0.027 | 0.087 | 0.020 | .758 |
| NFC | ESS | .178 | 0.088 | 0.156 | .043 | 0.291 | 0.090 | 0.251 | .001 |
| Covariances: | Flemish Sample (N = 310) | Walloon Sample (N = 329) | |||||||
| From | To | Est. | SE | Std. Est. | p | Est. | SE | Std. Est. | P |
| Empathy | Trust | 0.360 | 0.051 | 0.360 | <.001 | 0.477 | 0.066 | 0.477 | <.001 |
| Empathy | Anger | –0.222 | 0.074 | –0.222 | <.001 | –0.405 | 0.078 | –0.405 | <.001 |
| Trust | Anger | –0.257 | 0.062 | –0.257 | <.001 | –0.319 | 0.085 | –0.319 | <.001 |
| RWA | SDO | 0.376 | 0.064 | 0.496 | <.001 | 0.199 | 0.045 | 0.336 | <.001 |
| RWA | ESS | 0.194 | 0.044 | 0.358 | <.001 | 0.112 | 0.039 | 0.229 | .004 |
| SDO | ESS | 0.211 | 0.046 | 0.385 | <.001 | 0.091 | 0.040 | 0.179 | .023 |
[i] Note: NFC: need for closure; ESS: essentialism; RWA: right-wing authoritarianism; SDO: social dominance orientation.
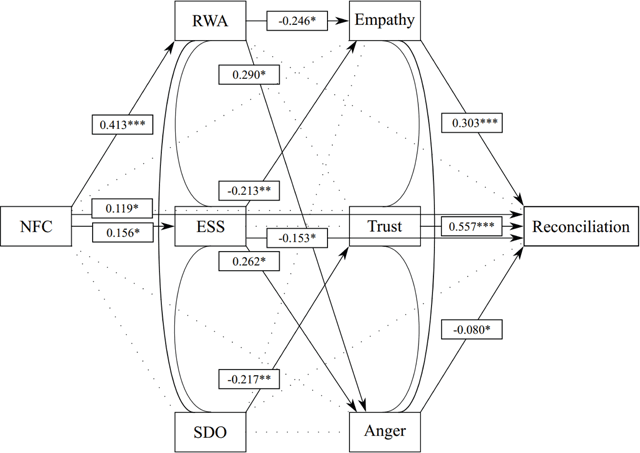
Figure 2
Flemish Model. Note: Coefficients denote standardized parameter estimates.
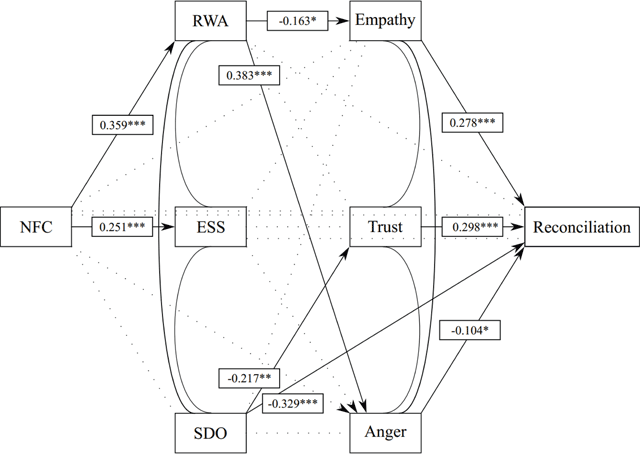
Figure 3
Walloon Model. Note: Coefficients denote standardized parameter estimates.