
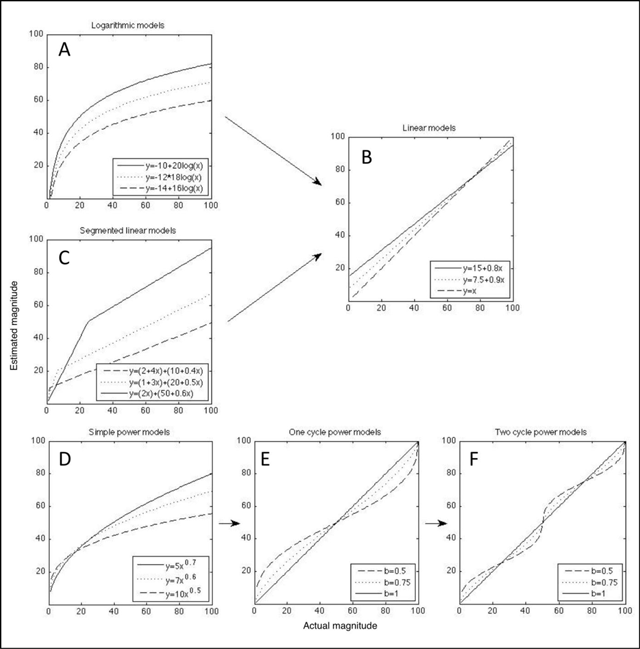
Figure 1
Predicted estimation data for the three developmental accounts of number line estimation: the log-to-lin account (A-B), the twolin-to-linear account (C-B) and the proportion judgment account, consisting of a transformation of a power model (D), over a one-cycle power model (E), to a two-cycle power model (F). Each model is presented with a combination of three parameters.
Table 1
Mean percentages of absolute error (PAE) (and the corresponding standard deviations) on the symbolic and the non-symbolic number line estimation tasks, per grade.
| Symbolic number line estimation task | Non-symbolic number line estimation task | |
|---|---|---|
| 1st grade | 11.48 (4.93) | 19.46 (5.48) |
| 2nd grade | 7.83 (3.83) | 13.52 (4.82) |
| 6th grade | 3.08 (1.04) | 8.36 (3.13) |
Table 2
Percentage of children whose symbolic number line estimation pattern is best described by a specific model and the corresponding mean ΔAICc (SD in parentheses), for each developmental account and per grade.
| 1 | 2 | 6 | ||||
|---|---|---|---|---|---|---|
| Model | % children | Mean ΔAICc | % children | Mean ΔAICc | % children | Mean ΔAICc |
| Log-Lin Account | ||||||
| Log | 63 | 7.74 (4.15) | 31 | 7.20 (4.15) | 0 | – |
| Lin | 37 | 11.82 (7.49) | 69 | 13.94 (7.49) | 100 | 27.29 (7.58) |
| 2Lin-Lin Account | ||||||
| 2Lin | 37 | 5.77 (4.06) | 19 | 6.68 (4.86) | 13 | 4.42 (3.65) |
| Lin | 63 | 4.71 (2.21) | 81 | 6.02 (2.74) | 87 | 6.67 (2.02) |
| Proportion Judgement Account | ||||||
| Pow | 47 | 5.23 (6.52) | 36 | 4.13 (5.17) | 30 | 4.64 (5.38) |
| n -Cycle | 53 | 3.20 (2.45) | 64 | 4.20 (3.65) | 70 | 4.32 (3.10) |
[i] Note. ΔAICc is the difference in Aikaike’s Information Criterium corrected for small samples between the best model and the other model(s) in the same developmental account.
Table 3
Percentage of children whose symbolic number line estimation pattern is best described by a specific account in comparison to another account with the corresponding mean ΔAICc (SD in parentheses), per grade.
| Log-Lin | 2Lin-Lin | Prop | Mean | |||||
|---|---|---|---|---|---|---|---|---|
| Best Account | % children | MeanΔAICc | % children | Mean ΔAICc | % children | Mean ΔAICc | % children | Mean ΔAICc |
| 1st Grade | ||||||||
| Log-Lin | – | – | 40 | 6.02 (2.41) | 40 | 3.61 (2.63) | 40 | 4.81 (2.78) |
| 2Lin-Lin | 7 | 1.57 (1.34) | – | – | 7 | 2.88 (2.25) | 7 | 2.22 (1.69) |
| Prop | 53 | 2.85 (2.39) | 53 | 3.70 (2.35) | – | – | 53 | 3.30 (2.38) |
| 2nd Grade | ||||||||
| Log-Lin | – | – | 17 | 6.51 (2.78) | 25 | 2.90 (3.15) | 21 | 4.35 (3.43) |
| 2Lin-Lin | 0 | – | – | – | 8 | 3.93 (0.78) | 4 | 3.93 (0.78) |
| Prop | 75 | 4.91 (3.61) | 75 | 4.66 (2.78) | – | – | 75 | 4.79 (3.19) |
| 6th Grade | ||||||||
| Log-Lin | – | – | 0 | – | 20 | 0.81 (0.88) | 10 | 0.81 (0.88) |
| 2Lin-Lin | 5 | 5.55 (6.09) | – | – | 25 | 1.08 (0.96) | 15 | 2.11 (2.87) |
| Prop | 75 | 4.04 (2.86) | 75 | 3.67 (2.69) | – | – | 75 | 3.85 (2.92) |
[i] Note. AICc = Aikaike’s Information Criterium corrected for small samples. The rows display the percentage of children whose estimation pattern is best described by a specific account, together with the mean ΔAICc, reflecting the strength of evidence in favour of this account compared to each of the other two accounts (columns), respectively.
Table 4
Percentage of children whose non-symbolic number line estimation pattern is best described by a specific model and the corresponding mean ΔAICc (SD in parentheses), for each developmental account and per grade.
| 1 | 2 | 6 | ||||
|---|---|---|---|---|---|---|
| Model | % children | Mean ΔAICc | % children | Mean ΔAICc | % children | Mean ΔAICc |
| Log-Lin Account | ||||||
| Log | 78 | 11.80 (4.51) | 48 | 6.48 (4.16) | 23 | 5.49 (4.12) |
| Lin | 22 | 6.35 (6.65) | 52 | 8.80 (6.57) | 67 | 12.95 (9.91) |
| 2Lin-Lin Account | ||||||
| 2Lin | 72 | 12.10 (8.15) | 56 | 8.19 (6.72) | 33 | 5.14 (3.90) |
| Lin | 28 | 3.16 (2.47) | 44 | 2.44 (1.14) | 67 | 7.12 (2.26) |
| Proportion Judgement Account | ||||||
| Pow | 88 | 10.15 (4.64) | 82 | 7.72 (5.76) | 72 | 7.90 (5.73) |
| n-Cycle | 12 | 3.13 (1.53) | 18 | 4.14 (3.80) | 28 | 3.46 (3.64) |
[i] Note. ΔAICc is the difference in Aikaike’s Information Criterium corrected for small samples between the best model and the other model(s) in the same developmental account.
Table 5
Percentage of children whose non-symbolic number line estimation pattern is best described by a specific account in comparison to another account, with the corresponding mean ΔAICc (SD in parentheses), per grade.
| Log-Lin | 2Lin-Lin | Prop | Mean | |||||
|---|---|---|---|---|---|---|---|---|
| Best Account | % children | Mean ΔAICc | % children | Mean ΔAICc | % children | Mean ΔAICc | % children | Mean ΔAICc |
| 1st Grade | ||||||||
| Log-Lin | – | – | 41 | 4.33 (2.71) | 41 | 5.32 (2.87) | 41 | 4.83 (2.78) |
| 2Lin-Lin | 28 | 5.75 (6.00) | – | – | 28 | 13.21 (6.48) | 28 | 9.48 (7.17) |
| Prop | 31 | 3.12 (2.27) | 31 | 4.32 (3.28) | – | – | 31 | 3.72 (2.81) |
| 2nd Grade | ||||||||
| Log-Lin | – | – | 15 | 3.67 (2.64) | 32 | 2.36 (2.20) | 24 | 2.59 (2.30) |
| 2Lin-Lin | 24 | 4.09 (3.17) | – | – | 47 | 4.40 (5.17) | 35 | 4.30 (4.53) |
| Prop | 41 | 5.31 (4.36) | 38 | 3.90 (2.46) | – | – | 41 | 4.63 (3.58) |
| 6th Grade | ||||||||
| Log-Lin | – | – | 8 | 5.36 (1.70) | 28 | 1.62 (2.30) | 18 | 3.49 (2.65) |
| 2Lin-Lin | 10 | 6.16 (3.97) | – | – | 31 | 2.39 (2.84) | 21 | 3.33 (3.45) |
| Prop | 62 | 3.67 (3.42) | 62 | 3.30 (2.70) | – | – | 62 | 3.49 (1.33) |
[i] Note. AICc = Aikaike’s Information Criterium corrected for small samples. The rows display the percentage of children whose estimation pattern is described best by a specific account, together with the mean ΔAICc, reflecting the strength of evidence in favour of this account compared to each of the other two accounts (columns), respectively.
Table 6
Percentage of children whose symbolic number line estimation pattern is best described by a specific model and the corresponding mean ΔAICc (SD in parentheses), for each developmental account, per grade and per cohort.
| Grade 1 | Grade 2 | |||
|---|---|---|---|---|
| Model | % children | Mean ΔAICc | % children | Mean ΔAICc |
| Log-Lin Account | ||||
| Log | 60 | 6.80 (2.71) | 30 | 3.94 (3.59) |
| Lin | 40 | 11.82 (7.49) | 70 | 20.30 (8.26) |
| 2Lin-Lin Account | ||||
| 2Lin | 33 | 5.04 (3.54) | 26 | 8.91 (7.02) |
| Lin | 67 | 4.83 (2.11) | 74 | 11.80 (8.52) |
| Proportion Judgement Account | ||||
| Pow | 41 | 3.53 (3.10) | 44 | 4.09 (3.41) |
| n -Cycle | 59 | 3.20 (2.45) | 56 | 4.32 (1.86) |
| Model | Cohort 2 | |||
| Grade 2 | Grade 3 | |||
| % children | Mean ΔAICc | % children | Mean ΔAICc | |
| Log-Lin Account | ||||
| Log | 31 | 7.06 (5.60) | 3 | 10.19 (–) |
| Lin | 69 | 13.79 (7.02) | 97 | 19.74 (9.75) |
| 2Lin-Lin Account | ||||
| 2Lin | 19 | 7.37 (4.94) | 9 | 4.46 (3.91) |
| Lin | 81 | 5.89 (2.80) | 91 | 5.69 (3.47) |
| Proportion Judgement Account | ||||
| Pow | 41 | 4.13 (5.17) | 28 | 7.74 (9.65) |
| n -Cycle | 59 | 4.17 (3.89) | 72 | 3.97 (3.51) |
[i] Note. ΔAICc is the difference in Aikaike’s Information Criterium corrected for small samples between the best model and the other model(s) in the same developmental account.
Table 7
Percentage of children whose symbolic number line estimation pattern is best described by a specific account in comparison to another account with the corresponding mean ΔAICc (SD in parentheses), per grade and per cohort.
| Log-Lin | 2Lin-Lin | Prop | Mean | |||||
|---|---|---|---|---|---|---|---|---|
| Best Account | % children | Mean ΔAICc | % children | Mean ΔAICc | % children | Mean ΔAICc | % children | Mean ΔAICc |
| 1st Grade | ||||||||
| Log-Lin | – | – | 33 | 5.77 (2.76) | 37 | 2.65 (1.70) | 35 | 4.13 (2.72) |
| 2Lin-Lin | 7 | 1.57 (1.34) | – | – | 4 | 4.47 (–) | 6 | 2.53 (1.93) |
| Prop | 59 | 2.85 (2.39) | 59 | 3.76 (2.35) | – | – | 59 | 3.30 (2.38) |
| 2nd Grade | ||||||||
| Log-Lin | – | – | 4 | 12.05 (–) | 15 | 1.29 (0.65) | 9 | 3.44 (4.85) |
| 2Lin-Lin | 19 | 10.31 (6.24) | – | – | 30 | 5.30 (5.67) | 24 | 7.23 (6.18) |
| Prop | 67 | 3.91 (1.99) | 67 | 4.40 (2.15) | – | – | 67 | 4.15 (2.03) |
| Log-Lin | 2Lin-Lin | Prop | Mean | |||||
| Best Account | % children | Mean ΔAICc | % children | Mean ΔAICc | % children | Mean ΔAICc | % children | Mean ΔAICc |
| 2nd Grade | ||||||||
| Log-Lin | – | – | 16 | 6.60 (3.10) | 25 | 3.17 (3.25) | 20 | 4.49 (3.52) |
| 2Lin-Lin | 0 | – | – | – | 25 | 3.17 (3.25) | 11 | 3.17 (3.25) |
| Prop | 69 | 4.91 (3.81) | 69 | 4.63 (2.93) | – | – | 69 | 4.77 (3.67) |
| 3rd Grade | ||||||||
| Log-Lin | – | – | 3 | 7.12 (–) | 16 | 1.74 (1.92) | 9 | 2.64 (2.79) |
| 2Lin-Lin | 3 | 8.87 (–) | – | – | 16 | 2.06 (1.89) | 9 | 3.20 (3.25) |
| Prop | 82 | 4.61 (2.37) | 82 | 4.55 (2.35) | – | – | 82 | 4.60 (2.39) |
[i] Note. AICc = Aikaike’s Information Criterium corrected for small samples. The rows display the percentage of children whose estimation pattern is described best by a specific account, together with the mean ΔAICc, reflecting the strength of evidence in favour of this account compared to each of the other two accounts (columns), respectively.
Table 8
Percentage of children whose non-symbolic number line estimation pattern is best described by a specific model with the corresponding mean ΔAICc (SD in parentheses), for each developmental account, per grade and per cohort.
| Grade 1 | Grade 2 | |||
|---|---|---|---|---|
| Model | % children | Mean ΔAICc | % children | Mean ΔAICc |
| Log-Lin Account | ||||
| Log | 76 | 11.39 (4.51) | 45 | 7.58 (4.57) |
| Lin | 24 | 6.35 (6.65) | 55 | 8.11 (5.95) |
| 2Lin-Lin Account | ||||
| 2Lin | 69 | 12.04 (8.33) | 52 | 7.64 (5.62) |
| Lin | 31 | 3.16 (2.47) | 48 | 5.73 (3.17) |
| Proportion Judgement Account | ||||
| Pow | 86 | 10.00 (4.84) | 83 | 11.42 (5.95) |
| n -Cycle | 14 | 3.13(1.53) | 17 | 3.88 (2.67) |
| Grade 2 | Grade 3 | |||
| Model | % children | Mean ΔAICc | % children | Mean ΔAICc |
| Log-Lin Account | ||||
| Log | 50 | 6.14 (4.06) | 32 | 6.28 (4.62) |
| Lin | 50 | 9.28 (6.68) | 68 | 12.03 (7.20) |
| 2Lin-Lin Account | ||||
| 2Lin | 58 | 7.62 (6.44) | 48 | 6.28 (5.58) |
| Lin | 42 | 2.37 (1.44) | 62 | 5.50 (3.41) |
| Proportion Judgement Account | ||||
| Pow | 87 | 7.60 (5.84) | 84 | 7.69 (4.87) |
| n -Cycle | 13 | 4.96 (4.62) | 16 | 2.33 (1.54) |
[i] Note. ΔAICc is the difference in Aikaike’s Information Criterium corrected for small samples between the best model and the other model(s) in the same developmental account.
Table 9
Percentage of children whose non-symbolic number line estimation pattern is best described by a specific account in comparison to another account with the corresponding mean ΔAICc (SD in parentheses), per grade and per cohort.
| Log-Lin | 2Lin-Lin | Prop | Mean | |||||
|---|---|---|---|---|---|---|---|---|
| Best Account | % children | Mean ΔAICc | % children | Mean ΔAICc | % children | Mean ΔAICc | % children | Mean ΔAICc |
| 1st Grade | ||||||||
| Log-Lin | – | – | 38 | 3.84 (2.55) | 38 | 4.79 (2.50) | 38 | 4.32 (2.51) |
| 2Lin-Lin | 24 | 6.62 (6.62) | – | – | 28 | 12.86 (6.84) | 28 | 9.95 (7.25) |
| Prop | 34 | 3.12 (2.27) | 34 | 4.32 (3.28) | – | – | 34 | 3.72 (2.81) |
| 2nd Grade | ||||||||
| Log-Lin | – | – | 14 | 4.29 (2.81) | 21 | 1.96 (1.75) | 17 | 2.94 (2.41) |
| 2Lin-Lin | 21 | 4.76 (6.09) | – | – | 28 | 4.06 (4.35) | 24 | 4.36 (4.96) |
| Prop | 59 | 3.14 (1.49) | 59 | 2.87 (1.36) | – | – | 59 | 3.01 (1.41) |
| Log-Lin | 2Lin-Lin | Prop | Mean | |||||
| Best Account | % children | Mean ΔAICc | % children | Mean ΔAICc | % children | Mean ΔAICc | % children | Mean ΔAICc |
| 2nd Grade | ||||||||
| Log-Lin | – | – | 16 | 3.67 (2.64) | 32 | 2.57 (2.20) | 25 | 2.75 (2.32) |
| 2Lin-Lin | 23 | 3.72 (3.22) | – | – | 45 | 4.17 (5.03) | 34 | 4.02 (4.43) |
| Prop | 42 | 5.48 (4.49) | 39 | 3.97 (2.56) | – | – | 41 | 4.46 (3.69) |
| 3rd Grade | ||||||||
| Log-Lin | – | – | 19 | 3.65 (0.96) | 35 | 2.13 (2.20) | 28 | 2.66 (1.97) |
| 2Lin-Lin | 13 | 8.65 (2.50) | – | – | 29 | 4.33 (5.95) | 22 | 5.66 (5.43) |
| Prop | 52 | 4.24 (1.89) | 48 | 3.22 (2.14) | – | – | 50 | 3.67 (2.14) |
[i] Note. AICc = Aikaike’s Information Criterium corrected for small samples. The rows display the percentage of children whose estimation pattern is described best by a specific account, together with the mean ΔAICc, reflecting the strength of evidence in favour of this account compared to each of the other two accounts (columns), respectively.