
Table 1
Correlations and descriptive statistics for all variables modelled.
| 1 | 2 | 3 | 4 | 5 | 6 | 7 | 8 | ||
|---|---|---|---|---|---|---|---|---|---|
| 1 | Proximal externally regulated | ||||||||
| 2 | Distal externally regulated | .46** | |||||||
| 3 | Distal internally regulated | .20** | .67** | ||||||
| 4 | Socially regulated | .11* | .54** | .46** | |||||
| 5 | Amotivation | .11** | –.16** | –.43** | –.06 | ||||
| 6 | Deep Approaches | –.08 | .28** | .60** | .30** | –.27** | |||
| 7 | Surface Approaches | .19** | .01 | .19** | .06 | .33** | .32** | ||
| 8 | GPA | –.07 | .07 | .11** | .02 | –.27** | .05 | –.14** | |
| 9 | Gender (female = 1, Male = 2) | –.00 | –.00 | –.13** | –.02 | .14** | –.11** | .00 | –.30** |
| MEAN | 4.31 | 4.02 | 4.09 | 2.85 | 2.7 | 3.52 | 3.88 | 2.21 | |
| SD | .83 | .94 | .85 | .94 | .82 | .67 | .65 | .84 | |
| Cronbach’s Alpha | .74 | .78 | .78 | .78 | .86 | .74 | .60 | / | |
| Items | 4 | 4 | 3 | 4 | 12 | 5 | 5 | 1 |
[i] Note: * p < .05; ** p < .01. Measures 1–9 are measured on a scale of 1–6. GPA is measured on scale 0–4.33. Gender is female = 1 and Male = 2.
Table 2
Fit statistics for four Latent Profile Analysis conducted.
| Two Classes | Three Classes | Four Classes | Five Classes | |
|---|---|---|---|---|
| Akaike Information Criterion (AIC) | 9739.522 | 9573.673 | 9460.874 | 9376.572 |
| Bayesian Information Criterion (BIC) | 9814.152 | 9676.29 | 9591.477 | 9535.162 |
| BIC Sample-Size Adjusted | 9763.344 | 9606.429 | 9502.563 | 9427.195 |
| Vuong-Lo-Mendell-Rubin Likelihood Ratio Test | 0.765 | 0.825 | 0.88 | 0.805 |
| Lo-Mendell-Rubin Likelihood Ratio Test | 0 | 0.1 | 0.1829 | 0.523 |
Table 3
Three Class Finalized Profile and Class-based ANOVA Results.
| Low future oriented (n = 51, 6.5%) | Average (n = 596, 76.0%) | Highly motivated (n = 137, 17.5%) | p | F | R2 | |
|---|---|---|---|---|---|---|
| Goals | ||||||
| Distal internally regulated goals | 3.20a(1.29) | 3.92b(.62) | 5.16c(.54) | < .0001 | 238.77 | .38 |
| Proximal externally regulated goals | 4.00a(1.32) | 4.20b(.73) | 4.89c(.75) | < .0001 | 47.60 | .11 |
| Distal externally regulated goals | 2.09a(.56) | 3.88b(.59) | 5.30c(.50) | < .0001 | 644.96 | .62 |
| Socially regulated goals | 1.53a(.55) | 2.78b(.78) | 3.63c(1.04) | < .0001 | 131.76 | .25 |
| Amotivation | 2.76a(.91) | 2.80a(.77) | 2.28b(.88) | < .0001 | 23.38 | .06 |
| Outcomes | ||||||
| Surface approaches | 3.87ac(.73) | 3.79a(.61) | 3.95bc(.77) | < .05 | 3.38 | .01 |
| Deep approaches | 3.13a(.98) | 3.39b(.57) | 3.80c(.74) | < .0001 | 29.99 | .07 |
| GPA | 2.05a(.86) | 2.20a(.85) | 2.33a(.82) | = .11 | 2.21 | .01 |
| Class N size | 51 | 596 | 137 | |||
| Sample proportion | 6.51% | 76.02% | 17.47% | |||
| Female/Male class N size | 16/35 | 181/415 | 59/78 | |||
| Female/Male N class proportion | 32%/68% | 30%/70% | 43%/57% |
[i] Note: Within row means with different letters are significantly (p < .05) different from each other.
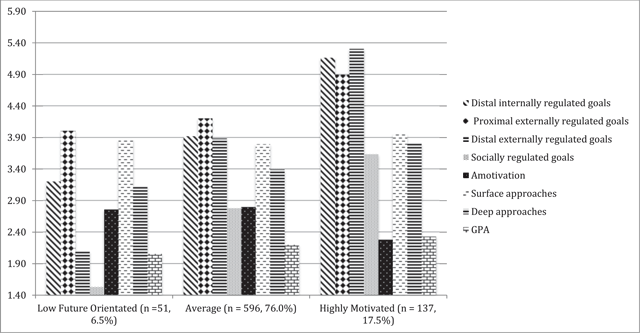
Figure 1
Profiled variables and covariates.
Note: All variables presented, except GPA, are measured on a scale of one to six. GPA is measured on a scale of 0 to 4.33.