
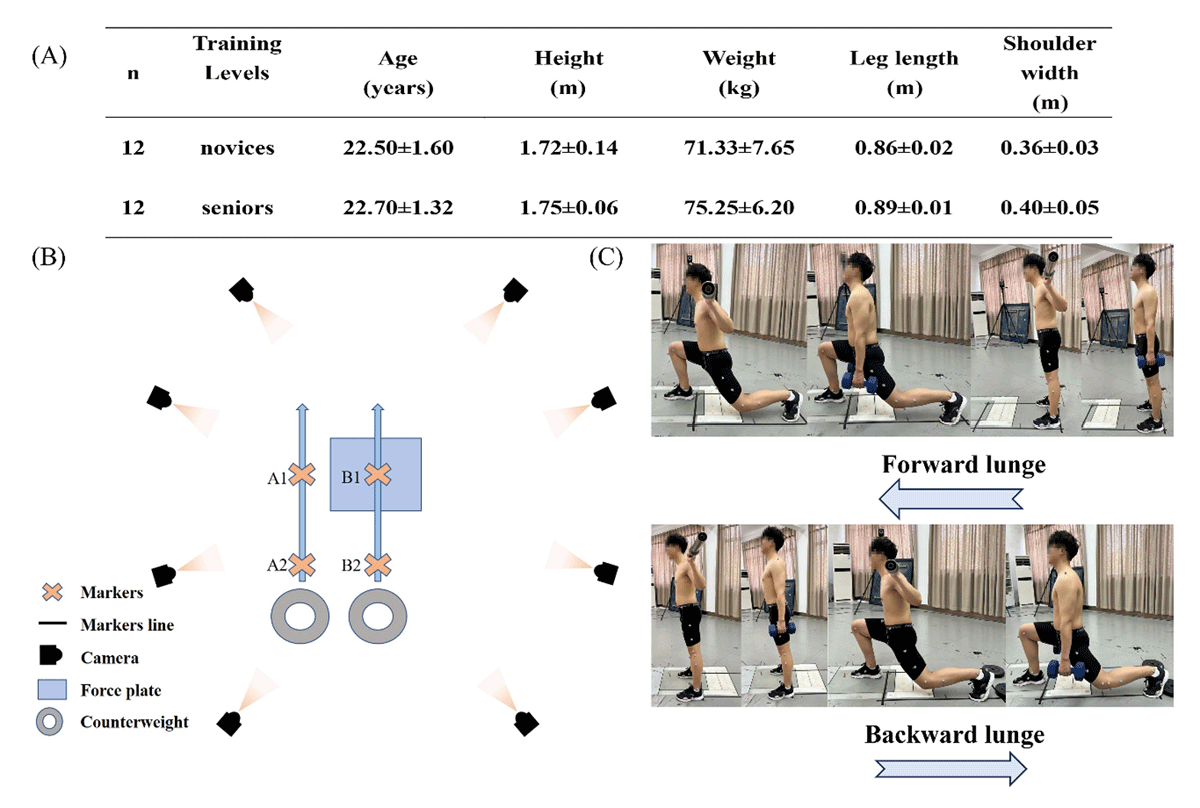
Figure 1
(A) Participants’ basic information; (B) Experimental site design; (C) Schematic of experimental movements.
Table 1
Joint ROM and peak angles during Sagittal and Horizontal plane forward and backward lunges.
| ANGLE | FORWARD | BACKWARD | |||||
|---|---|---|---|---|---|---|---|
| SENIOR | NOVICE | SENIOR | NOVICE | ||||
| Hip | S | Max | B | 91.02 ± 8.18 | 93.38 ± 19.14 | 94.94 ± 2.57ab | 101.01 ± 2.32ab |
| D | 87.72 ± 9.14 | 93.05 ± 16.56 | 92.47 ± 5.22ab | 99.71 ± 4.02ab | |||
| Min | B | 42.06 ± 11.78a | 29.16 ± 7.83a | 62.21 ± 4.07 | 62.54 ± 4.96 | ||
| D | 42.06 ± 12.78a | 30.98 ± 8.69a | 62.00 ± 3.65 | 62.09 ± 4.70 | |||
| Rom | B | 48.96 ± 4.11a | 64.23 ± 16.27a | 32.74 ± 3.56a | 38.47 ± 6.56a | ||
| D | 45.07 ± 4.21a | 62.07 ± 16.46a | 30.47 ± 4.53a | 37.62 ± 6.90a | |||
| H | Max | B | 2.37 ± 2.45 | 4.04 ± 5.26 | 3.06 ± 2.89 | 4.52 ± 2.48 | |
| D | 2.93 ± 3.22 | 4.37 ± 6.62 | 4.12 ± 0.99 | 4.31 ± 0.93 | |||
| Min | B | –4.97 ± 3.96b | –5.94 ± 5.25b | –2.92 ± 3.25a | –3.39 ± 3.67a | ||
| D | –2.00 ± 3.30b | –3.75 ± 7.14b | –1.55 ± 2.31a | –4.41 ± .237a | |||
| Rom | B | 7.34 ± 2.28ab | 9.99 ± 2.30ab | 5.98 ± 1.97a | 7.91 ± 3.48a | ||
| D | 4.93 ± 1.11ab | 8.12 ± 1.79ab | 5.67 ± 2.19a | 8.71 ± 2.41a | |||
| Knee | S | Max | B | –22.17 ± 3.69ab | –14.86 ± 5.20ab | –60.61 ± 5.09ab | –49.55 ± 9.64ab |
| D | –22.80 ± 3.62ab | –19.03 ± 4.70ab | –65.46 ± 5.03ab | –57.27 ± 7.56ab | |||
| Min | B | –120.71 ± 6.08 | –125.68 ± 9.83 | –108.44 ± 8.33ab | –99.01 ± 10.02ab | ||
| D | –120.16 ± 7.53 | –125.10 ± 10.00 | –114.56 ± 8.48ab | –104.80 ± 7.45ab | |||
| Rom | B | 98.55 ± 9.16a | 110.82 ± 13.36a | 47.83 ± 7.24 | 49.46 ± 16.69 | ||
| D | 97.36 ± 10.24a | 106.08 ± 13.22a | 49.11 ± 8.84 | 47.53 ± 12.64 | |||
| H | Max | B | 12.08 ± 3.88b | 9.63 ± 1.4b | 11.85 ± 2.27a | 7.87 ± 5.67a | |
| D | 14.09 ± 4.04b | 10.71 ± 1.49b | 13.40 ± 2.17a | 7.81 ± 6.09a | |||
| Min | B | –7.52 ± 3.32a | –12.60 ± 5.76a | 5.90 ± 3.70a | 1.17 ± 7.09a | ||
| D | –7.46 ± 3.79a | –11.23 ± 7.02a | 6.60 ± 3.58a | –1.23 ± 10.24a | |||
| Rom | B | 19.60 ± 5.58a | 15.23 ± 6,42a | 5.95 ± 2.38 | 6.69 ± 3.76 | ||
| D | 21.55 ± 4.88a | 15.95 ± 7.90a | 6.80 ± 2.24 | 9.05 ± 5.22 | |||
| Ankle | S | Max | B | 29.61 ± 5.05a | 34.67 ± 7.85a | 25.14 ± 5.65b | 23.89 ± 5.23b |
| D | 26.39 ± 5.30a | 33.75 ± 6.79a | 22.52 ± 5.17b | 21.24 ± 4.09b | |||
| Min | B | –1.74 ± 4.24b | –5.07 ± 4.79b | 16.20 ± 4.41a | 13.30 ± 6.20a | ||
| D | 0.09 ± 4.05b | –0.60 ± 5.12b | 16.34 ± 2.36a | 13.29 ± 3.65a | |||
| Rom | B | 31.36 ± 6.92a | 39.74 ± 8.05a | 8.93 ± 3.02b | 10.59 ± 4.01b | ||
| D | 26.30 ± 6.72a | 33.75 ± 6.79a | 6.17 ± 3.29b | 7.95 ± 5.20b | |||
[i] Note: a Indicates significant difference in the main effect of training experience, b Indicates significant difference in the main effect of load position, P < 0.05. S, Sagittal plane; H, Horizontal plane. B, barbell; D, dumbbell. (°)
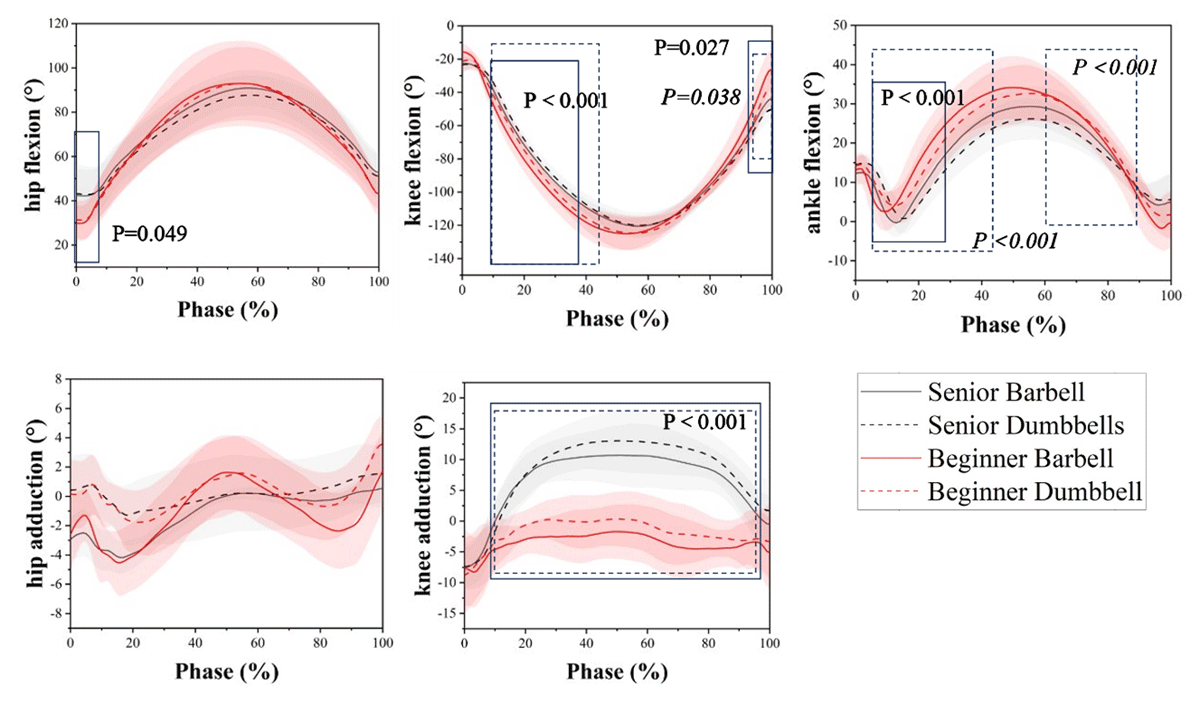
Figure 2
Kinematics of the lunge squat hip joint in different time frames of the population at different load position during the forward lunge; the solid line shows the comparison between novices and experienced users of barbell loads; the dotted line shows the comparison between novices and experienced users of dumbbell loads, significance in italics.
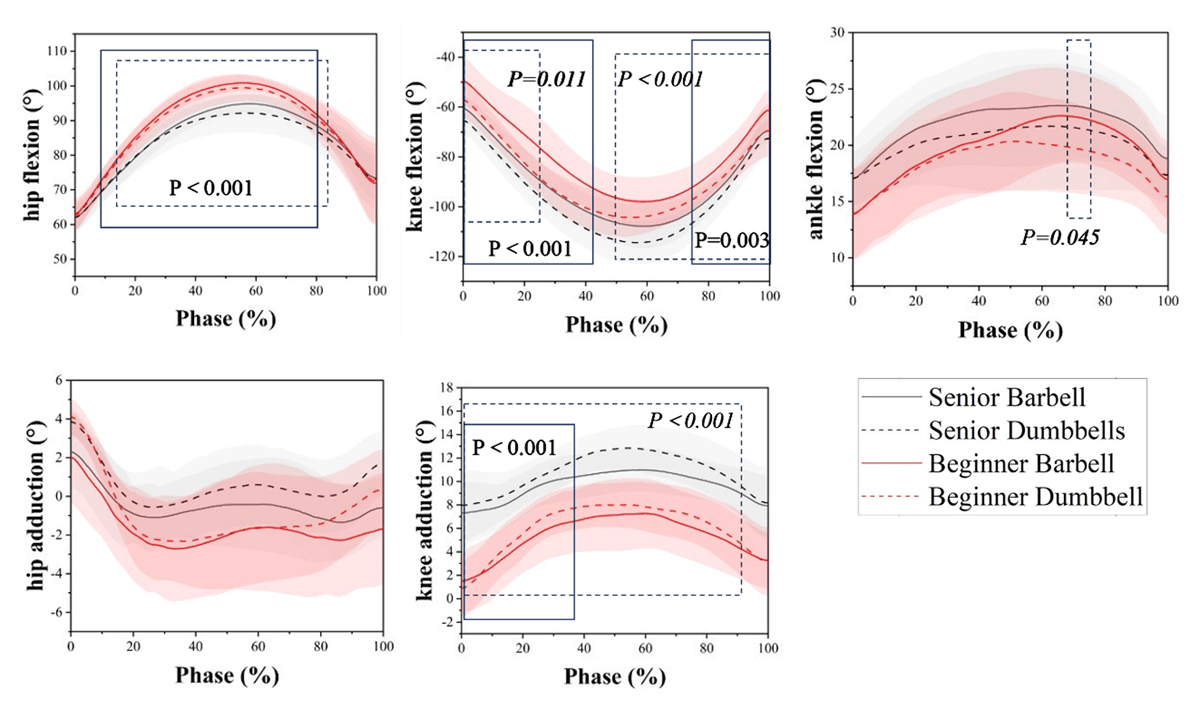
Figure 3
Kinematics of the lunge squat hip joint in different time frames of the population at different load position during the backward lunge; the solid line shows the comparison between novices and experienced users of barbell loads; the dotted line shows the comparison between novices and experienced users of dumbbell loads, significance in italics.
Table 2
Peak joint moments during Sagittal and Horizontal plane forward and backward lunges.
| MOMENT | FORWARD | BACKWARD | ||||
|---|---|---|---|---|---|---|
| SENIOR | NOVICE | SENIOR | NOVICE | |||
| Hip | S | B | –3.24 ± 0.45a | –2.47 ± 0.72a | –2.65 ± 0.68b | –2.52 ± 0.86b |
| D | –3.18 ± 0.55a | –2.45 ± 0.58a | –2.43 ± 0.28b | –2.19 ± 0.46b | ||
| H | B | 0.31 ± 0.10 | 0.28 ± 0.21 | –0.03 ± 0.11b | –0.07 ± 0.06b | |
| D | 0.33 ± 0.05 | 0.27 ± 0.14 | 0.02 ± 0.11b | 0.01 ± 0.12b | ||
| Knee | S | B | 2.19 ± 0.33 | 2.04 ± 0.25 | 1.61 ± 0.37 | 1.58 ± 0.66 |
| D | 2.18 ± 0.39 | 2.00 ± 0.28 | 1.62 ± 0.36 | 1.53 ± 0.73 | ||
| H | B | 0.08 ± 0.05a | 0.12 ± 0.09a | –0.07 ± 0.08b | –0.10 ± 0.07b | |
| D | 0.08 ± 0.04a | 0.13 ± 0.08a | –0.15 ± 0.12b | –0.13 ± 0.05b | ||
| Angle | S | B | –1.40 ± 0.40a | –1.16 ± 0.22a | –0.82 ± 0.28 | –0.79 ± 0.18 |
| D | –1.26 ± 0.43a | –1.14 ± 0.17a | –0.83 ± 0.19 | –0.70 ± 0.15 | ||
[i] Note: a Indicates significant difference in the main effect of training experience, b Indicates significant difference in the main effect of load position, P < 0.05. S, Sagittal plane; H, Horizontal plane. B, barbell; D, dumbbell. (Nm/kg)
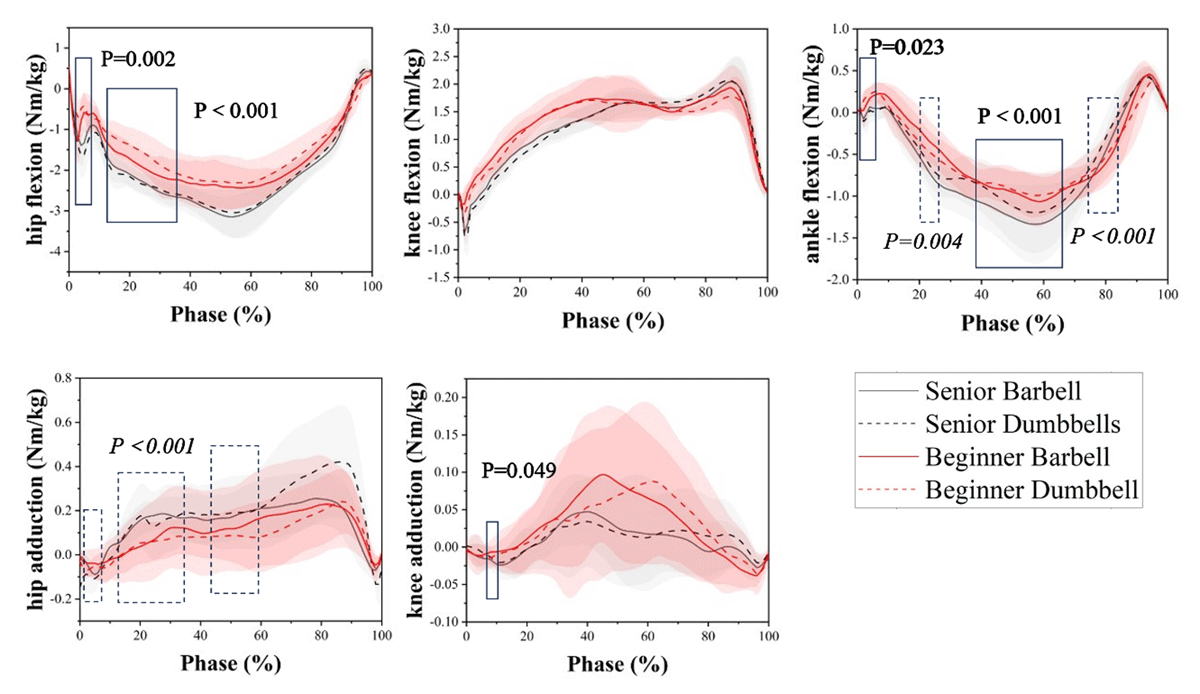
Figure 4
Dynamics of the lunge squat hip joint in different time frames of the population at different load position during the forward lunge; the solid line shows the comparison between novices and experienced users of barbell loads; the dotted line shows the comparison between novices and experienced users of dumbbell loads, significance in italics.
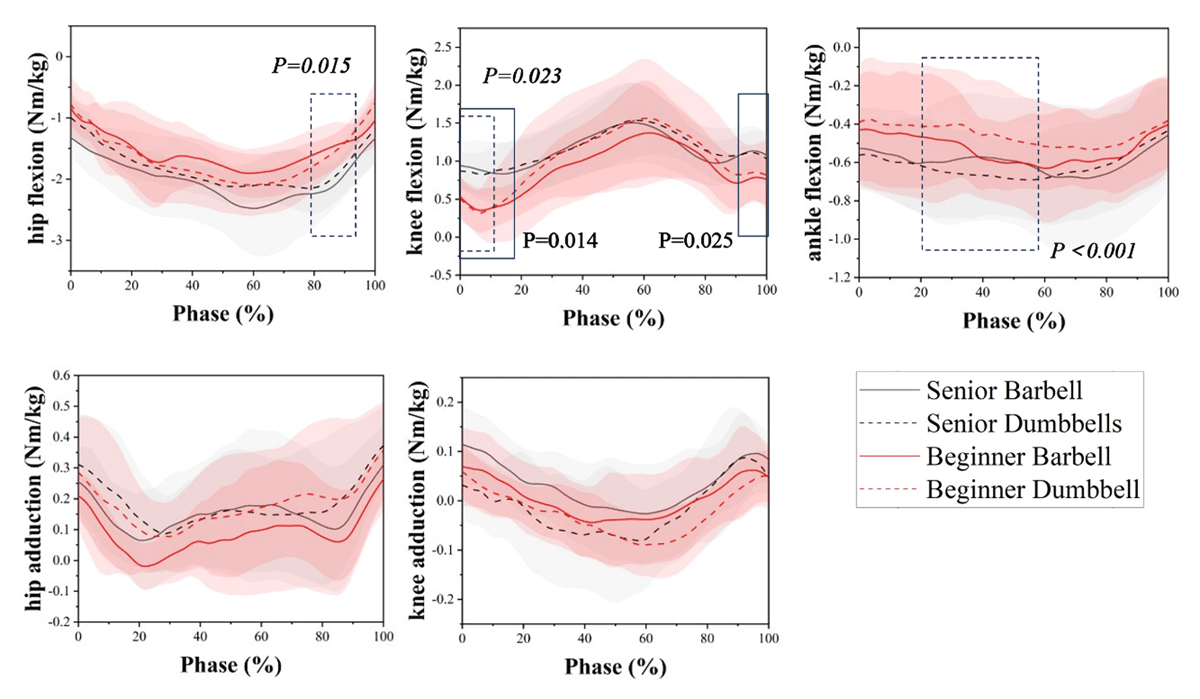
Figure 5
Dynamics of the lunge squat hip joint in different time frames of the population at different load position during the back lunge; the solid line shows the comparison between novices and experienced users of barbell loads; the dotted line shows the comparison between novices and experienced users of dumbbell loads, significance in italics.
Table 3
Mean joint stiffnesses during Sagittal and Horizontal plane.
| STIFFNESS | FORWARD | BACKWARD | ||||
|---|---|---|---|---|---|---|
| SENIOR | NOVICE | SENIOR | NOVICE | |||
| Hip | S | B | 0.073 ± 0.072ab | 0.039 ± 0.01ab | 0.041 ± 0.01b | 0.037 ± 0.013b |
| D | 0.08 ± 0.012ab | 0.046 ± 0.013ab | 0.057 ± 0.013b | 0.028 ± 0.005b | ||
| H | B | 0.058 ± 0.023a | 0.052 ± 0.10a | 0.067 ± 0.18c | 0.038 ± 0.018c | |
| D | 0.085 ± 0.045a | 0.041 ± 0.012a | 0.099 ± 0.045c | 0.053 ± 0.015c | ||
| Knee | S | B | 0.03 ± 0.03ab | 0.022 ± 0.002ab | 0.043 ± 0.043c | 0.017 ± 0.006c |
| D | 0.033 ± 0.005ab | 0.026 ± 0.005ab | 0.039 ± 0.039c | 0.021 ± 0.003c | ||
| H | B | 0.01 ± 0.005 | 0.017 ± 0.01 | 0.032 ± 0.009a | 0.016 ± 0.008a | |
| D | 0.009 ± 0.004 | 0.01 ± 0.002 | 0.028 ± 0.01a | 0.019 ± 0.009a | ||
| Ankle | S | B | 0.066 ± 0.06a | 0.04 ± 0.008a | 0.068 ± 0.037a | 0.037 ± 0.037a |
| D | 0.071 ± 0.02a | 0.05 ± 0.006a | 0.059 ± 0.021a | 0.03 ± 0.005a | ||
[i] Note: a Indicates significant difference in the main effect of training experience, b indicates significant difference in the main effect of weight-bearing position, c Indicates significant difference in the interaction effect between training experience and weight-bearing position, P < 0.05. S, Sagittal plane; H, Horizontal plane. B, barbell; D, dumbbell. (Nm/kg/deg)
Table 4
Positive joint power and negative joint power during Sagittal and Horizontal plane.
| POWER | FORWARD | BACKWARD | |||||
|---|---|---|---|---|---|---|---|
| SENIOR | NOVICE | SENIOR | NOVICE | ||||
| Hip | S | Pt | B | 161.61 ± 43.33a | 91.09 ± 25.08a | 193.77 ± 71.56c | 178.76 ± 33.54c |
| D | 161.55 ± 40.93a | 120.55 ± 17.98a | 189.33 ± 37.06c | 157.57 ± 72.61c | |||
| Nt | B | –271.8 ± 54.81a | –125.7 ± 37.42a | –165.08 ± 75.02 | –191.69 ± 102.37 | ||
| D | –286.24 ± 42.24a | –161.69 ± 37.31a | –173.42 ± –173.42 | –157.86 ± 84.69 | |||
| H | Pt | B | 10.01 ± 6.90c | 7.89 ± 4.20c | 9.90 ± 6.46 | 6.86 ± 7.47 | |
| D | 7.27 ± 3.67c | 9.31 ± 3.80c | 9.20 ± 6.51 | 6.78 ± 2.99 | |||
| Nt | B | –6.10 ± 6.09 | –4.85 ± 2.27 | –8.88 ± 8.95 | –7.11 ± 4.69 | ||
| D | –5.73 ± 3.03 | –4.70 ± 2.04 | –8.56 ± 5.68 | –7.02 ± 2.43 | |||
| Knee | S | Pt | B | 446.32 ± 112.87 | 370.74 ± 113.31 | 183.86 ± 59.19ab | 112.44 ± 43.02ab |
| D | 445.95 ± 70.46 | 377.92 ± 108.47 | 227.93 ± 48.25ab | 162.07 ± 34.99ab | |||
| Nt | B | –225.89 ± 97.05c | –160.62 ± 33.31c | –171.29 ± 64.36a | –107.23 ± 51.78a | ||
| D | –204.13 ± 39.16c | –222.05 ± 38.91c | –168.26 ± 41.59a | –108.81 ± 12.16a | |||
| H | Pt | B | 3.15 ± 2.36 | 3.81 ± 1.72 | 3.34 ± 1.40 | 3.66 ± 2.78 | |
| D | 2.46 ± 1.57 | 3.72 ± 2.33 | 4.01 ± 2.66 | 3.02 ± 1.17 | |||
| Nt | B | –6.32 ± 4.14 | –4.30 ± 3.02 | –4.39 ± 3.01 | –4.35 ± 3.10 | ||
| D | –5.32 ± 2.96 | –5.85 ± 3.82 | –4.41 ± 2.63 | –4.79 ± 1.00 | |||
| Ankle | S | Pt | B | 62.57 ± 23.95c | 42.94 ± 9.40c | 20.07 ± 14.27b | 19.51 ± 12.12b |
| D | 54.41 ± 20.12c | 46.09 ± 12.69c | 21.10 ± 29.85b | 13.43 ± 5.48b | |||
| Nt | B | –87.00 ± 23.53a | –51.70 ± 16.33a | –17.93 ± 11.36 | –24.31 ± 14.98 | ||
| D | –80.14 ± 23.52a | –54.43 ± 18.26a | –26.69 ± 27.04 | –23.89 ± 6.40 | |||
[i] Note: a Indicates significant difference in the main effect of training experience, b Indicates significant difference in the main effect of weight-bearing position, c Indicates significant difference in the interaction effect between training experience and weight- bearing position, P < 0.05. S, Sagittal plane; H, Horizontal plane. B, barbell; D, dumbbell; Pt, positive power. Nt, negative power. (W/kg)
Table 5
Muscle RMS values of forward and backward lunge squat at different load position.
| RMS | FORWARD | BACKWARD | |||
|---|---|---|---|---|---|
| SENIOR | NOVICE | SENIOR | NOVICE | ||
| GMax | B | 0.021 ± 0.007 | 0.024 ± 0.009 | 0.023 ± 0.006 | 0.028 ± 0.015 |
| D | 0.022 ± 0.007 | 0.027 ± 0.012 | 0.025 ± 0.009 | 0.029 ± 0.369 | |
| RF | B | 0.273 ± 0.060b | 0.300 ± 0.092b | 0.498 ± 0.061ab | 0.381 ± 0.031ab |
| D | 0.406 ± 0.091b | 0.350 ± 0.130b | 0.565 ± 0.102ab | 0.493 ± 0.120ab | |
| BF | B | 0.129 ± 0.038 | 0.130 ± 0.040 | 0.171 ± 0.02 | 0.183 ± 0.057 |
| D | 0.137 ± 0.022 | 0.120 ± 0.033 | 0.224 ± 0.068 | 0.160 ± 0.02 | |
| TA | B | 0.479 ± 0.086a | 0.391 ± 0.106a | 0.569 ± 0.042 | 0.509 ± 0.081 |
| D | 0.566 ± 0.091a | 0.441 ± 0.126a | 0.550 ± 0.057 | 0.578 ± 0.157 | |
| GM | B | 0.344 ± 0.071 | 0.379 ± 0.105 | 0.256 ± 0.016 | 0.344 ± 0.058 |
| D | 0.385 ± 0.087 | 0.308 ± 0.101 | 0.265 ± 0.049 | 0.262 ± 0.065 | |
| GL | B | 0.378 ± 0.041a | 0.460 ± 0.093a | 0.352 ± 0.117 | 0.412 ± 0.054 |
| D | 0.33 ± 0.097a | 0.462 ± 0.113a | 0.305 ± 0.066 | 0.360 ± 0.063 | |
[i] Note: a Indicates significant difference in the main effect of training experience, b Indicates significant difference in the main effect of load position, P < 0.05. GMax, Gluteus Maximus; RF, Rectus Femoris; BF, Biceps Femoris; TA, Tibialis Anterior; GM, Gastrocnemius Medialis; GL, Gastrocnemius Lateralis. B, barbell; D, dumbbell. (mv)