
1. Introduction
As a basic exercise in lower limb strength training and sports recovery, the lunge is a foundational lower limb exercise that enhances dynamic stability and strengthens key muscle groups (e.g., quadriceps, gluteus maximus, and gastrocnemius) through coordinated tri-joint movements and improves joint stability, playing a critical role in preventing injuries and enhancing athletic performance (Escamilla et al., 2008, Wu et al., 2020, Schütz et al., 2014). However, improper execution by inexperienced exercisers may lead to joint overload and increased injury risks. Issues caused by faulty movement patterns or inappropriate loading choices have become increasingly prominent (Larsen et al., 2020, Alekseyev et al., 2020). Studies indicate that excessive knee flexion and excessive ankle dorsiflexion or plantarflexion may contribute to chronic injuries in the Achilles tendon and plantar fascia (Escamilla et al., 2008, Macrum et al., 2012). Fitness novices often exhibit compensatory movement patterns, such as anterior trunk tilt and knee valgus, due to inadequate neuromuscular control, which further intensifies the imbalance of shear force and pressure distribution in the lower limb joints (Cronin et al., 2003, Zellmer et al., 2019).
Long-term trained athletes have neuromuscular adaptations that enhance force transfer efficiency, and active muscle stiffness plays a decisive role to ensuring joint stability (Duan et al., 1997). At low load levels, the stability of the knee joint and restriction of anterior tibial translation primarily rely on passive structures (joint capsule and ligaments) (Smith et al., 1993). But active muscle contraction plays a key role in stabilizing the knee joint and reducing the risk of musculoskeletal system injuries (Granata et al., 2002). For example, experienced practitioners’ central nervous system strengthens synaptic connections between motor cortex and spinal cord, preferentially recruiting high-threshold motor units to enhance movement explosiveness and efficiency (Enoka and Duchateau, 2016). Experienced practitioners reduce co-activation of antagonist muscles and improve eccentric contraction capacity in gluteus maximus and hamstrings. This helps buffer loads during dynamic movements and decreases anterior cruciate ligament tension (Myer et al., 2008). In contrast, novices often show co-activation of antagonist muscles (e.g., quadriceps and hamstrings) due to weaker neuromuscular coordination. This increases energy expenditure and reduces movement efficiency (Wu et al., 2020). Such differences indicate that training experience significantly influences movement pattern selection and joint load distribution.
The biomechanical demands of lunges further vary with movement direction. Forward lunges primarily engage the quadriceps, showing concentric contraction capacity, while reverse lunges apply posterior chain muscles and require greater eccentric control (Wu et al., 2020). During forward lunges, peak knee joint torque positively correlates with patellofemoral joint stress, and excessive ankle dorsiflexion increases eccentric loading on the triceps surae (Schütz et al., 2014, Farrokhi et al., 2008). Novices often overcome weak core stability by increasing trunk forward lean, reducing hip flexion angles and causing knee anterior displacement. This significantly increases patellar tendon stress (Dill et al., 2014). Uncontrolled horizontal plane motions (e.g., knee valgus/internal rotation) exacerbate joint instability, particularly under external loading, potentially leading to ligament strains or cartilage wear (Barney et al., 2015). Reverse lunges may reduce knee compressive forces through extended movement range but demand higher coordination. Novices performing reverse lunges frequently exhibit excessive hip joint range of motion (ROM) and insufficient ankle dorsiflexion in the stance leg, compromising movement stability (Gao et al., 2022). These complexities highlight the need for personalized lunge direction and loading strategies based on training experience, and the lower limb stiffness is dependent of the strength of those muscles that induce motion to articulation thereby influencing biomechanical stability. But high stiffness can cause bony injuries (Williams III et al., 2004), and too little stiffness may indicate poor dynamic stability and result in sports injuries (Jang et al., 2021). For instance, barbell loading (high center of mass) enhances hip extensor activation through vertical trunk loading but may amplify postural sway in novices, increasing lumbar shear forces (Comerford and Mottram, 2001). In contrast, dumbbell loading (low center of mass) permits natural weight distribution, reduces peak joint pressures through load dispersion, and challenges dynamic balance (Stastny et al., 2015).
Current literature mainly explores specific variables (e.g., loading type or movement direction) but lacks integrated analyses of training experience, loading positions, and movement directions (Schütz et al., 2012, Nadzalan et al., 2018). Additionally, most studies fail to combine kinematic, kinetic, and surface electromyography (sEMG) data, limiting comprehensive understanding of injury mechanisms and training adaptations. Therefore, we integrated these three aspects for exploration. This study studies biomechanical differences between training experience across different loading positions and lunge directions to enhance training protocols and reduce exercise-related injuries. The study hypotheses are: (1) Training experience significantly affect joint mobility and moment distribution, with novices showing increased joint instability; (2) Dumbbell loading better suits novices, whereas barbell loading enhances muscle activation in experienced practitioners; (3) Reverse lunges, due to higher movement complexity, demand greater joint coordination and muscle synergy, which may worsen performance differences across experience levels.
2. Materials and Methods
2.1 Participants
Prior to testing, sample size estimation was performed using G*Power software (Version 3.1.9.4) with the following parameters: statistical power = 0.8, effect size = 0.25 (based on comparable experimental designs (Faul et al., 2007, Nakagawa and Cuthill, 2007), Correlation among repeated measures = 0.5, and significance level = 0.05. This calculation resulted a required sample size of 24 participants. Inclusion criteria: (1) Healthy males; (2) Novices: up to 3 months of structured training experience; (3) Experienced practitioners: a minimum of 2 years of regular training with showed schedules of exercise and frequency (Helms et al., 2015). Exclusion criteria: (1) Lower limb discomfort, injuries, or illnesses occurring during the last 6 months; (2) Irregular or unrecorded exercise routines. Twenty-four male participants, aged 20 to 24 years, were recruited, consisting of 12 novices and 12 experienced practitioners (demographics illustrated in Figure 1A). Participants refrained from food for 2 hours before testing and avoided alcohol and caffeine for 24 hours. No strenuous physical activity was allowed within 48 hours before testing. Standardized sports shoes and compression clothes have been provided to reduce apparel-related confounding variables. All participants were fully explained to about the study’s objectives and procedures, and they offered signed informed consent. Ethics approval and informed consents were obtained from Ningbo University Research Institute (No: RAGH202410053008.2).
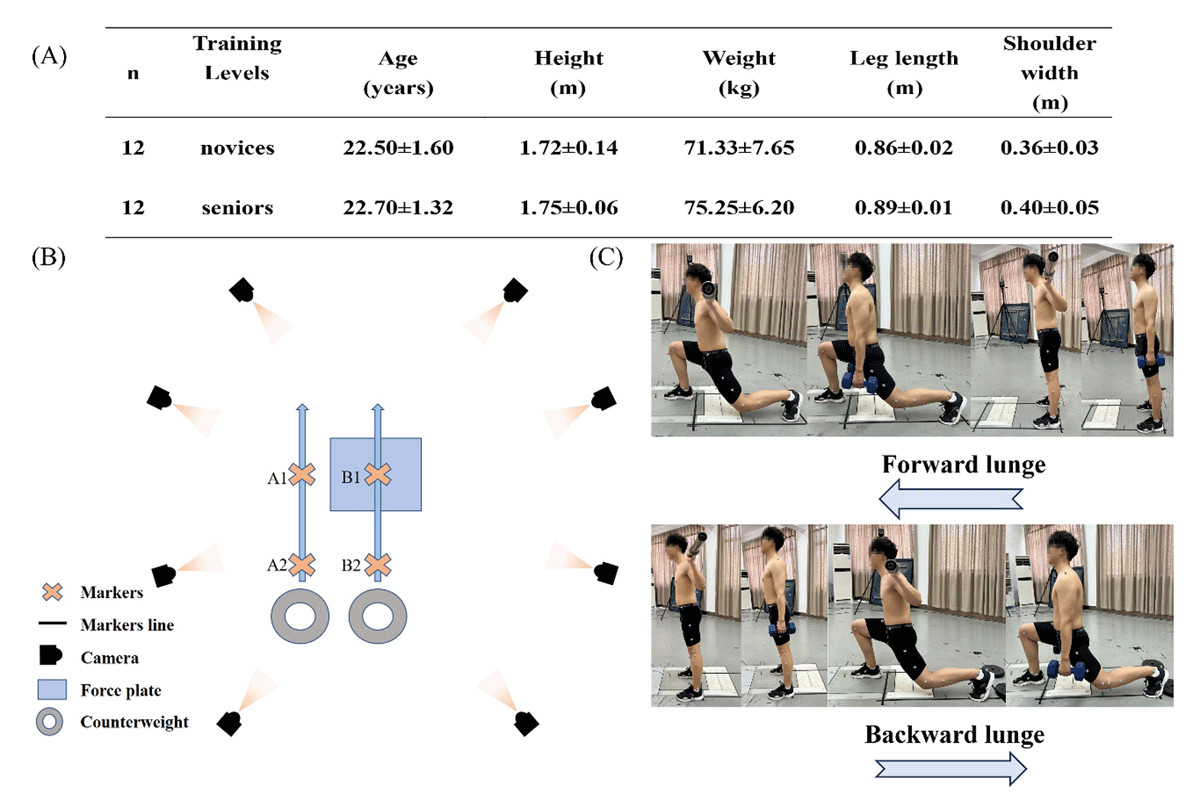
Figure 1
(A) Participants’ basic information; (B) Experimental site design; (C) Schematic of experimental movements.
2.2 Instruments
Kinematic data were collected with the Vicon infrared 3D motion capture system (v.1.8.5, Oxford Metrics Ltd, Oxford, UK). The system comprised eight T20 infrared high-speed cameras and Nexus analysis software, operating at a sampling frequency of 200 Hz. Kinetic data were acquired via three-dimensional force platforms (AMTI, Watertown, USA) at 1000 Hz sampling frequency. Kinematic and kinetic data streams were synchronized using hardware integration between the Vicon system and AMTI force platforms.
Electromyographic (EMG) signals from the gastrocnemius, tibialis anterior, biceps femoris, rectus femoris, and gluteus maximus were synchronously recorded using the wireless Delsys EMG system (Delsys, Boston, Massachusetts, US) at 1000 Hz. Prior to electrode placement, surface hair, skin oils, sweat, and other contaminants were removed with a razor to ensure signal quality. Bipolar surface electrodes (disposable Ag/AgCl, inter-electrode distance: 10 mm) were fixed on the muscle belly of each intended muscle, aligned parallel to muscle fiber orientation as determined by anatomical landmarks. Electrode positioning followed SENIAM guidelines (Hermens et al., 2000).
2.3 Procedures
Before the study’s preparation, each participant’s leg length was obtained using a meter stick. Leg length was measured as the distance between the anterior superior iliac spine to the medial condyle of the tibia. 70% of leg length was set as the stride length, and suitable stride lengths for both the starting point and the target leg position (on the force platform) were marked with tape, which indicate the lunge stride length for each subject, e.g., B1-B2. Measure the shoulder width of the participants and mark the shoulder width as the position between the feet on the ground or force platform using tape, e.g., A2-B2. Furthermore, record the duration of each participant doing a lunge squat and calculate the average to establish the length standard for every participant.
Before to the start of the study, participants engaged in a 5-minute warm-up on a stationary treadmill before performing lunges to ensure their bodies were adequately prepared for the ensuing experiment. Each participant trained with varying weight positions under the supervision of experts in the area, and verbal directions assured their understanding of the movement method, minimizing the chance of significant difficulties. The barbell grip position should be at the shoulder level of the posterior deltoid, with the hand slightly wider than shoulder-width. The dumbbells must be maintained at an equal weight on both sides of the body. The barbell must adhere to Olympic standards, weighing 20 kg, while each dumbbell should weigh 10 kg.
Forward Lunge Procedure:
Participants began in a straight position with both feet positioned at starting points A2 and B2. Following the spoken prompt, the right leg (lead leg) was moved to target point B1. The participant then reduced their center of mass while preserving a straight trunk position. The lack of movement required a strong extension of the lead leg’s hip and knee joints to return to the original posture (B2). Every exercise was completed with full knee extension and a neutral upright stance. A front mirror offered rapid visual feedback to ensure correct foot positioning in relation to ground markers.
Backward Lunge Procedure:
Adjustable weight plates were placed at the posterior target point (A2) to standardize heel contact. Participants started the movement from the start point B1 on the force platform. Upon time, the left leg (trailing leg) receded to engage the weight plate at A2, followed by a controlled decline of the center of mass while maintaining a straight trunk. Movement stopping included moving the trailing limb to the original point (A1) according to with ground markers. Trial completion was characterized by full knee extension and a neutral posture. The experimental setup and movement charts appear in Figure 1B-C.
2.4 Data collection and processing
A single lunge cycle has been designated by the structure just prior to the lead leg’s approach to the force platform till the return to the standing position was completed. Kinematic and kinetic data from the sagittal and horizontal planes, including range of motion (ROM), peak joint angles, and peak joint moments, were examined to evaluate joint biomechanics under varying loading situations.
Valid trials required the following criteria: (1) the heel of the lead leg must make first contact with the ground within the given boundaries; (2) the knee of the trailing leg approached but did not contact the ground; (3) the trunk must remain build and parallel to the horizontal plane; (4) the lead knee must not extend beyond the toe. Trials were excluded if the anterior heel raised off the ground or the posterior knee made contact with the floor.
Each participant received four testing conditions: forward and backward lunges using either dumbbells or barbells, all practiced using the right leg being the leading limb. The order of loading positions (dumbbell/barbell) and movement directions (forward/backward) was randomised. Six valid trials were conducted for each condition, with a 5-minute break between conditions to reduce fatigue effects.
Basic kinematic movements and ground reaction forces were examined with Vicon Nexus software. Marker trajectories received filter by a zero-lag 4th-order Butterworth low-pass filter set at 12Hz, while force plate data were filtered at 30Hz. Forces below 20N were eliminated to eliminate non-weight-bearing objects. Using MATLAB R2018a (The MathWorks Inc., Natick, MA, USA), we converted C3D files into OpenSim-compatible formats (.trc and .mot), then imported them into OpenSim 4.3 for further analysis (Zhou et al., 2021).
A modified OpenSim model, first created by Mei et al. (Mei et al., 2022) on the standard OpenSim framework (Rajagopal et al., 2016), was used. This model contains improved sagittal and horizontal plane knee joint kinematics to better represent multiplanar joint dynamics, with validation verified in previous biomechanical research (Gao et al., 2023, Mei et al., 2019, Yu et al., 2023).
The musculoskeletal model changed utilizing specific marker positions and body weight for static calibration. The static weighting of each marker was painstakingly calibrated to reduce the root mean square (RMS) error between experimental and digital markers to less than 0.02. The scaled model was then utilized for further computations. Joint angles were computed using OpenSim’s inverse kinematics tool, optimized by least-squares minimization to minimize marker tracking errors. Net joint moments at the hip, knee, and ankle were calculated using inverse dynamics, which determines equations of motion using kinematic data and external forces to identify the forces and torques causing observed movements.
Peak angles, ROM, and joint moments were time-normalized to 101 data points for graphical depiction. Joint moments were standardized to body weight to reduce inter-subject variability (Hsue et al., 2009). In addition, joint stiffness was calculated using the variance between the maximum and minimum joint moments (ΔM). The formula is as follows:
Kjoint represents joint stiffness (units: Nm/kg/deg), ΔM is the variance of joint moment, and Δθ is the range of joint motion.
Joint power was calculated with the following:
P represents power (units: W/kg), M is the joint moment, and ω is the joint angular velocity.
Raw EMG signals were band-pass filtered (100–500 Hz, 4th-order Butterworth) using Delsys EMGworks software. Signal amplitudes were measured via root mean square (RMS) computations. RMS values of the EMG signals were calculated with a 50-ms window. Muscle activation levels were standardized to peak values across trials for each muscle.
2.5 Statistical Analysis
Biomechanical characteristics, such as sagittal and horizontal plane ROM peak angles, peak moments, joint stiffness, joint power and root mean square (RMS) values, were evaluated utilizing IBM SPSS Statistics 26 (SPSS, Chicago, IL, USA).
Two-way repeated measures ANOVA evaluated the impact of training experience (novice/senior) and loading position (barbell/dumbbell) on the biomechanics of forward and backward lunges. Prior to the analysis, the assumptions of normality were confirmed via the Shapiro-Wilk test, and the sphericity assumption for the within-subjects factor was assessed using Mauchly’s test. When a data set did not conform to a normal distribution, the nonparametric Mann-Whitney test was applied. When sphericity was violated, Greenhouse-Geisser correction was applied to adjust the degrees of freedom. Post hoc pairwise comparisons with Bonferroni correction revealed distinct differences. Descriptive data are presented as mean ± standard deviation (MD ± SD), with significance established at P < 0.05.
One-dimensional statistical parametric mapping (SPM1D) in MATLAB was used to compare time-series kinematic and kinetic data between groups. Independent t-tests evaluated whole-waveform differences across lunge cycles, following Shapiro-Wilk normality evaluations prior to SPM analysis. This method measured temporal differences in joint mechanics between novices and seasoned practitioners across all loading situations. SPM1D analysis applied Random Field Theory correction to control for multiple comparisons across the lunge cycle.
3. Results
3.1 Joint angles
Hip, knee, and ankle joint ROM and peak angles during forward and reverse lunges across loading positions are shown in Table 1. Joint kinematic patterns and SPM1D results are shown in Figures 2 and 3. For the hip joint during forward lunges, the minimal angle and ROM in the sagittal plane showed significant impacts due to training experience (F = 24.444/36.578, P < 0.001, η2 = 0.003/0.325). Horizontal plane ROM exhibited significant main effects for both training experience and loading position (F = 43.355/23.340, P < 0.001, η2 = 0.363/0.235). For the knee joint, the greatest angle showed significant main effects for training experience (F = 30.778, P < 0.001, η2 = 0.288) and loading position (F = 5.776, P = 0.019, η2 = 0.071) in the sagittal plane. ROM exhibited substantial impacts due to training experience (F = 6.428, P = 0.013, η2 = 0.086; F = 15.438, P < 0.001, η2 = 0.135). In the ankle joint’s sagittal plane, training experience greatly affected peak angles and ROM (F = 16.461/23.369, P = 0.001, η2 = 0.143/0.336).
Table 1
Joint ROM and peak angles during Sagittal and Horizontal plane forward and backward lunges.
| ANGLE | FORWARD | BACKWARD | |||||
|---|---|---|---|---|---|---|---|
| SENIOR | NOVICE | SENIOR | NOVICE | ||||
| Hip | S | Max | B | 91.02 ± 8.18 | 93.38 ± 19.14 | 94.94 ± 2.57ab | 101.01 ± 2.32ab |
| D | 87.72 ± 9.14 | 93.05 ± 16.56 | 92.47 ± 5.22ab | 99.71 ± 4.02ab | |||
| Min | B | 42.06 ± 11.78a | 29.16 ± 7.83a | 62.21 ± 4.07 | 62.54 ± 4.96 | ||
| D | 42.06 ± 12.78a | 30.98 ± 8.69a | 62.00 ± 3.65 | 62.09 ± 4.70 | |||
| Rom | B | 48.96 ± 4.11a | 64.23 ± 16.27a | 32.74 ± 3.56a | 38.47 ± 6.56a | ||
| D | 45.07 ± 4.21a | 62.07 ± 16.46a | 30.47 ± 4.53a | 37.62 ± 6.90a | |||
| H | Max | B | 2.37 ± 2.45 | 4.04 ± 5.26 | 3.06 ± 2.89 | 4.52 ± 2.48 | |
| D | 2.93 ± 3.22 | 4.37 ± 6.62 | 4.12 ± 0.99 | 4.31 ± 0.93 | |||
| Min | B | –4.97 ± 3.96b | –5.94 ± 5.25b | –2.92 ± 3.25a | –3.39 ± 3.67a | ||
| D | –2.00 ± 3.30b | –3.75 ± 7.14b | –1.55 ± 2.31a | –4.41 ± .237a | |||
| Rom | B | 7.34 ± 2.28ab | 9.99 ± 2.30ab | 5.98 ± 1.97a | 7.91 ± 3.48a | ||
| D | 4.93 ± 1.11ab | 8.12 ± 1.79ab | 5.67 ± 2.19a | 8.71 ± 2.41a | |||
| Knee | S | Max | B | –22.17 ± 3.69ab | –14.86 ± 5.20ab | –60.61 ± 5.09ab | –49.55 ± 9.64ab |
| D | –22.80 ± 3.62ab | –19.03 ± 4.70ab | –65.46 ± 5.03ab | –57.27 ± 7.56ab | |||
| Min | B | –120.71 ± 6.08 | –125.68 ± 9.83 | –108.44 ± 8.33ab | –99.01 ± 10.02ab | ||
| D | –120.16 ± 7.53 | –125.10 ± 10.00 | –114.56 ± 8.48ab | –104.80 ± 7.45ab | |||
| Rom | B | 98.55 ± 9.16a | 110.82 ± 13.36a | 47.83 ± 7.24 | 49.46 ± 16.69 | ||
| D | 97.36 ± 10.24a | 106.08 ± 13.22a | 49.11 ± 8.84 | 47.53 ± 12.64 | |||
| H | Max | B | 12.08 ± 3.88b | 9.63 ± 1.4b | 11.85 ± 2.27a | 7.87 ± 5.67a | |
| D | 14.09 ± 4.04b | 10.71 ± 1.49b | 13.40 ± 2.17a | 7.81 ± 6.09a | |||
| Min | B | –7.52 ± 3.32a | –12.60 ± 5.76a | 5.90 ± 3.70a | 1.17 ± 7.09a | ||
| D | –7.46 ± 3.79a | –11.23 ± 7.02a | 6.60 ± 3.58a | –1.23 ± 10.24a | |||
| Rom | B | 19.60 ± 5.58a | 15.23 ± 6,42a | 5.95 ± 2.38 | 6.69 ± 3.76 | ||
| D | 21.55 ± 4.88a | 15.95 ± 7.90a | 6.80 ± 2.24 | 9.05 ± 5.22 | |||
| Ankle | S | Max | B | 29.61 ± 5.05a | 34.67 ± 7.85a | 25.14 ± 5.65b | 23.89 ± 5.23b |
| D | 26.39 ± 5.30a | 33.75 ± 6.79a | 22.52 ± 5.17b | 21.24 ± 4.09b | |||
| Min | B | –1.74 ± 4.24b | –5.07 ± 4.79b | 16.20 ± 4.41a | 13.30 ± 6.20a | ||
| D | 0.09 ± 4.05b | –0.60 ± 5.12b | 16.34 ± 2.36a | 13.29 ± 3.65a | |||
| Rom | B | 31.36 ± 6.92a | 39.74 ± 8.05a | 8.93 ± 3.02b | 10.59 ± 4.01b | ||
| D | 26.30 ± 6.72a | 33.75 ± 6.79a | 6.17 ± 3.29b | 7.95 ± 5.20b | |||
[i] Note: a Indicates significant difference in the main effect of training experience, b Indicates significant difference in the main effect of load position, P < 0.05. S, Sagittal plane; H, Horizontal plane. B, barbell; D, dumbbell. (°)
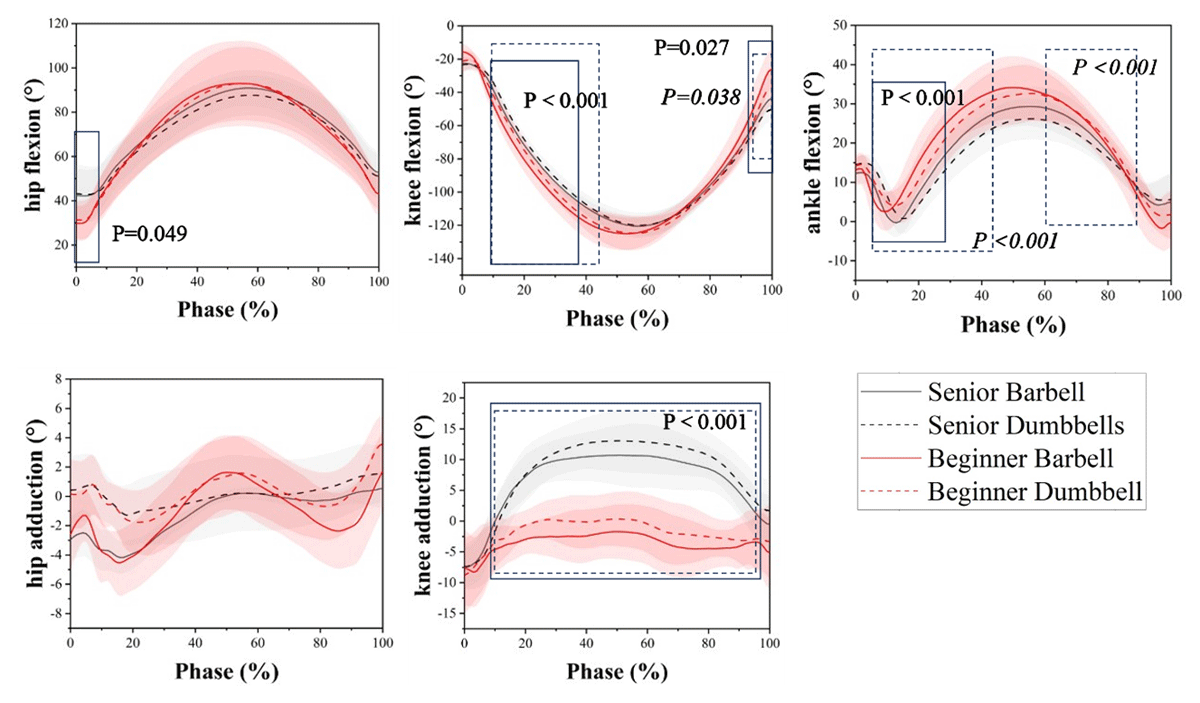
Figure 2
Kinematics of the lunge squat hip joint in different time frames of the population at different load position during the forward lunge; the solid line shows the comparison between novices and experienced users of barbell loads; the dotted line shows the comparison between novices and experienced users of dumbbell loads, significance in italics.
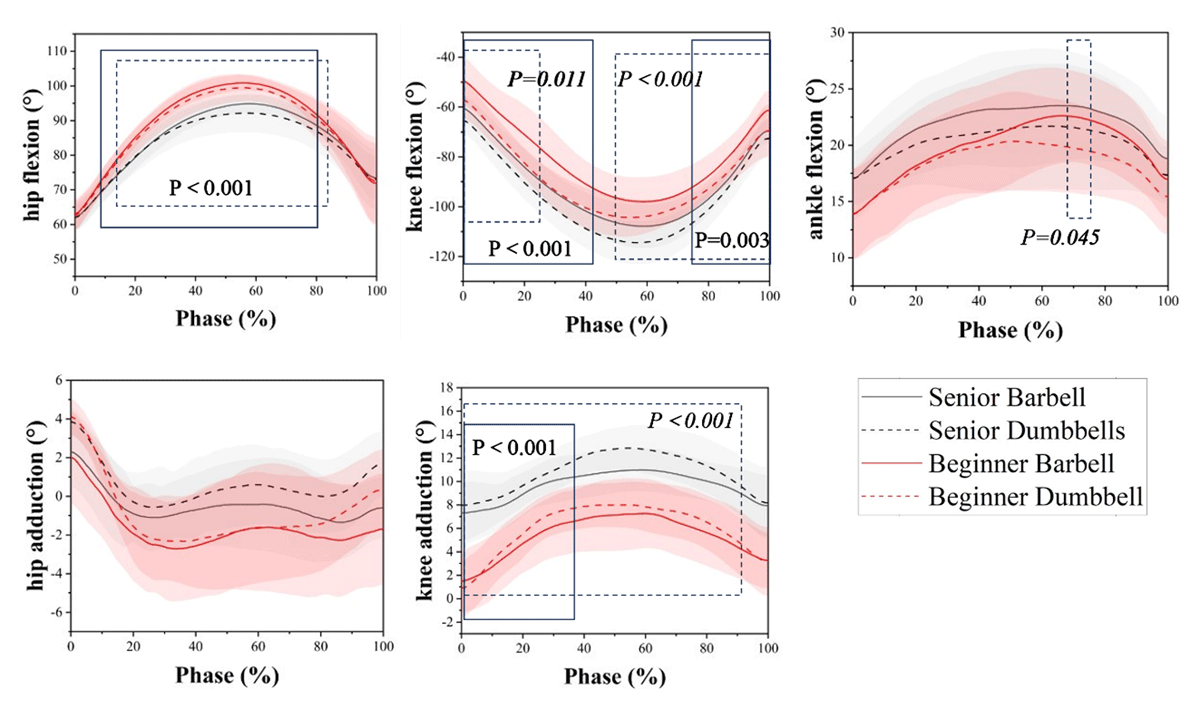
Figure 3
Kinematics of the lunge squat hip joint in different time frames of the population at different load position during the backward lunge; the solid line shows the comparison between novices and experienced users of barbell loads; the dotted line shows the comparison between novices and experienced users of dumbbell loads, significance in italics.
In the backward lunge, for the hip joint in the sagittal plane, both training experience (F = 60.699, P < 0.001, η2 = 0.444) and loading position (F = 4.860, P = 0.031, η2 = 0.06) showed significant main effects on peak angles. ROM was mainly affected by training experience (F = 25.450, P < 0.01, η2 = 0.251). Both ends of sagittal plane angles for the knee joint were significantly influenced by training experience (F = 34.989/23.553, η2 = 0.315/0.237) and loading position (F = 14.890/9.058, η2 = 0.164/0.106), with both effects reaching significance (P < 0.01). The ends of horizontal plane angles were mainly influenced by training experience (F = 18.192/12.429, P < 0.001, η2 = 0.193/0.141). The loading position significantly influenced the ROM (F = 8.790, P = 0.004, η2 = 0.133) in the ankle joint. The training experience significantly influenced angle minima (F = 8.797, P = 0.004, η2 = 0.137).
3.2 Joint moments
Table 2 shows peak joint moments at the lower limb joints during forward and backward lunges across various loading positions, while moment profiles and SPM1D data appear in Figures 4 and 5. A significant main effect of training experience was observed for the hip joint in the sagittal plane during the forward lunge (F = 35.764, P < 0.001, η2 = 0.320). SPM1D analysis indicated large group differences during the eccentric phase with barbell loading in sagittal plane (P = 0.002 and P < 0.001). The ankle joint shown significant effects of training experience (F = 5.500, P = 0.022, η2 = 0.067). SPM1D results indicated that training experience influenced ability during fall with both barbell (P = 0.023 and 0.014) and dumbbell loading (P = 0.004), effects that lasted into the rise phase (P < 0.001).
Table 2
Peak joint moments during Sagittal and Horizontal plane forward and backward lunges.
| MOMENT | FORWARD | BACKWARD | ||||
|---|---|---|---|---|---|---|
| SENIOR | NOVICE | SENIOR | NOVICE | |||
| Hip | S | B | –3.24 ± 0.45a | –2.47 ± 0.72a | –2.65 ± 0.68b | –2.52 ± 0.86b |
| D | –3.18 ± 0.55a | –2.45 ± 0.58a | –2.43 ± 0.28b | –2.19 ± 0.46b | ||
| H | B | 0.31 ± 0.10 | 0.28 ± 0.21 | –0.03 ± 0.11b | –0.07 ± 0.06b | |
| D | 0.33 ± 0.05 | 0.27 ± 0.14 | 0.02 ± 0.11b | 0.01 ± 0.12b | ||
| Knee | S | B | 2.19 ± 0.33 | 2.04 ± 0.25 | 1.61 ± 0.37 | 1.58 ± 0.66 |
| D | 2.18 ± 0.39 | 2.00 ± 0.28 | 1.62 ± 0.36 | 1.53 ± 0.73 | ||
| H | B | 0.08 ± 0.05a | 0.12 ± 0.09a | –0.07 ± 0.08b | –0.10 ± 0.07b | |
| D | 0.08 ± 0.04a | 0.13 ± 0.08a | –0.15 ± 0.12b | –0.13 ± 0.05b | ||
| Angle | S | B | –1.40 ± 0.40a | –1.16 ± 0.22a | –0.82 ± 0.28 | –0.79 ± 0.18 |
| D | –1.26 ± 0.43a | –1.14 ± 0.17a | –0.83 ± 0.19 | –0.70 ± 0.15 | ||
[i] Note: a Indicates significant difference in the main effect of training experience, b Indicates significant difference in the main effect of load position, P < 0.05. S, Sagittal plane; H, Horizontal plane. B, barbell; D, dumbbell. (Nm/kg)
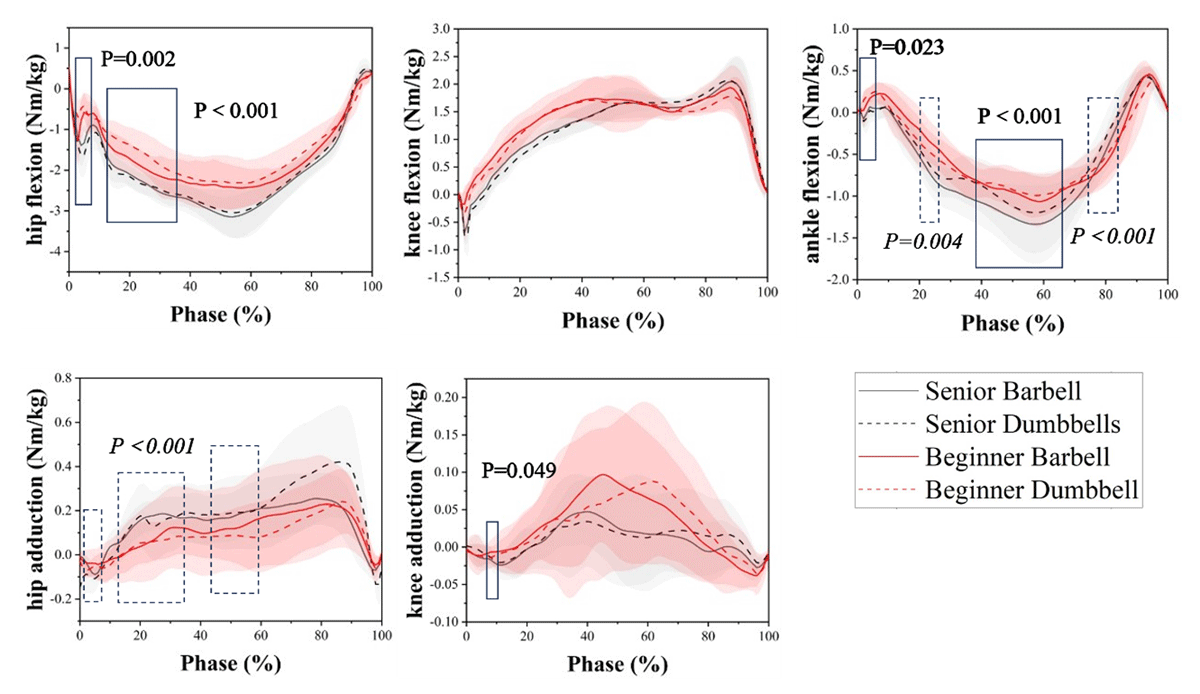
Figure 4
Dynamics of the lunge squat hip joint in different time frames of the population at different load position during the forward lunge; the solid line shows the comparison between novices and experienced users of barbell loads; the dotted line shows the comparison between novices and experienced users of dumbbell loads, significance in italics.
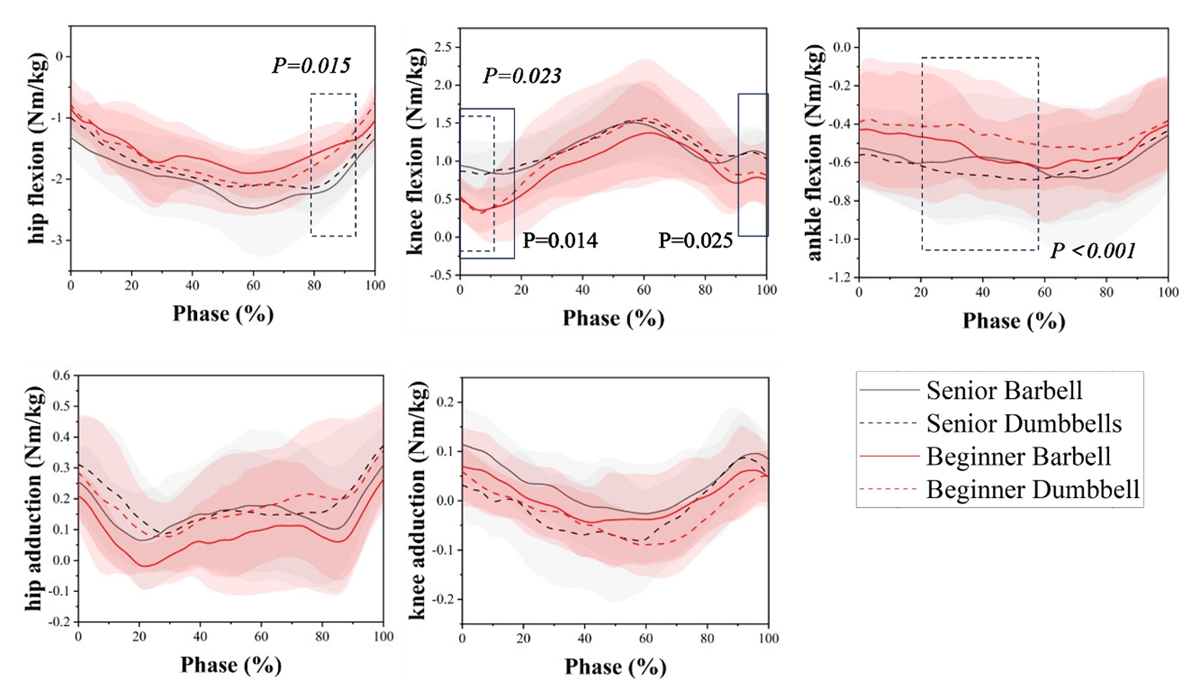
Figure 5
Dynamics of the lunge squat hip joint in different time frames of the population at different load position during the back lunge; the solid line shows the comparison between novices and experienced users of barbell loads; the dotted line shows the comparison between novices and experienced users of dumbbell loads, significance in italics.
The hip joint had significant main effects of loading position in the sagittal and horizontal planes during backward lunge (F = 4.012, P = 0.049, η2 = 0.05; F = 6.101, P = 0.016, η2 = 0.074). SPM1D found group differences during rise with dumbbell loading in the sagittal plane (P = 0.015). SPM1D indicated major effects of training experience on the ankle joint during fall with dumbbell loading (P < 0.001).
3.3 Joint stiffnesses
Table 3 shows mean joint stiffnesses at the lower limb joint at different load positions and lunge directions. In forward lunges, both training experience and loading position had significant main effects on hip joint stiffness in the sagittal plane (F = 16.231, P < 0.001, η2 = 0.743; F = 5.855, P = 0.018, η2 = 0.079), in the horizontal plane, the main effect of training experience was also significant (F = 9.185, P = 0.003, η2 = 0.119). For the knee joint, a significant interaction was observed between training experience and loading position (F = 51.380, P < 0.001, η2 = 0.430; F = 5.952, P = 0.017, η2 = 0.08) in the sagittal plane. In backward lunges, a significant interaction showed between training experience and loading position in the horizontal plane (F = 4.443, P = 0.04, η2 = 0.074). The simple effects analysis showed a significant difference between training experience under barbell loading (P = 0.018), and a significant difference between loading positions for seniors (P < 0.001). For the knee joint in the sagittal plane, a significant interaction was found between training experience and loading position (F = 4.396, P = 0.041, η2 = 0.0733). The simple effects analysis showed that under dumbbell loading, training experience had a significant effect (P = 0.027); and for novices, significant differences were found between the two loading positions (P = 0.041). Ankle joint stiffness was significantly influenced by the main effect of training duration (F = 14.009, P < 0.001, η2 = 0.2).
Table 3
Mean joint stiffnesses during Sagittal and Horizontal plane.
| STIFFNESS | FORWARD | BACKWARD | ||||
|---|---|---|---|---|---|---|
| SENIOR | NOVICE | SENIOR | NOVICE | |||
| Hip | S | B | 0.073 ± 0.072ab | 0.039 ± 0.01ab | 0.041 ± 0.01b | 0.037 ± 0.013b |
| D | 0.08 ± 0.012ab | 0.046 ± 0.013ab | 0.057 ± 0.013b | 0.028 ± 0.005b | ||
| H | B | 0.058 ± 0.023a | 0.052 ± 0.10a | 0.067 ± 0.18c | 0.038 ± 0.018c | |
| D | 0.085 ± 0.045a | 0.041 ± 0.012a | 0.099 ± 0.045c | 0.053 ± 0.015c | ||
| Knee | S | B | 0.03 ± 0.03ab | 0.022 ± 0.002ab | 0.043 ± 0.043c | 0.017 ± 0.006c |
| D | 0.033 ± 0.005ab | 0.026 ± 0.005ab | 0.039 ± 0.039c | 0.021 ± 0.003c | ||
| H | B | 0.01 ± 0.005 | 0.017 ± 0.01 | 0.032 ± 0.009a | 0.016 ± 0.008a | |
| D | 0.009 ± 0.004 | 0.01 ± 0.002 | 0.028 ± 0.01a | 0.019 ± 0.009a | ||
| Ankle | S | B | 0.066 ± 0.06a | 0.04 ± 0.008a | 0.068 ± 0.037a | 0.037 ± 0.037a |
| D | 0.071 ± 0.02a | 0.05 ± 0.006a | 0.059 ± 0.021a | 0.03 ± 0.005a | ||
[i] Note: a Indicates significant difference in the main effect of training experience, b indicates significant difference in the main effect of weight-bearing position, c Indicates significant difference in the interaction effect between training experience and weight-bearing position, P < 0.05. S, Sagittal plane; H, Horizontal plane. B, barbell; D, dumbbell. (Nm/kg/deg)
3.4 Joint power
Table 4 shows positive and negative joint power at the lower limb joint during forward and backward lunges across various loading positions. In forward lunges, both positive and negative power of the hip joint were significantly affected by training experience (F = 58.81, P < 0.001, η2 = 0.436) in the sagittal plane. Training experience and loading position had a combined impact of the knee (F = 51.380, P < 0.001, η2 = 0.1547; F = 5.952, P = 0.017, η2 = 0.257) on the sagittal plane. In backward lunges, there was a main effect in sagittal plane, barbell (F = 6.05; P = 0.017, η2 = 0.073); there was an interaction between training experience and weight bearing position in the horizontal plane (F = 4.443, P = 0.04, η2 = 0.064), and simple effects analysis showed that under barbell loading, training experience had a significant effect (P = 0.018); while seniors showed a significant effect between the two loading positions (P < 0.001). In the sagittal plane, knee had an interaction effect (F = 4.396, P = 0.041, η2 = 0.146). Simple effect analysis indicated significant differences in training experience under dumbbell (P = 0.027), with novices demonstrating notable differences between the two load positions (P = 0.041). Also, there was the main effect of training experience for ankle (F = 14.009, P < 0.001, η2 = 0.243).
Table 4
Positive joint power and negative joint power during Sagittal and Horizontal plane.
| POWER | FORWARD | BACKWARD | |||||
|---|---|---|---|---|---|---|---|
| SENIOR | NOVICE | SENIOR | NOVICE | ||||
| Hip | S | Pt | B | 161.61 ± 43.33a | 91.09 ± 25.08a | 193.77 ± 71.56c | 178.76 ± 33.54c |
| D | 161.55 ± 40.93a | 120.55 ± 17.98a | 189.33 ± 37.06c | 157.57 ± 72.61c | |||
| Nt | B | –271.8 ± 54.81a | –125.7 ± 37.42a | –165.08 ± 75.02 | –191.69 ± 102.37 | ||
| D | –286.24 ± 42.24a | –161.69 ± 37.31a | –173.42 ± –173.42 | –157.86 ± 84.69 | |||
| H | Pt | B | 10.01 ± 6.90c | 7.89 ± 4.20c | 9.90 ± 6.46 | 6.86 ± 7.47 | |
| D | 7.27 ± 3.67c | 9.31 ± 3.80c | 9.20 ± 6.51 | 6.78 ± 2.99 | |||
| Nt | B | –6.10 ± 6.09 | –4.85 ± 2.27 | –8.88 ± 8.95 | –7.11 ± 4.69 | ||
| D | –5.73 ± 3.03 | –4.70 ± 2.04 | –8.56 ± 5.68 | –7.02 ± 2.43 | |||
| Knee | S | Pt | B | 446.32 ± 112.87 | 370.74 ± 113.31 | 183.86 ± 59.19ab | 112.44 ± 43.02ab |
| D | 445.95 ± 70.46 | 377.92 ± 108.47 | 227.93 ± 48.25ab | 162.07 ± 34.99ab | |||
| Nt | B | –225.89 ± 97.05c | –160.62 ± 33.31c | –171.29 ± 64.36a | –107.23 ± 51.78a | ||
| D | –204.13 ± 39.16c | –222.05 ± 38.91c | –168.26 ± 41.59a | –108.81 ± 12.16a | |||
| H | Pt | B | 3.15 ± 2.36 | 3.81 ± 1.72 | 3.34 ± 1.40 | 3.66 ± 2.78 | |
| D | 2.46 ± 1.57 | 3.72 ± 2.33 | 4.01 ± 2.66 | 3.02 ± 1.17 | |||
| Nt | B | –6.32 ± 4.14 | –4.30 ± 3.02 | –4.39 ± 3.01 | –4.35 ± 3.10 | ||
| D | –5.32 ± 2.96 | –5.85 ± 3.82 | –4.41 ± 2.63 | –4.79 ± 1.00 | |||
| Ankle | S | Pt | B | 62.57 ± 23.95c | 42.94 ± 9.40c | 20.07 ± 14.27b | 19.51 ± 12.12b |
| D | 54.41 ± 20.12c | 46.09 ± 12.69c | 21.10 ± 29.85b | 13.43 ± 5.48b | |||
| Nt | B | –87.00 ± 23.53a | –51.70 ± 16.33a | –17.93 ± 11.36 | –24.31 ± 14.98 | ||
| D | –80.14 ± 23.52a | –54.43 ± 18.26a | –26.69 ± 27.04 | –23.89 ± 6.40 | |||
[i] Note: a Indicates significant difference in the main effect of training experience, b Indicates significant difference in the main effect of weight-bearing position, c Indicates significant difference in the interaction effect between training experience and weight- bearing position, P < 0.05. S, Sagittal plane; H, Horizontal plane. B, barbell; D, dumbbell; Pt, positive power. Nt, negative power. (W/kg)
3.5 EMG of each muscle
Table 5 shows the RMS values of muscle activation during forward and backward lunges across various loading positions and degrees of training experience. No interaction effects were found in any of the six tested muscles. In forward lunges, rectus femoris activation was mostly affected by loading position (F = 4.552, P = 0.045, η2 = 0.185), but tibialis anterior (F = 5.267, P = 0.033, η2 = 0.208) and lateral gastrocnemius (F = 7.015, P = 0.015, η2 = 0.260) displayed substantial effects related to training experience. In backward lunges, rectus femoris activation shown mixed effects of training experience (F = 6.088, P = 0.023, η2 = 0.233) and loading position (F = 5.461, P = 0.03, η2 = 0.214).
Table 5
Muscle RMS values of forward and backward lunge squat at different load position.
| RMS | FORWARD | BACKWARD | |||
|---|---|---|---|---|---|
| SENIOR | NOVICE | SENIOR | NOVICE | ||
| GMax | B | 0.021 ± 0.007 | 0.024 ± 0.009 | 0.023 ± 0.006 | 0.028 ± 0.015 |
| D | 0.022 ± 0.007 | 0.027 ± 0.012 | 0.025 ± 0.009 | 0.029 ± 0.369 | |
| RF | B | 0.273 ± 0.060b | 0.300 ± 0.092b | 0.498 ± 0.061ab | 0.381 ± 0.031ab |
| D | 0.406 ± 0.091b | 0.350 ± 0.130b | 0.565 ± 0.102ab | 0.493 ± 0.120ab | |
| BF | B | 0.129 ± 0.038 | 0.130 ± 0.040 | 0.171 ± 0.02 | 0.183 ± 0.057 |
| D | 0.137 ± 0.022 | 0.120 ± 0.033 | 0.224 ± 0.068 | 0.160 ± 0.02 | |
| TA | B | 0.479 ± 0.086a | 0.391 ± 0.106a | 0.569 ± 0.042 | 0.509 ± 0.081 |
| D | 0.566 ± 0.091a | 0.441 ± 0.126a | 0.550 ± 0.057 | 0.578 ± 0.157 | |
| GM | B | 0.344 ± 0.071 | 0.379 ± 0.105 | 0.256 ± 0.016 | 0.344 ± 0.058 |
| D | 0.385 ± 0.087 | 0.308 ± 0.101 | 0.265 ± 0.049 | 0.262 ± 0.065 | |
| GL | B | 0.378 ± 0.041a | 0.460 ± 0.093a | 0.352 ± 0.117 | 0.412 ± 0.054 |
| D | 0.33 ± 0.097a | 0.462 ± 0.113a | 0.305 ± 0.066 | 0.360 ± 0.063 | |
[i] Note: a Indicates significant difference in the main effect of training experience, b Indicates significant difference in the main effect of load position, P < 0.05. GMax, Gluteus Maximus; RF, Rectus Femoris; BF, Biceps Femoris; TA, Tibialis Anterior; GM, Gastrocnemius Medialis; GL, Gastrocnemius Lateralis. B, barbell; D, dumbbell. (mv)
4. Discussion
This study investigated the biomechanical impacts of loading positions on lower limb joints during forward and backward lunges in males with differing training backgrounds, focusing on kinematics, dynamics, and RMS amplitudes. The results give essential information for enhancing training programs and injury prevention measures.
This study’s results supported the first hypothesis that the subjects’ training experience was the main contributing factor. Novices had greater joint ROM in both sagittal and horizontal planes compared to experienced practitioners, indicating lower movement precision, and may rely on an increased available ROM to balance. Long-term training enhances corticospinal coordination and motor unit recruitment efficiency, reducing redundant movements and optimizing movement economy (Enoka and Duchateau, 2016). For example, seniors exhibited enhanced hip stability during reverse lunges, with barbell loading leading in a 6.07° inter-group difference in peak angles, compared to 7.24° for dumbbell loading. This presumably results from improved eccentric contraction ability of the gluteus maximus, which reduces dynamic stresses and reduces compensatory trunk lean. In contrast, novices avoided core instability by augmenting joint ROM, which enhanced anterior knee movement and patellofemoral joint stress—a trend agreed with Escamilla’s study regarding the link between stride length and knee loading (Escamilla et al., 2010). This trend was also reflected in joint stiffness. Seniors showed higher stiffness values, with significant differences especially in the hip and ankle joints. In the sagittal plane, novices had significantly lower stiffness in all three major joints, indicating they were less able to generate sufficient joint moment for the same ROM. This suggested lower dynamic stability.
The knee joint had the highest ROM and maximum angles during performing of lunges. Danielle et al. (Goulette et al., 2021) similarly indicated that higher knee flexion angles during forward lunges are linked with greater patellofemoral joint stress. Anterior knee translation exceeding the toes increases joint stress, hence heightening injury risks. Underdeveloped hip and knee musculature leads to compensatory activation of calf and foot muscles for postural stabilization, hence increasing vulnerability to overload. Keeping the knee positioned below the toes during lunges reduces stress on the patellar tendon. The knee joint stiffness and negative power peak is smaller in beginners which highlights a poor absorption capacity during the eccentric phase. This not only decreases the efficiency of movement, but increases the likelihood of mechanical damage to the knee. Conversely, seniors demonstrated greater hip joint positive power and stiffness from squat to standing, indicating greater power generation and energy transfer effectiveness. In the horizontal plane, they also demonstrated greater knee joint mobility, indicating better frontal plane control. This adaptability likely arises from long-term training-induced ligament-muscle synergy changes, including the co-activation of hamstrings and medial gastrocnemius to reduce knee valgus moments (Hewett et al., 2005). These results support the benefits of specific frontal plane stability training for novices.
Novices had better ankle joint mobility; however, this greater flexibility may not regularly offer advantages. Previous studies suggests that a 10° raise in ankle plantarflexion improves the risk of calf muscle fatigue, foot overuse injuries, and chronic pressure on the Achilles tendon and plantar ligament (Mei et al., 2017). SPM1D time-series analysis indicated large differences in ankle mechanics between groups during dumbbell-loaded lunges, probably due to variations in ankle muscle strength. Ankle stiffness is influenced by pre-activation (muscle activity before touching ground) and overall muscle regulation. Seniors showed greater peak joint angles and stiffness in backward lunges. However, they displayed less dorsiflexion and lower stiffness, which may result from differences in muscle activation (Hobara et al., 2007) and joint angle at ground contact (Farley et al., 1998). Generally, pre-activity is considered to result from centrally generated motor commands that aimed to enhancing joint stiffness proactively, thereby preparing the body to handle the anticipated forces during landing. Guilherme et al. (da Costa et al., 2021) shown that dynamic ankle dorsiflexion range can be modified by neuromuscular methods beyond passive joint limits, such as hip and knee muscle weakness leading to higher plantarflexor demands. Increasing knee strength and ankle dorsiflexor capability may enhance ankle adaptability.
Joint moments are linked with muscular strength and joint position. In both forward and backward lunges, the sagittal plane moments were greatest at the hip, followed by the knee and ankle. Experienced seniors produced superior joint moments compared to novices, consistent with Bryan’s findings (Riemann et al., 2012). While Farrokhi et al. did not conduct a statistical comparison of hip-knee-ankle kinematics, their descriptive results similarly highlighted hip extensions as the primary contributors during forward lunges. Seniors showed significantly higher hip stiffness in the sagittal plane compared to novices. This suggests improved force transmission efficiency through enhanced tendon elasticity and better neuromuscular coordination. Additionally, experienced seniors had significantly higher positive hip power, indicating more effective coordination between muscle contraction speed and moment output. Long-term training increases tendon stiffness, which improves energy storage and release during dynamic movements. This means seniors can more efficiently convert absorbed mechanical energy (negative power) into propulsive output (positive power), achieving a more effective “energy rebound.” Our data suggested that dumbbell loading decreased peak hip moments and horizontal plane knee shear forces in novices, hence supporting its efficacy for stability-oriented training. Seniors reported more ankle moments during barbell forward lunges, likely related to high-threshold plantarflexor recruitment. Santana et al. (Santana et al., 2007) observed that dumbbells reduce spinal shear forces by distributed center-of-mass loading, hence improving energy transfer efficiency. Differences in power output may correlate with the ability to recruit high-threshold motor units. Through central nervous system adaptation, seniors can preferentially activate fast-twitch muscle fibers, which enhances explosive strength. This is especially relevant during the advanced strength phase of seniors, a method suitable for advanced strength training phases, corroborating the second hypothesis.
Novices display lower muscular strength; however, compensatory forward trunk lean moves the body’s center of mass frontally, enhancing hip engagement—especially during backward lunges. Research indicates that joint ROM is not influenced by loading intensity (Schütz et al., 2014, Lehecka et al., 2017), implying that this approach redistributes knee stress irrespective of weight variations. Novices exhibited reduced knee moments during backward lunges, despite increased sagittal and horizontal plane ROM under barbell loading, indicating a biomechanical benefit for movement control. Conversely, barbells greatly reduced horizontal plane knee moments and high stiffness in experienced seniors, suggesting enhanced joint alignment stability under high loads. This may indicate long-term training-induced adaptations in tendon stiffness, as improved energy storage efficiency of the Achilles tendon reduces dynamic loss of energy (Arampatzis et al., 2007), the increased stiffness in seniors may result from enhanced muscle pre-activation and improved stability of synergistic muscle groups, in line with our third hypothesis. Thus, barbells may be more appropriate for senior individuals with sensitivities in the knees or ankles.
Loading position and training experience jointly influenced muscle activation patterns. The rectus femoris and tibialis anterior had the highest RMS values in both lunge variations, followed by the gastrocnemius. Activation levels of the gluteus maximus declined due to signal interference from subcutaneous adipose tissue. In forward lunges, dumbbells elevated rectus femoris RMS in novices, while barbells enhanced activation in experienced seniors—indicating differing neural adaptations; novices leverage dumbbells’ low center of mass for dynamic balance, whereas experts prioritize barbell-loaded target muscle recruitment (Andersen et al., 2010). Both groups indicated higher gluteus maximus activation during backward lunges with dumbbell loading, indicating that it’s useful for dynamic back chain control. This is consistent with Stastny et al. (Stastny et al., 2015), who indicated that dumbbells increase glute-hamstring co-activation through improved trunk stability. Novices exhibited increased tibialis anterior activity during forward lunges, likely adjusting for limited ankle dorsiflexion, a risk factor for overuse-related Achilles tendinopathy. Trainers should choose training modalities according to their specific biomechanical profiles and injury prevention objectives.
5. Limitations
This study has several limitations. First, the investigation was initially confined to male participants, avoiding female populations, especially female novices who have unique strength profiles. As result, gender-specific biomechanical differences have yet to be studied. Secondly, regional variations in electromyographic (EMG) data collection may arise from variable electrode placement among participants. Moreover, surface EMG recordings are prone to signal attenuation due to skin and subcutaneous adipose tissue, hence constraining the validity of neuromuscular activation data. Finally, the group consisted only of healthy young males, avoiding those with injuries or chronic diseases. And this study used a single force plate design, and GRF of the double support phase was not measured directly. However, errors were minimized through model optimization and rigorous experimental screening. Future research should enhance demographic variety by investigating gender gaps, differing degrees of athletic proficiency, and clinical groups to thoroughly characterize lunge biomechanics across more types of individuals.
6. Conclusion
The key aspect affecting lower body control, load transfer, and energy management efficiency during male lunge exercises is training experience. In forward lunges, novices using dumbbells exhibited reduced hip moment and knee shear forces with enhanced rectus femoris activation, suggested as the best stability exercises. Seniors achieved greater thigh muscle stimulation with dumbbells, favoring hypertrophy development. For backward lunges, barbells reduced knee-ankle moment fluctuations in seniors, aligning with long-term strength programming. Long-term training for seniors shows significantly higher hip joint stiffness and positive power output in the sagittal plane compared to novices, this reduces metabolic cost and improves energy transfer efficiency. Novices displayed lower joint stress and higher muscle activation with dumbbells than barbells, suggesting better efficacy for early-stage training.
Data Accessibility Statement
The data that support the findings of this study are not publicly available due to privacy data of participant but are available from the corresponding author on reasonable request.
Ethics and Consent
Informed consent was obtained from all the participants involved in the study.
Competing Interests
The authors have no competing interests to declare.
Author Contributions
All the authors contributed substantially to the manuscript. L.G., F.G. and Z.G. were responsible for the conceptualization. L.G., Z.G. were responsible for investigation and methodology. L.G. and Z.G. were responsible for formal analysis and writing—original draft. F.G. and Z.G. were responsible for writing—review and editing and supervision. All authors have read and agreed to the published version of the manuscript.