
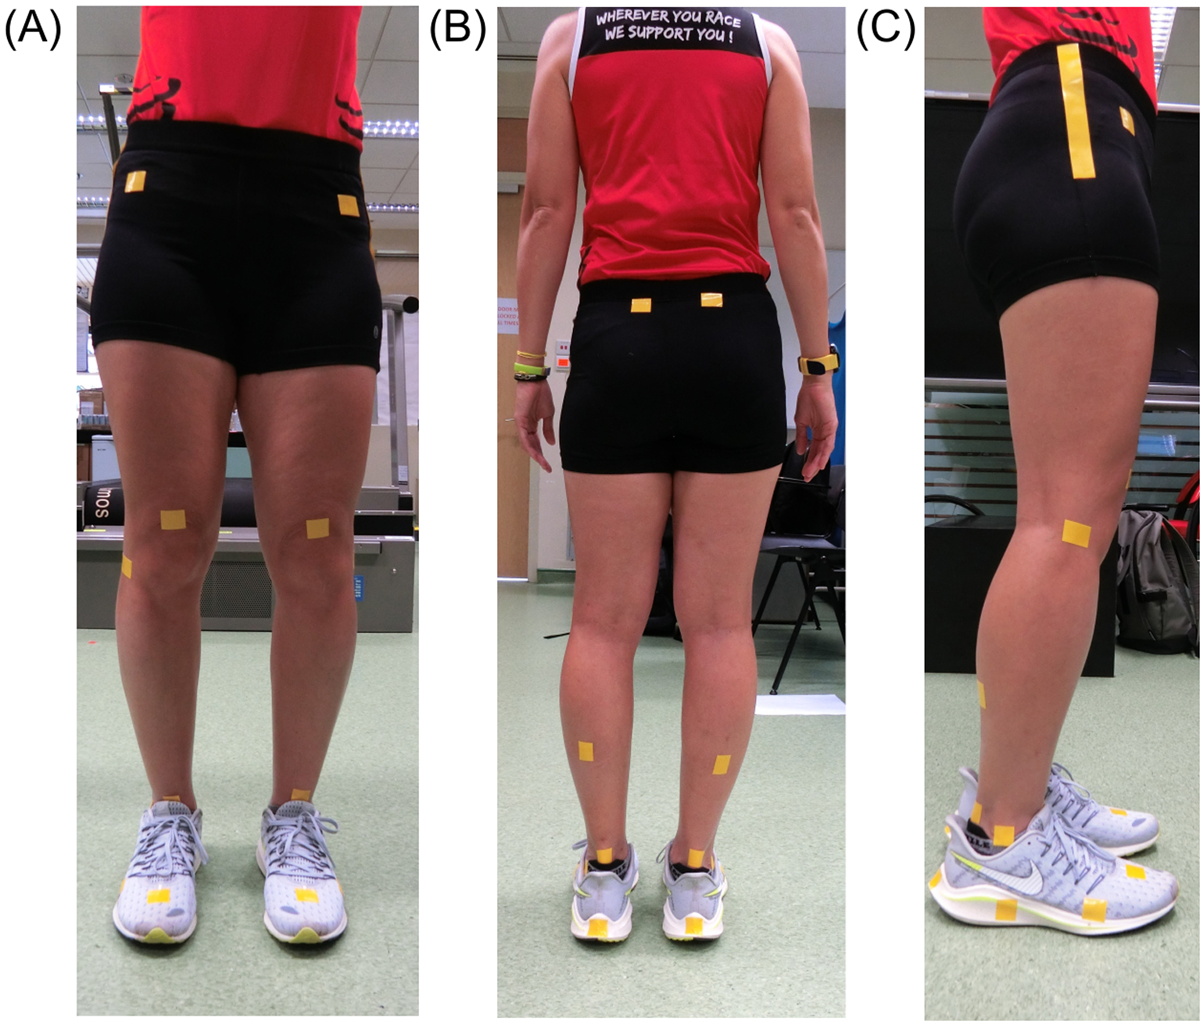
Figure 1
Marker placement with cloth tape. (A) Markers from the frontal view comprising the anterior superior iliac spine (ASIS), base of patella, talus, and point between second and third metatarsals. (B) Markers from the back view including the posterior superior iliac spine (PSIS), mid-shank, Achilles tendon, and calcaneus. (C) Markers from the sagittal view consisted of an extended line from greater trochanter towards the knee, lateral femoral epicondyle, lateral malleolus, and 2 markers on the shoe sole (fibular trochlea and fifth metatarsal head).
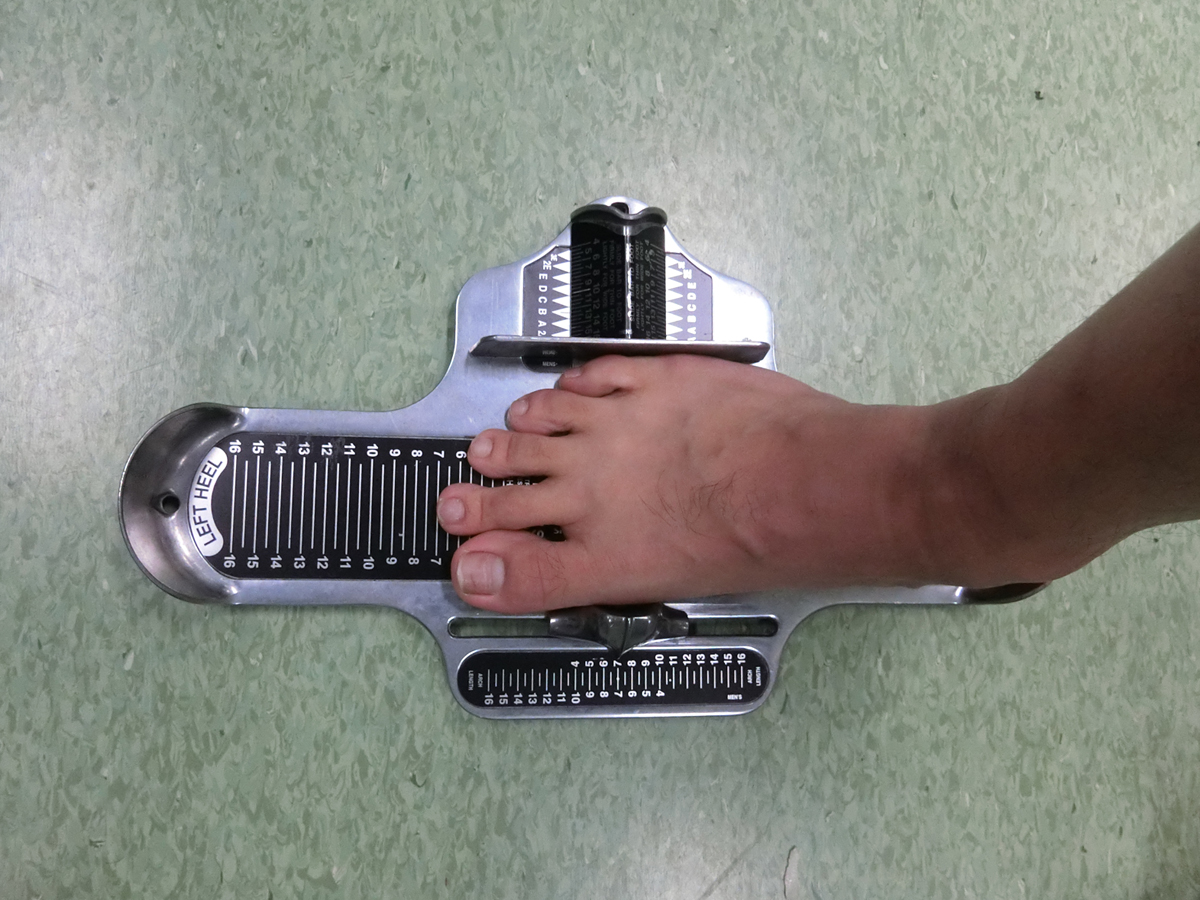
Figure 2
Example of morphology measurement for a right foot using a standard Brannock device.
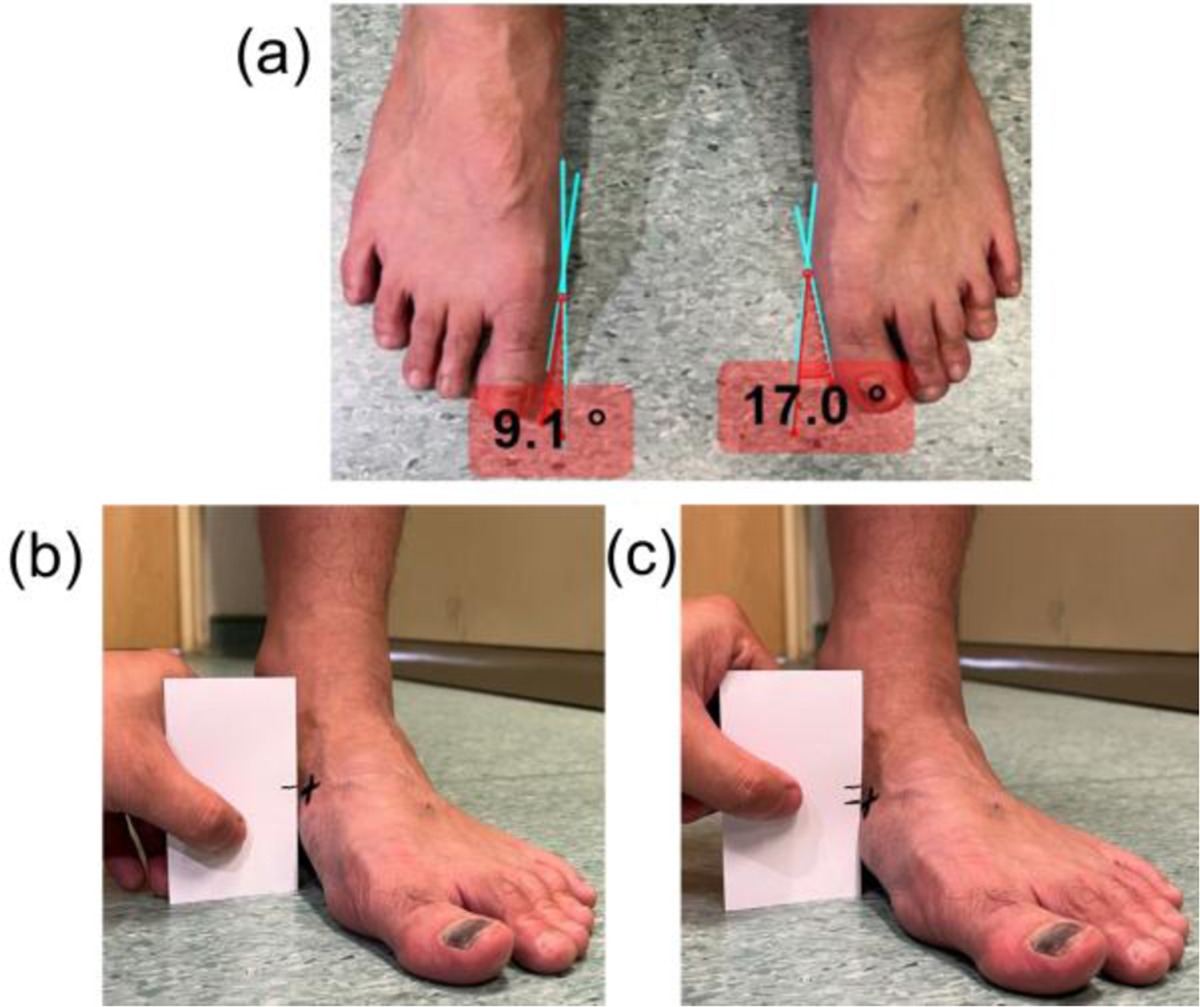
Figure 3
(a) Hallux valgus (bunion) angle measurements using top-view photographs of the feet. Navicular drop measured as the vertical distance of the navicular tuberosity drop from (b) the neutral position to (c) the relaxing position.
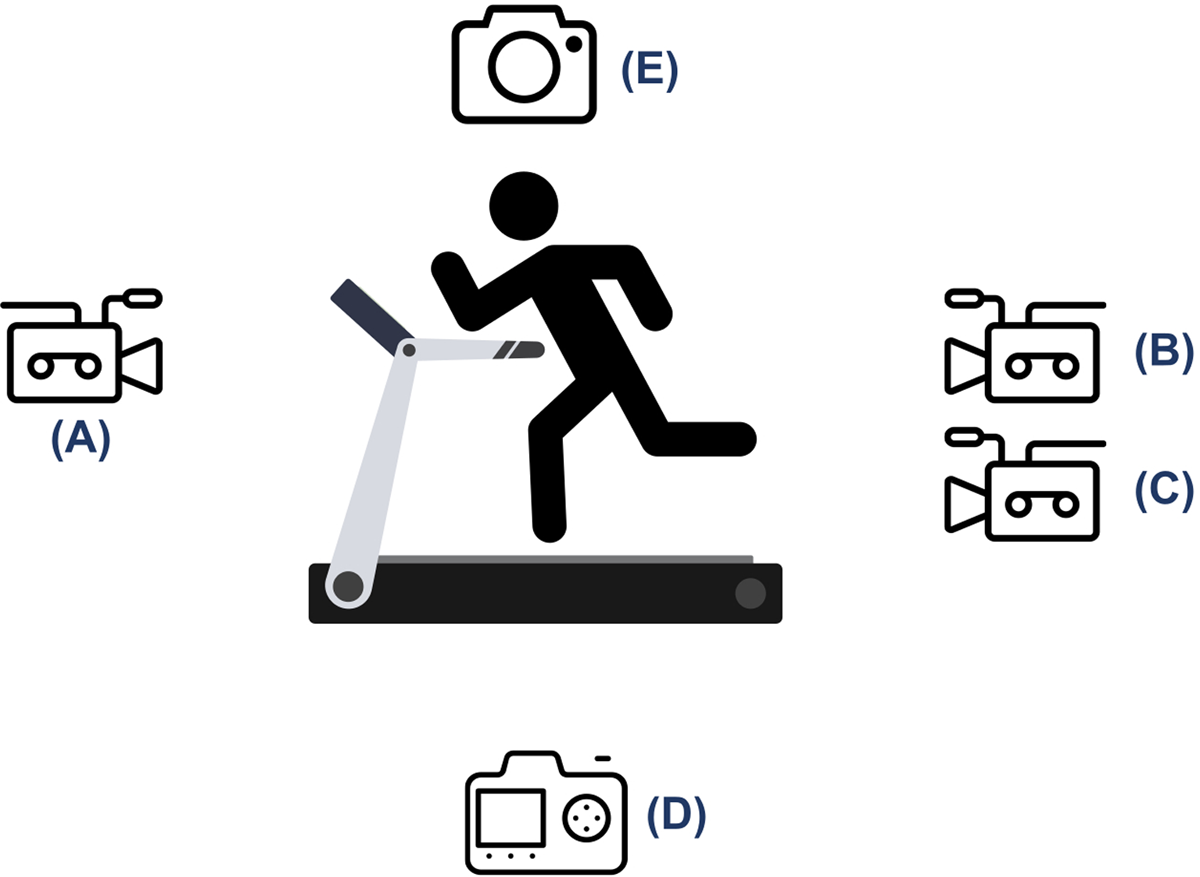
Figure 4
One camera set at five different positions to record participants’ running, including (A) frontal view, (B) full body back view, (C) lower back view (focusing the ankles and feet), (D) left sagittal view, and (E) right sagittal view.
Table 1
Comparison of foot morphological characteristics and running kinematics between the left and right limbs.
| LEFT | RIGHT | p | EFFECT SIZE (r) | ||
|---|---|---|---|---|---|
| Foot morphological characteristics | |||||
| Foot size (US size) | 7.5 (1.5) | 7.0 (1.5) | 0.063 | 0.184 | Small |
| Foot width# | 5.5 (1.0) | 5.0 (1.0) | 0.578 | 0.058 | Negligible |
| Arch length (US size) | 8.0 (1.8) | 8.5 (2.0) | 0.564 | –0.060 | Negligible |
| Bunion angle (deg) | 11.0 (10.0) | 11.5 (10.3) | 0.803 | 0.027 | Negligible |
| Navicular drop (mm) | 6.0 (4.0) | 7.0 (4.5) | 0.517 | –0.070 | Negligible |
| Lower extremity kinematics | |||||
| Initial foot inversion (deg) | 4.3 (4.4) | 3.6 (4.8) | 0.182 | 0.143 | Small |
| Foot eversion excursion (deg) | 14.8 (6.0) | 15.5 (5.6) | 0.080 | –0.187 | Small |
| Time to peak foot eversion (%) | 33.2 (6.8) | 33.6 (6.5) | 0.441 | 0.083 | Negligible |
| Peak foot adduction (deg) | –5.4 (8.8) | –7.1 (8.2) | 0.871 | –0.018 | Negligible |
| Peak foot eversion (deg) | 10.2 (5.0) | 11.0 (6.4) | 0.014* | –0.262 | Small |
| Peak ankle dorsiflexion (deg) | 77.2 (3.8) | 77.0 (4.5) | 0.871 | –0.018 | Negligible |
| Peak knee flexion (deg) | 39.5 (3.5) | 40.4 (2.7) | 0.002* | –0.338 | Medium |
| Peak knee abduction (deg) | –46.8 (338.7) | 157.4 (343.6) | 0.079 | –0.188 | Small |
| Peak hip adduction (deg) | 80.5 (3.5) | 77.8 (6.1) | <0.001* | 0.364 | Medium |
| Peak contralateral hip drop (deg) | 5.1 (3.3) | 5.7 (4.0) | 0.165 | –0.149 | Small |
[i] The results are shown as group median (interquartile range, IQR). * Significant differences were detected using the Wilcoxon signed-rank tests (p < 0.05). # Foot widths were measured as AAA, AA, A, B, C, D, E, EE, or EEE, and coded as 1, 2, 3, 4, 5, 6, 7, 8, or 9; the bigger the number, the wider the foot.
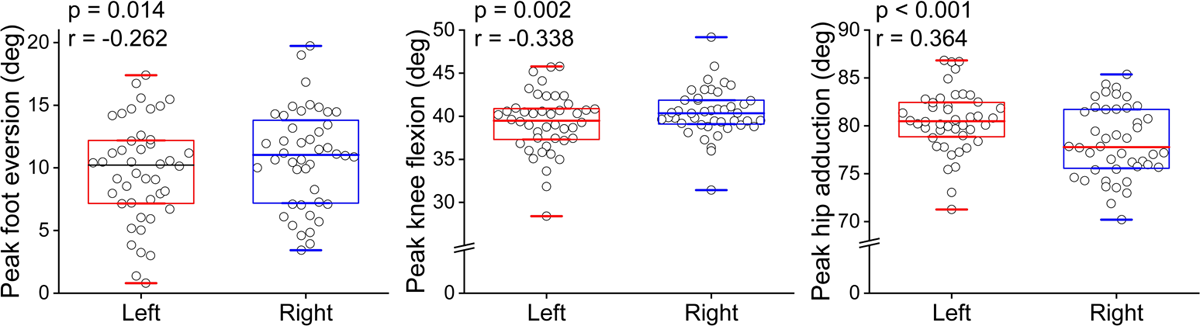
Figure 5
Group median (interquartile range, IQR) and individual data of running kinematics that significantly differed between the left and right limbs.