
Introduction
Runners’ feet can be classified into different types owing to their various structures. It has been well documented that foot morphological characteristics can influence gait biomechanics (Eslami & Ferber, 2013; Kruger et al., 2019; Newman et al., 2013; Zhang et al., 2017). For example, one study allocated participants into three groups according to their foot types, which were planus (low arched), rectus (well aligned hindfoot/forefoot), or cavus (high arched) (Kruger et al., 2019). They observed different walking kinematics for the ankle and foot across the three groups. Another study investigating the association between walking biomechanics and foot types divided participants into different groups based on their magnitudes of pronation (Zhang et al., 2017). The authors reported that participants with over-pronated feet had higher peak rearfoot eversion angles during walking compared with those with normal foot type. Navicular drop measure, a means to quantify the magnitude of foot pronation, has been found associated with running-related injuries (e.g., medial tibial stress syndrome) (Newman et al., 2013). One study observed that navicular drop did not influence the forefoot-rearfoot coupling pattern during running (Eslami & Ferber, 2013). However, another study observed a negative relationship between the navicular drop and tibial internal rotation excursion, and a positive relationship between navicular drop and ankle and knee joint moments (Eslami et al., 2014). The mixed evidence in the literature suggests that the relationship between foot morphology and running gait warrants further investigation.
When analyzing human feet, some researchers advocate the avoidance of using both feet from the same participant to avoid doubling the sample size and possibly increasing statistical significance (Menz, 2005). Hence, selecting one limb for analysis or averaging both limbs could be more appropriate than analyzing two limbs independently. On the other hand, the data from both limbs should be treated independently in some situations where unmatched diseases/symptoms are present between limbs (Menz, 2005). The above-mentioned studies (Eslami et al., 2014; Eslami & Ferber, 2013; Kruger et al., 2019; Zhang et al., 2017) generally selected one limb for each participant, but only one of them clearly stated the selection of the right foot to analyze both foot morphological characteristics and running/walking gait (Eslami et al., 2014). One study did not indicate the use of one foot or the average of both feet to classify the foot types (Kruger et al., 2019). When investigating healthy, asymptomatic participants, two studies arbitrarily chose the right feet to determine their foot types (Eslami & Ferber, 2013; Zhang et al., 2017), but it is unclear whether the walking or running gait analyses were conducted for the same limb only or not. Gait symmetry has been a hot topic, attracting a lot of attentions even for healthy participants with no symptoms (Block & Shakoor, 2010; Hanley & Tucker, 2018; Radzak et al., 2017). During running, previous studies often found between-limb differences in biomechanical variables, such as ground reaction forces (GRF), lower limb kinematics, and temporal parameters (Hanley & Tucker, 2018; Radzak et al., 2017). Thus, it is inappropriate to focus on the gait patterns of one limb only while neglecting the possible between-limb differences. Researchers and practitioners are advised to exercise caution when classifying foot types based on only one foot, and then quantify gait asymmetry between both limbs.
To facilitate gait analysis for walking and running, 3D motion capture technique has been recognized as the gold standard (Maykut et al., 2015) but this technique has its limitations. For example, 3D motion capture is usually expensive and requires experts to perform complicated, time-consuming data collection and processing. Using high-speed digital cameras and incorporating 2D video analysis may pose as an alternative, especially in clinical settings owing to the low cost and simplicity (Kakouris et al., 2021; Louw & Deary, 2014). In addition, video-based 2D analysis also showed good test-retest reliability (Dingenen, Barton, et al., 2018; Pipkin et al., 2016). Previous work has reported a good agreement between 2D video analysis and 3D motion capture technique for running gait analysis (Dingenen, Staes, et al., 2018; Maykut et al., 2015). Hence, it is possible to apply 2D video analysis in running gait analysis.
Previous studies generally used one foot to allocate participants into groups with different foot types and then compared the running or walking biomechanics for one limb between groups, neglecting the possible gait asymmetry or different foot morphology between limbs (Eslami et al., 2014; Eslami & Ferber, 2013; Kruger et al., 2019; Zhang et al., 2017). This study, therefore, aimed to comprehensively analyze the foot morphological characteristics and video-based 2D running kinematics of the lower extremity for both left and right feet. It was hypothesized that the lack of between-limb differences in running kinematics would be accompanied by the lack of differences in foot morphological characteristics between the left and right feet.
Methods
Participants
This study was approved by the Nanyang Technological University Institutional Review Board (IRB Number: IRB-2021-124). Female and male recreational runners who were aged between 18 and 45 years old (Dingenen, Barton, et al., 2018) were recruited. The inclusion criteria were that participants 1) were recreational runner and not competing at a club or national level, 2) ran at least once a week for the past three months, 3) had experience in treadmill running and did not require to hold onto the handrails for support, and 4) were able to run continuously at a minimum speed of 8 km/h (2.2 m/s) for at least 10 min. Participants were excluded if they 1) were pregnant during the time of the study (for female participants only), 2) answered ‘Yes’ to any of the questions in the Physical Activity Readiness Questionnaire (PAR-Q+) (Warburton et al., 2019), indicating the presence of any serious health conditions which may affect running performance, 3) received surgeries on the legs within the past year, or 4) sustained serious injuries to lower limbs which required more than 7 days of rest in the past 6 months. Forty-four healthy participants [20 females, 24 males; group mean (standard deviation); age 25.1 (6.5) years old; height 167.2 (7.0) cm; body mass 62.8 (8.1) kg] were selected for analysis.
Procedures
The participants were required to wear their own running shoes. Tight-fitting, short attires were worn to reduce the marker movements during running. Cloth tape was fixed on 13 anatomical points on body in each limb (and hence 26 in total, Figure 1), including anterior superior iliac spine (ASIS), base of patella, talus, point between second and third metatarsals, posterior superior iliac spine (PSIS), mid-shank, Achilles tendon, calcaneus, extended line from greater trochanter towards the knee, lateral femoral epicondyle, lateral malleolus, and 2 markers on the shoe sole (fibular trochlea and fifth metatarsal head) (Dingenen, Barton, et al., 2018; Dingenen, Staes, et al., 2018).
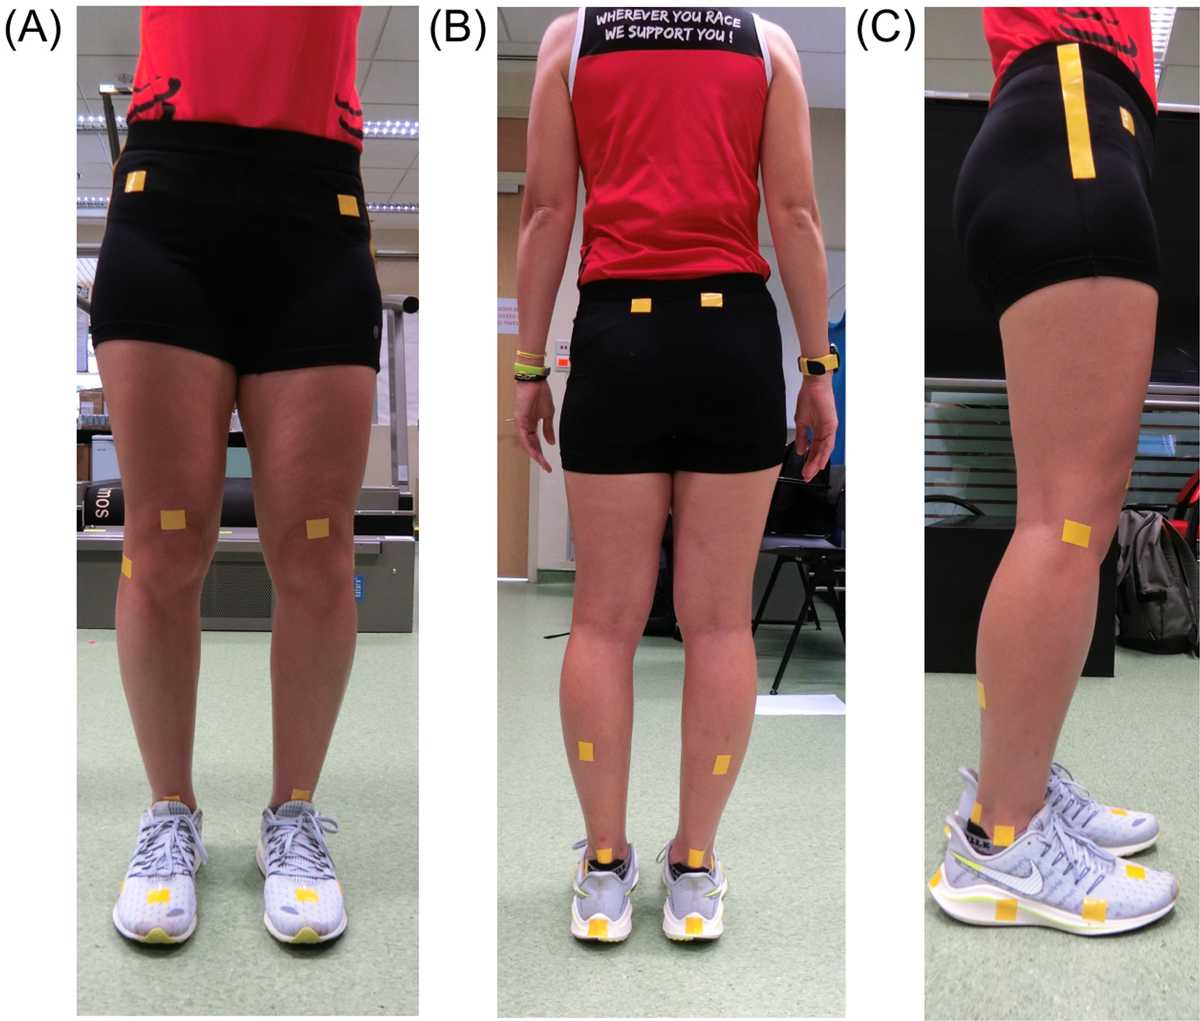
Figure 1
Marker placement with cloth tape. (A) Markers from the frontal view comprising the anterior superior iliac spine (ASIS), base of patella, talus, and point between second and third metatarsals. (B) Markers from the back view including the posterior superior iliac spine (PSIS), mid-shank, Achilles tendon, and calcaneus. (C) Markers from the sagittal view consisted of an extended line from greater trochanter towards the knee, lateral femoral epicondyle, lateral malleolus, and 2 markers on the shoe sole (fibular trochlea and fifth metatarsal head).
Data acquisition and analysis
A standard Brannock device (The Brannock Device Co., Liverpool, NY, USA; Figure 2) was used to measure the foot lengths, arch lengths, and foot widths for both feet for all participants (Kong et al., 2015). Foot lengths and arch lengths were both expressed in the US sizes. Foot widths were measured as AAA, AA, A, B, C, D, E, EE, or EEE, and coded as 1, 2, 3, 4, 5, 6, 7, 8, or 9; the bigger the number, the wider the foot (Kong et al., 2015; Luximon & Goonetilleke, 2004). Navicular drop and hallux valgus (bunion) angle measures were performed by the same research team member for consistency. To measure the bunion angle (Figure 3a), a top-view, static photo covering both feet was taken for each participant (Fong et al., 2021). The bunion angles were quantified using the Kinovea software (Version 0.8.27, Kinovea, Bordeaux, France; available for download at http://www.kinovea.org). Navicular drop was measured for both feet following the methods provided in the previous studies (Barton et al., 2010; Menz, 1998). A vertical distance of the navicular tuberosity drop from the neutral position (Figure 3b) to the relaxing condition (Figure 3c) was measured.
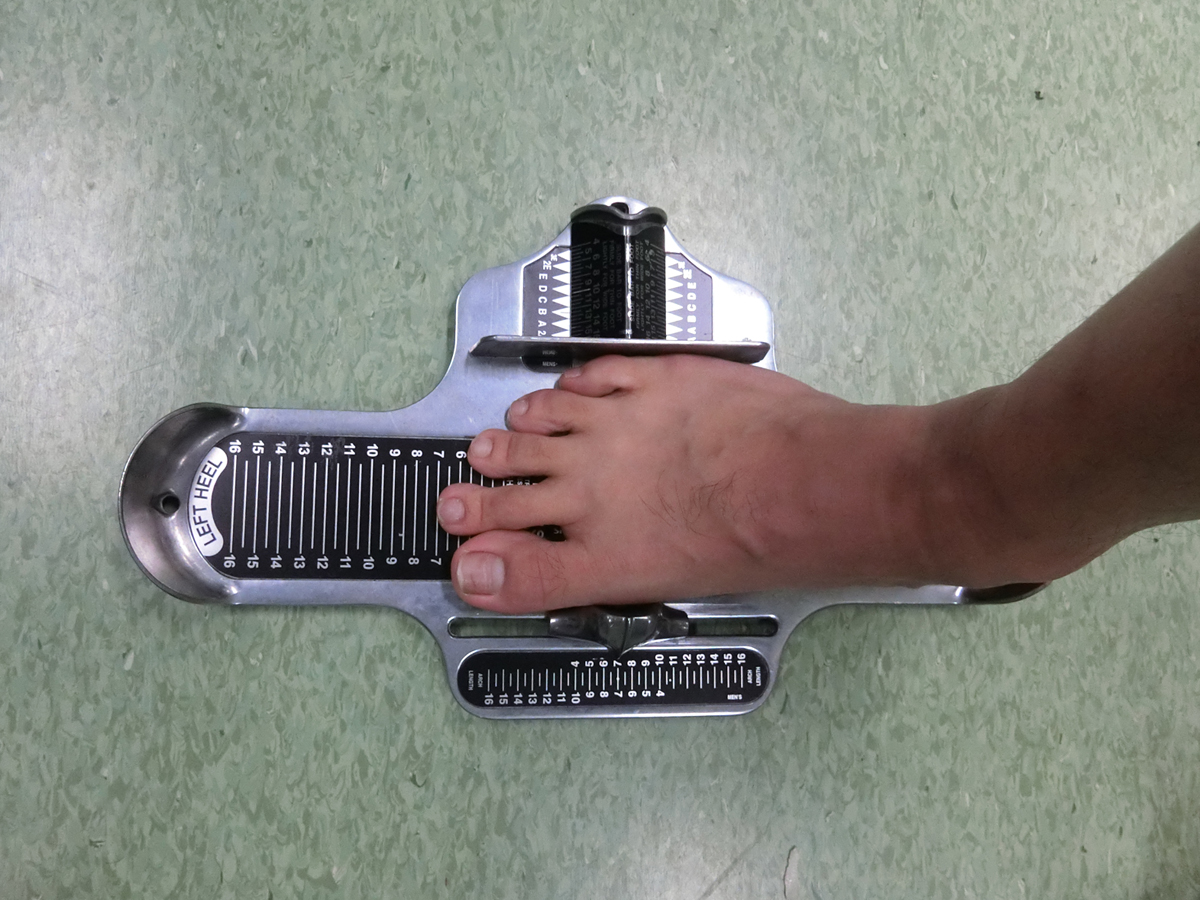
Figure 2
Example of morphology measurement for a right foot using a standard Brannock device.
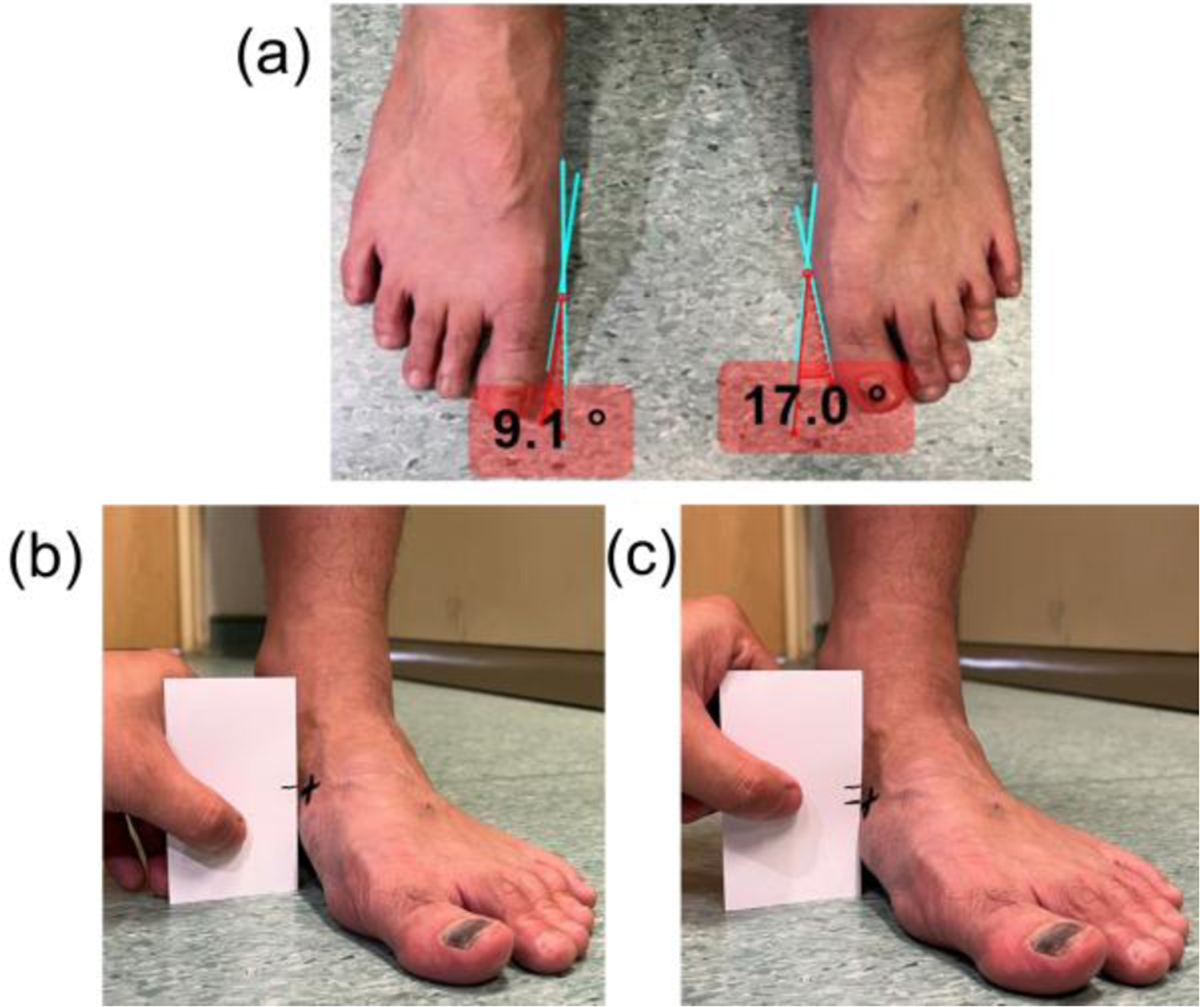
Figure 3
(a) Hallux valgus (bunion) angle measurements using top-view photographs of the feet. Navicular drop measured as the vertical distance of the navicular tuberosity drop from (b) the neutral position to (c) the relaxing position.
Prior to the running experiment, each participant was given a 5-min walk-to-run warm-up and familiarization period on the treadmill (h/p/ cosmos saturn, h/p/cosmos® sports & medical gmbh, Nusseldorf-Traunstein, Germany). Immediately after, treadmill speeds were slowly increased until a point whereby the participants felt the speeds were right for them. While running at these self-selected speeds [mean speed: 9.37 (1.12) km/h], the researchers verbally confirmed with the participants again to ensure that they felt comfortable with the running speeds. The speeds were maintained till the end of the running session (around 10 min). The participants were instructed to run using their usual running techniques (i.e., forefoot strike, rearfoot strike) for the entire running session.
During the running session, a digital camera (120 Hz, model EX-100, Casio Computer CO., LTD, Tokyo, Japan) was used to record the participants’ running at five different positions (Figure 4). The five camera views were A) frontal view, B) full body back view, C) lower back view (focusing the ankles and feet), D) left sagittal view, and E) right sagittal view. For each camera position, the camera was positioned approximately 1.5 m away from the participants.
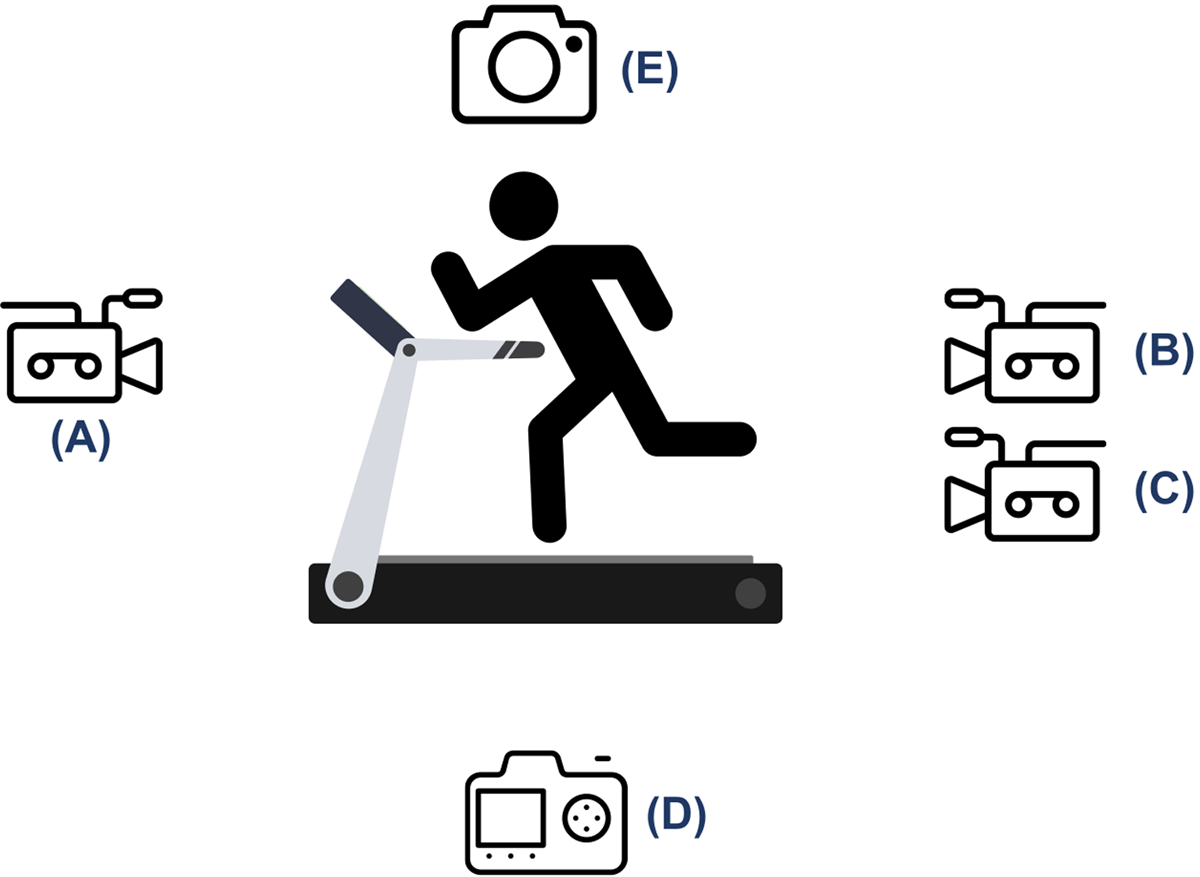
Figure 4
One camera set at five different positions to record participants’ running, including (A) frontal view, (B) full body back view, (C) lower back view (focusing the ankles and feet), (D) left sagittal view, and (E) right sagittal view.
For each participant, the first 30 consecutive strides for each limb, which could clearly show the joints of interest, were analyzed using the free software Kinovea. Ten kinematic variables were measured, similar to the video-based analysis methods that have been reported in the previous studies (Dingenen, Barton, et al., 2018; Maykut et al., 2015; Pipkin et al., 2016). At midstance, peak hip adduction, peak knee abduction, and peak foot adduction were obtained from the frontal view. In the same gait event, peak contralateral hip drop and foot eversion angle were taken from the back view, while peak knee flexion and peak ankle dorsiflexion were taken from the sagittal views. At the moment of footstrike, foot inversion angle from the frontal view was measured. The time taken to achieve peak foot eversion at midstance was also calculated and expressed as a percentage of the total the time taken from the point of footstrike to the moment of toe-off for the same foot. Lastly, foot eversion excursion (difference between foot inversion angle at footstrike and foot eversion angle at midstance, from the frontal view) was computed. The average values of all variables across the 30 strides were used for analysis.
Statistical analysis
The data were imported into JASP (version 0.16.3; JASP Team, 2022) statistical software for analysis. According to the results of the Shapiro-Wilk test, the assumption of data normal distribution was violated for some variables investigated and hence, non-parametric statistical tests were applied. Wilcoxon signed-rank test was performed to compare the foot morphological characteristics and running kinematics between the left and right limbs. Effect size (r) was calculated from the Z values and interpreted as small (0.1 ≤ |r| < 0.3), medium (0.3 ≤ |r| < 0.5), or large (|r| ≥ 0.5). All statistical tests were set at the 0.05 level.
Results
According to the results of the Wilcoxon signed-rank test (Table 1), no significant differences in foot morphological characteristics were observed between the left and right feet (all p > 0.05). Regarding the running kinematics of the lower extremities, between-limb significant differences were identified only for peak foot eversion (p = 0.014, small effect size, Figure 5), peak knee flexion (p = 0.002, medium effect size), and peak hip adduction (p < 0.001, medium effect size), while other kinematic variables showed no significant differences (all p > 0.05).
Table 1
Comparison of foot morphological characteristics and running kinematics between the left and right limbs.
| LEFT | RIGHT | p | EFFECT SIZE (r) | ||
|---|---|---|---|---|---|
| Foot morphological characteristics | |||||
| Foot size (US size) | 7.5 (1.5) | 7.0 (1.5) | 0.063 | 0.184 | Small |
| Foot width# | 5.5 (1.0) | 5.0 (1.0) | 0.578 | 0.058 | Negligible |
| Arch length (US size) | 8.0 (1.8) | 8.5 (2.0) | 0.564 | –0.060 | Negligible |
| Bunion angle (deg) | 11.0 (10.0) | 11.5 (10.3) | 0.803 | 0.027 | Negligible |
| Navicular drop (mm) | 6.0 (4.0) | 7.0 (4.5) | 0.517 | –0.070 | Negligible |
| Lower extremity kinematics | |||||
| Initial foot inversion (deg) | 4.3 (4.4) | 3.6 (4.8) | 0.182 | 0.143 | Small |
| Foot eversion excursion (deg) | 14.8 (6.0) | 15.5 (5.6) | 0.080 | –0.187 | Small |
| Time to peak foot eversion (%) | 33.2 (6.8) | 33.6 (6.5) | 0.441 | 0.083 | Negligible |
| Peak foot adduction (deg) | –5.4 (8.8) | –7.1 (8.2) | 0.871 | –0.018 | Negligible |
| Peak foot eversion (deg) | 10.2 (5.0) | 11.0 (6.4) | 0.014* | –0.262 | Small |
| Peak ankle dorsiflexion (deg) | 77.2 (3.8) | 77.0 (4.5) | 0.871 | –0.018 | Negligible |
| Peak knee flexion (deg) | 39.5 (3.5) | 40.4 (2.7) | 0.002* | –0.338 | Medium |
| Peak knee abduction (deg) | –46.8 (338.7) | 157.4 (343.6) | 0.079 | –0.188 | Small |
| Peak hip adduction (deg) | 80.5 (3.5) | 77.8 (6.1) | <0.001* | 0.364 | Medium |
| Peak contralateral hip drop (deg) | 5.1 (3.3) | 5.7 (4.0) | 0.165 | –0.149 | Small |
[i] The results are shown as group median (interquartile range, IQR). * Significant differences were detected using the Wilcoxon signed-rank tests (p < 0.05). # Foot widths were measured as AAA, AA, A, B, C, D, E, EE, or EEE, and coded as 1, 2, 3, 4, 5, 6, 7, 8, or 9; the bigger the number, the wider the foot.
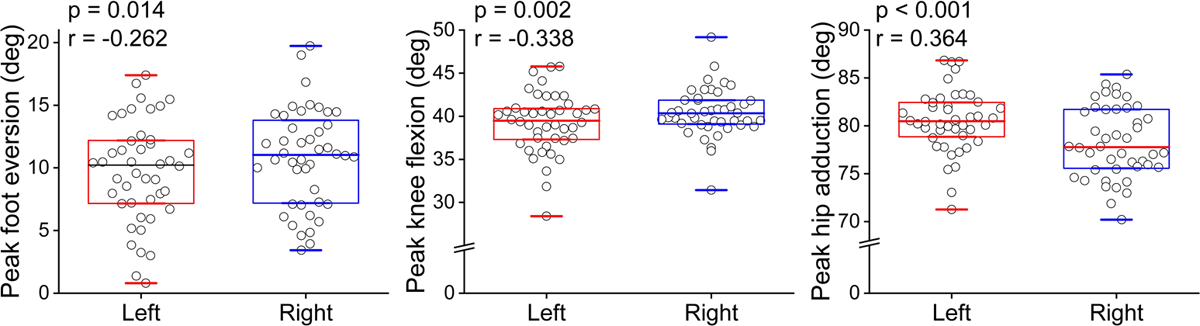
Figure 5
Group median (interquartile range, IQR) and individual data of running kinematics that significantly differed between the left and right limbs.
Discussion
This study compared the foot morphological characteristics and running kinematics of the lower extremities between the left and right limbs among a group of healthy, asymptomatic recreational runners. No significant between-limb differences were found in the foot morphology measures, while several kinematic variables were different between the left and right limbs while running. The hypothesis that similar between-limb running kinematics would be accompanied by the lack of differences in foot morphological characteristics between the left and right feet is rejected according to the results of the present study.
Foot morphology
To quantify foot morphology, this study measured participants’ foot dimensions (foot size, foot width, and arch length), bunion angle, and navicular drop. No significant differences were observed for any foot morphological variables (Table 1). The bunion angle was measured using a recent method proposed by Fong et al. (2021) based on top-view photos and 2D analysis. This new method exhibited excellent intra-rater and inter-rater reliability and good agreement with the widely used Manchester scale (Garrow et al., 2001). However, it is acknowledged that the measured bunion angles should not be directly compared with other radiographic or magnetic resonance image measures typically used in clinical settings (Heineman et al., 2018; Ortiz et al., 2016). Navicular drop can objectively measure the degree of foot pronation and has been used to classify the runners in previous studies (Eslami et al., 2014; Eslami & Ferber, 2013). Recent studies used the navicular drop measures as the criterion (e.g., the cue-off value of 10 mm) to classify flat-foot and normal-foot participants (Koh et al., 2020; Ng et al., 2021). In this present study, the navicular drop values were largely similar between two feet [group median (interquartile range, IQR); left foot 6.0 (4.0) mm, right foot 7.0 (4.5) mm]. The results of relatively small navicular drop values were not surprising as the current study only included healthy, asymptomatic participants. Collectively, foot dimensions, bunion angle, and navicular drop measures indicated similar foot morphology between the left and right feet among a group of healthy recreational runners with no symptoms of running-related injuries in this study.
Running kinematics
Asymmetrical gait patterns may induce running-related injuries (Zifchock et al., 2008), though gait asymmetry is common even for healthy runners with no symptoms (Hanley & Tucker, 2018; Radzak et al., 2017). In this study, several between-limb differences in running kinematics at midstance were identified for peak knee flexion, peak hip adduction, and peak foot eversion (Table 1, Figure 5). Although the magnitudes of the differences were small, these biomechanical variables were reported to be risk factors for running-related injuries (Ceyssens et al., 2019). For example, a small peak knee flexion may lead to insufficient load absorption during the stance phase and hence injuries to the Achilles tendon (Hein et al., 2014). A great peak hip adduction was found related to iliotibial band syndrome (Noehren et al., 2007), while conflicting findings were found for the relationship between peak foot eversion and injury risks (Ceyssens et al., 2019). This study identified between-limb differences in running kinematics but similar foot morphological characteristics between the left and right feet. Many factors can contribute to the gait asymmetry among healthy, asymptomatic runners, for example, muscle fatigue (Arampatzis et al., 1999) and limb dominance (Sadeghi et al., 1997). The unbalanced lower extremity kinematics may contribute to injuries in the future but may not be associated with the foot morphology according to the results of this study.
One foot or two feet
Among the studies on the relationship between foot morphology and gait biomechanics, some researchers determined participants’ foot types (e.g., flat foot) of both feet while did not clearly state the use of one limb or the average of both for gait analysis (Koh et al., 2020; Ng et al., 2021). While participants might have similar foot types bilaterally, this approach cannot capture the possible between-limb differences in running biomechanics. These earlier studies (Koh et al., 2020; Ng et al., 2021) could share similar observations as the present study where there were bilateral similarity in foot morphology and biomechanical differences in gait between limbs. As shown in Table 1 and Figure 5, a few kinematic variables were significantly differed between limbs. Hence, using one limb (or the average of both) to represent the running kinematics for both limbs may be inappropriate due to potential gait asymmetry. Since relatively short running time (less than 10 min) were examined in the studies, similar to this present study, the effects of fatigue (Arampatzis et al., 1999) may be minimal but other factors such as limb dominance (Sadeghi et al., 1997) could possibly lead to asymmetrical gait patterns. On the other hand, some studies either used one foot to classify participants into different groups with different foot types (Eslami et al., 2014; Eslami & Ferber, 2013; Zhang et al., 2017), or did not clearly indicate the use of one or the average of both feet (Kruger et al., 2019). From a practical standpoint, this practice may also be problematic as it is possible for one person to possess a flat (or over-pronated) foot on one side and a normal foot the other. If only one foot was arbitrarily chosen for foot type classification, the participant could be potentially allocated into either a normal group or flat (over-pronated) group. Such grouping methods can confound the research study design, making it difficult to draw meaningful conclusions from the data. While this present study did not find significant differences in any foot morphological characteristics investigated, there were subtle differences between the left and right feet (Table 1). Thus, researchers and practitioners should be aware of the potential between-limb asymmetry in both running kinematics and foot morphology, and exercise caution when examining the relationship between these characteristics.
Limitations
There were a few limitations to the present study. The foot morphology measurements were performed by an undergraduate sport science student without formal clinical training. The measured results may not be comparable to those measured by physicians, physiotherapists, or podiatrists who are clinically trained. In addition, this study adopted a 2D video analysis approach involving manual digitization of peak joint angles at the moments of footstrike and midstance. While this approach increases practicality in terms of clinical applications, it does not provide as much information as an analysis of the entire stance phase. Finally, this study also did not assess the intra-rater or inter-rater reliability for the 2D photo/video analysis including the bunion angle measurement and running kinematic analysis due to limited manpower. Future studies are recommended to assess the intra-rater and inter-rater reliability to supplement the measurement accuracy.
Conclusions
In conclusion, the present study comprehensively examined the foot morphology and running kinematics of both limbs. While no significant differences were identified between both feet for the foot morphological characteristics, differences in several kinematic variables were found between the left and right limbs during running. The results indicate that runners with similar morphological characteristics between the left and right feet can display between-limb gait asymmetry during running. Future studies should avoid arbitrarily analyzing one limb to represent a runner’s gait or foot morphology. If it is necessary to select one limb to represent both, between-limb symmetry should be first confirmed.
Additional File
The additional file for this article can be found as follows:
Data
Participants’ anthropometric, foot morphology, and running kinematic data. DOI: https://doi.org/10.5334/paah.226.s1
Ethics and Consent
This study was approved by the Nanyang Technological University Institutional Review Board (IRB Number: IRB-2021-124). All participants provided written informed consent to participate.
Funding Information
This research is supported by the National Institute of Education, Singapore, under its Research Support for Senior Academic Administrators Grant (RS 2/21 KPW). We wish to acknowledge the funding support for this project from Nanyang Technological University under the URECA Undergraduate Research Programme. Jing Wen Pan was supported by the China Scholarship Council (CSC).
Competing Interests
The authors have no competing interests to declare.