
Table 1
Participant demographic information for 350 participants.
| TOTAL SAMPLE (%) | |
|---|---|
| Gender | |
| Males | 54 (15.4%) |
| Females | 295 (84.3%) |
| Prefer not to answer or nonbinary | 1 (0.30%) |
| Race/Ethnicity | |
| Hispanic/Latino | 10 (2.9%) |
| Non-Hispanic White | 316 (90.3%) |
| Black or African- American | 4 (1.1%) |
| Asian | 11 (3.1%) |
| More than one race/ethnicity | 7 (2.0%) |
| Prefer not to answer | 2 (0.6%) |
| Age (years)a | 39.17 ± 13.45 |
| Pre BMI (kg/m2)a | 26.19 ± 5.66 |
| Post BMI (kg/m2)a | 26.34 ± 6.04 |
| Pre Weight (kg) | 73.82 ± 17.26 |
| Post Weight (kg) | 75.51 ± 17.70* |
| Most Represented States | |
| MN | 105 (30.0%) |
| NY | 38 (10.9%) |
| IA | 13 (3.7%) |
| PA | 13 (3.7%) |
| Annual Incomeb | $100,000–$140,000 |
| Education Levelc | 314 (89.7%)* |
| Type of Residence | |
| Rural | 82 (23.4%) |
| Urban | 86 (24.6%) |
| Suburban | 182 (52.0%) |
| Neighborhood Safetya,d | 1.39 ± .58 |
| Percent Very Safe or Safe | (95.7%) |
| Likelihood of Maintenance | |
| Very Likely | 126 (36.0%) |
| Likely | 135 (38.6%) |
| Not Likely | 89 (25.4%) |
[i] a (Mean ± SD).
b Annual Income is mean and median range.
c Education level is number and percent earned at least a bachelor’s degree.
d Perceived neighborhood safety on a scale of 1–5 (1 = very safe, 5 = very unsafe).
* Denotes significant difference from the initial sample (p < 0.05).
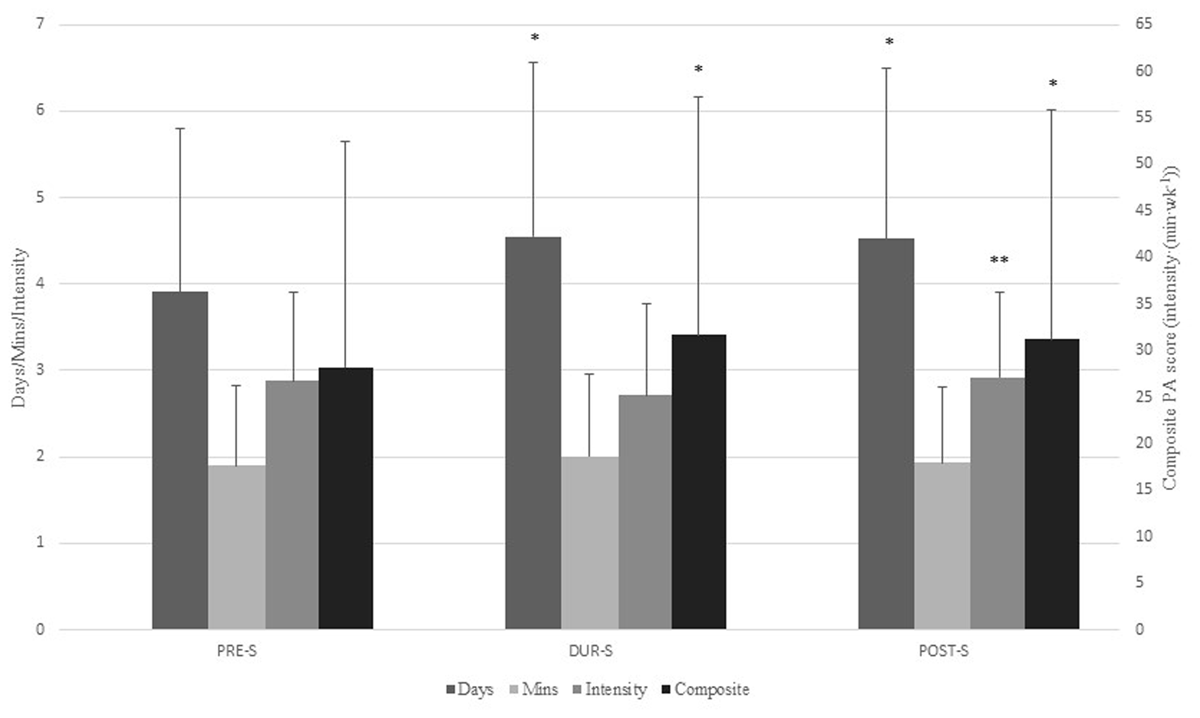
Figure 1
Change in days of PA, minutes of PA, intensity of PA, and weekly composite PA score from PRE-S to DUR-S to POST-S.
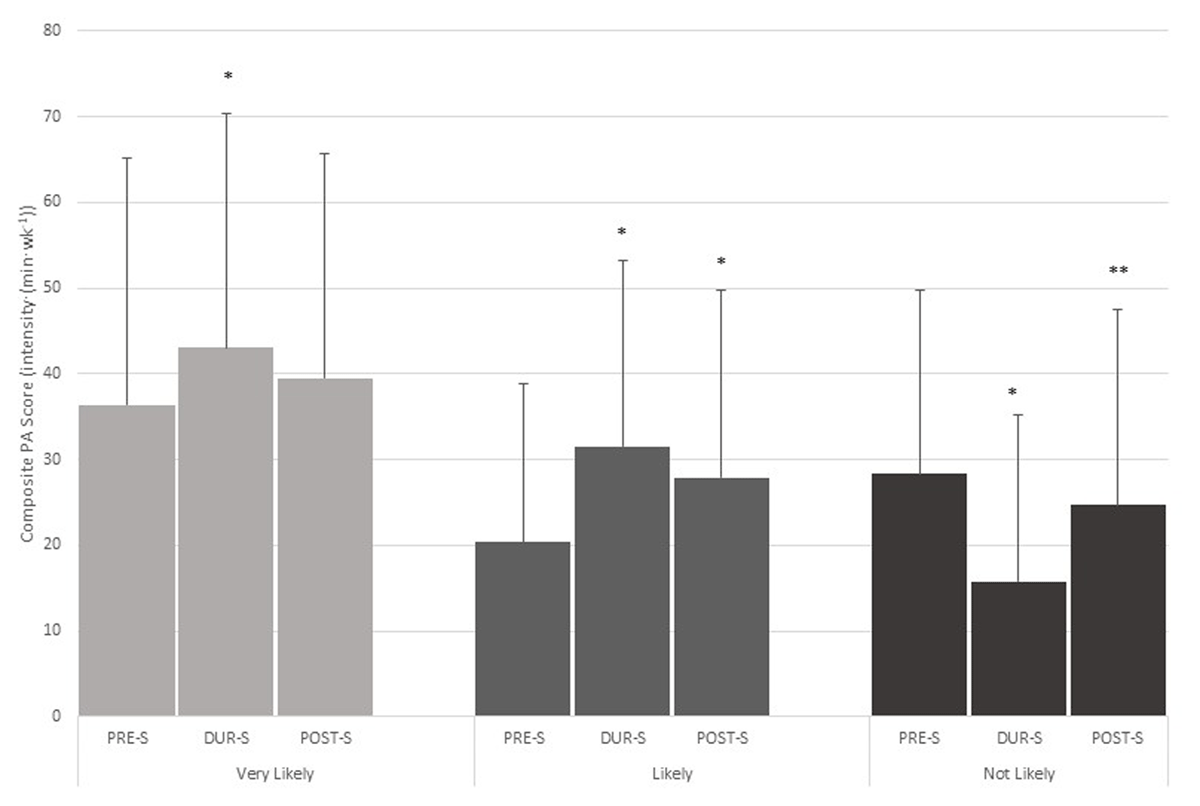
Figure 2
Change in weekly composite PA score for participants who indicated they were very likely, likely, or not likely to maintain their DUR-S PA habits for one year.
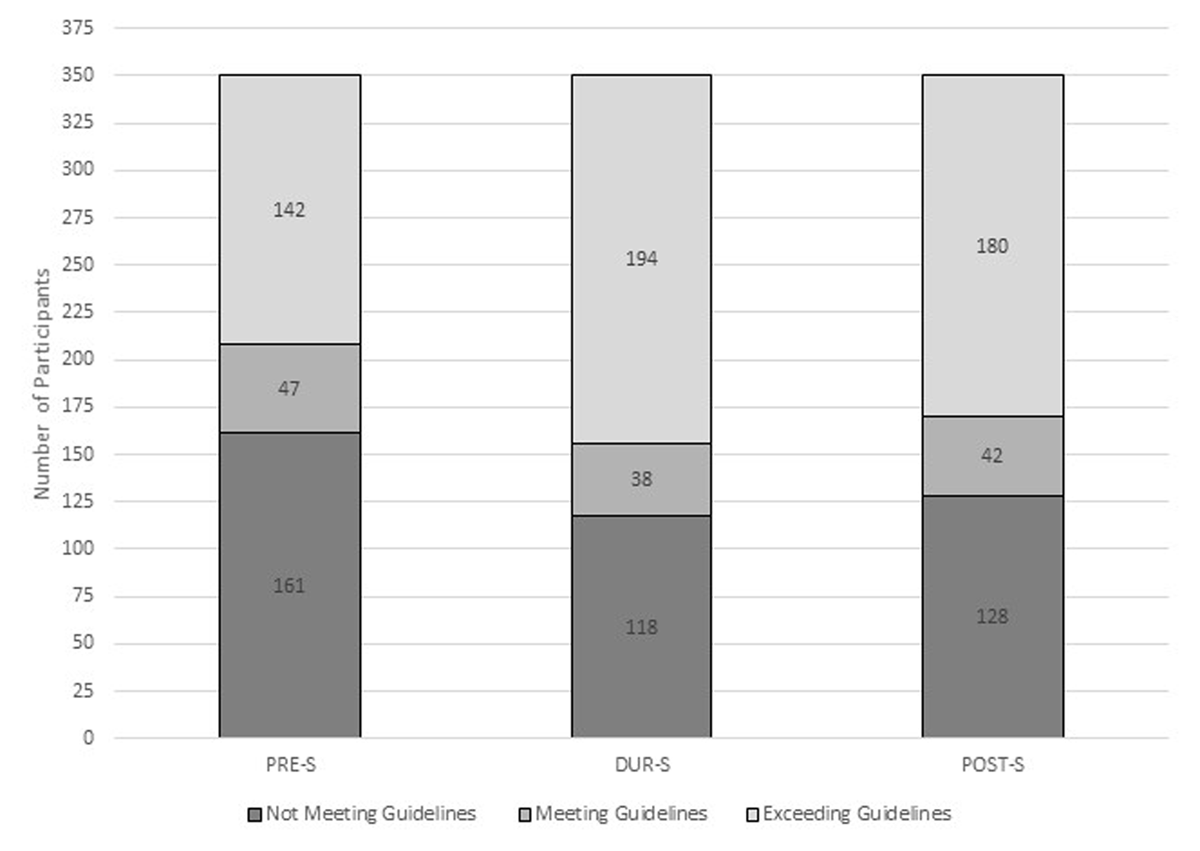
Figure 3
Change in number of participants who did not meet, met, or exceeded the WHO PA guidelines PRE-S to DUR-S to POST-S.
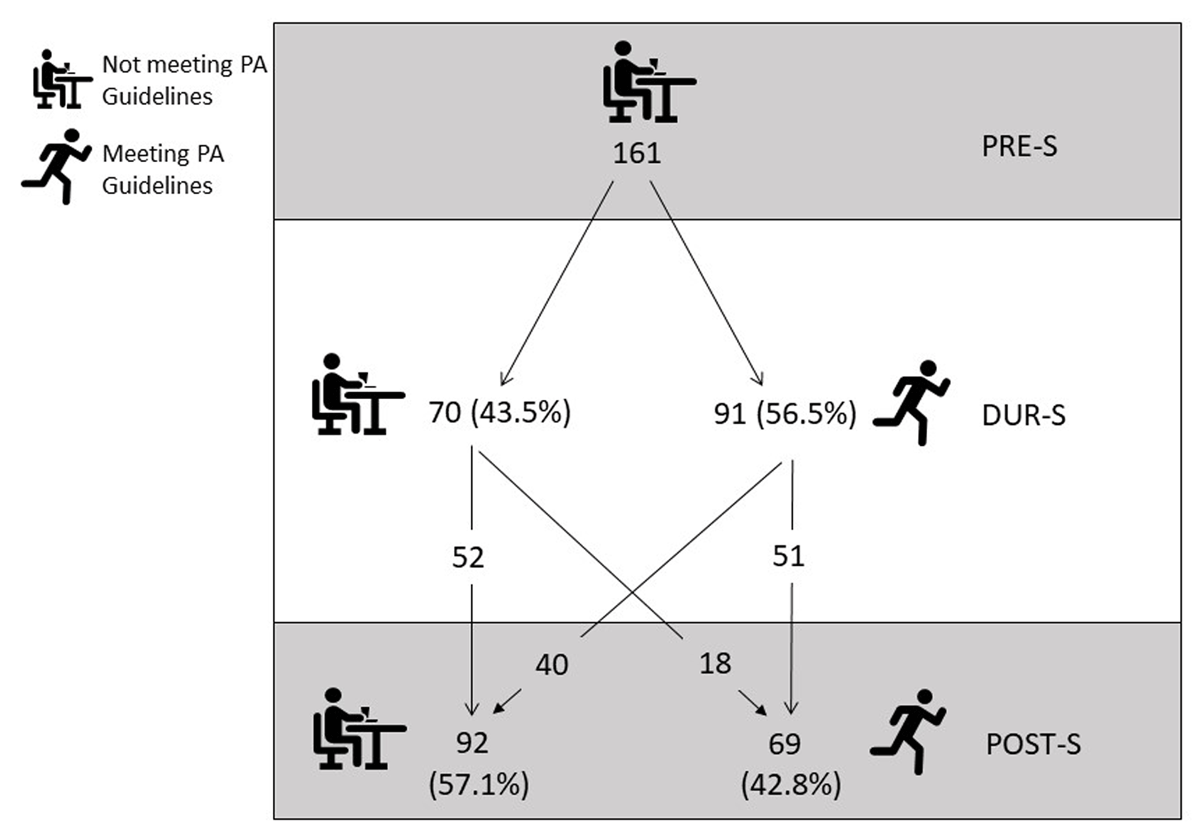
Figure 4
Changes in PA over time for those not meeting WHO PA guidelines pre-shutdown.
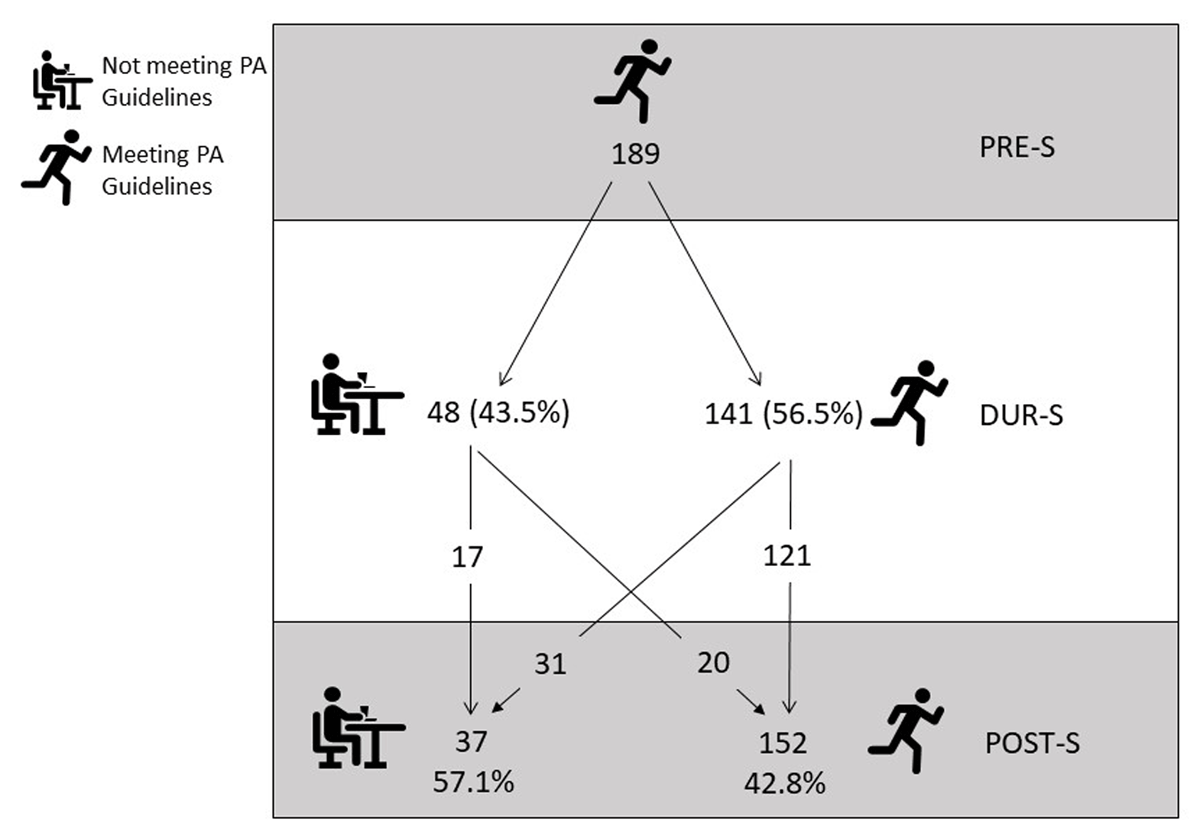
Figure 5
Changes in PA over time for those meeting WHO PA guidelines pre-shutdown.