
Table 1
An 18th century soldier’s daily ration in the British Army (Beattie 1986; Knox 1769; Williamson 1782).
| 1lb. beef, or ½–¾lb. pork, or 1lb. salt fish |
| 1 to 1½lb. bread or flour |
| ¼ pt. pease (peas) or beans |
| 1 oz. butter or cheese |
| 1 oz. rice |
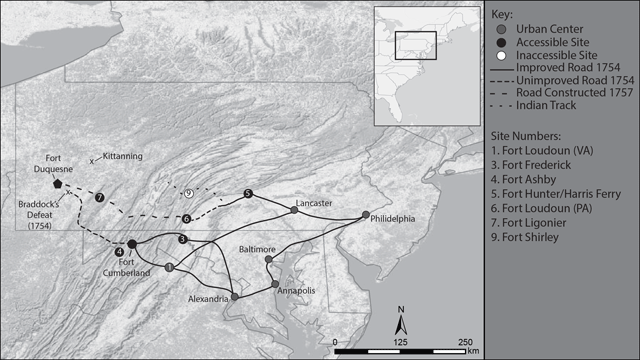
Figure 1
Map of the road systems and placement of British frontier fortifications during the French and Indian War.
Table 2
List of sites with faunal data included in this analysis.
| Grouping | Site | Time Period | Reference |
|---|---|---|---|
| Urban | St. Louis Bastion (QC) | 1760–1800 | Balkwill and Cumbaa 1987 |
| Fort Loudoun (VA) | 1756–1760 | Clark 2003 | |
| Accessible | Fort Frederick (ML) | 1754–1783 | John Milner Associates 1978 |
| Fort Ashby (WV) | 1755–1757 | Martin and Mallard 2008 | |
| Fort Hunter (PA) | 1756–1763 | Dalton 2011 | |
| Fort Loudoun (PA) | 1756–1765 | Webster 1983 | |
| Fort Ligonier (PA) | 1758–1766 | Guilday 1970 | |
| Fort Stanwix (NY) | 1758–1781 | Hanson and Hsu 1975 | |
| Isolated | Fort Shirley (PA) | 1754–1756 | This study |
| Fort Loudoun (TN) | 1757–1760 | Breitburg 1983 | |
| Fort Michilimackinac (MI) | 1761–1781 | Shapiro 1978 |
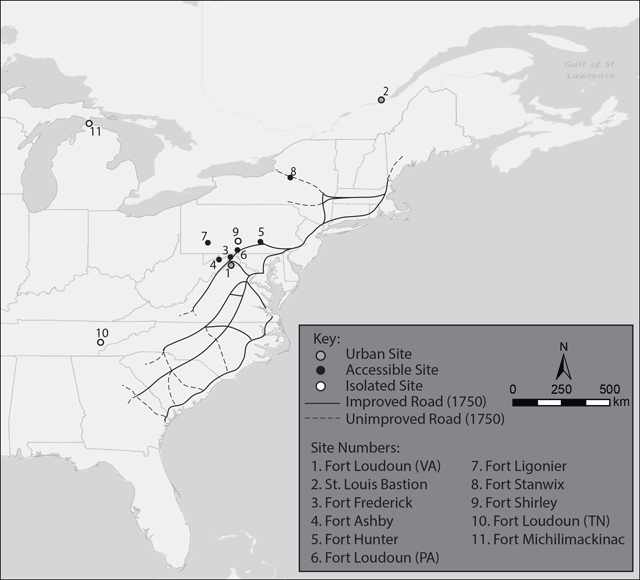
Figure 2
Location of sites with faunal data included in this analysis (numbering follows order in Table 2).
Table 3
Taxa Identified in the Fort Shirley and Aughwick Old Town Assemblages.
| Fort Shirley | Aughwick Old Town | ||||
|---|---|---|---|---|---|
| Species | Scientific Name | NISP | MNI | NISP | MNI |
| Domestic Cow | Bos taurus | 102 | 4 | ||
| Domestic Cow (cf.) | 1 | ||||
| Domestic Pig | Sus domesticus | 27 | 2 | ||
| Domestic Pig (cf.) | 1 | ||||
| Domestic Horse | Equus caballus | 1 | 1 | ||
| Domestic Sheep | Ovis aries | 1 | 1 | ||
| Domestic Dog | Canis familiaris | 59 | 1 | ||
| White-tailed Deer | Odocoileus virginianus | 235 | 13 | 32 | 2 |
| Deer (cf.) | 1 | ||||
| Elk | Cervus canadensis | 1 | 1 | ||
| Black Bear | Ursus americanus | 8 | 1 | 1 | 1 |
| Canid | Canidae | 3 | |||
| American Beaver | Castor canadensis | 2 | 1 | ||
| Skunk (cf.) | Mephitidae | 1 | |||
| Opossum | Didelphis virginiana | 1 | 1 | ||
| Squirrel | 1 | 1 | |||
| Small Rodent | Rodentia | 3 | |||
| Turkey | Meleagris gallopavo | 2 | 1 | 1 | 1 |
| Turtle | Testudines | 49 | 9 | ||
| Unidentified Bird | 23 | 5 | |||
| Unidentified Fish | 58 | 1 | |||
| Unidentified Reptile | 6 | 1 | |||
| Unidentified Shellfish | 46 | ||||
| Large Mammal | 1212 | 15 | |||
| Medium Mammal | 3031 | 6 | |||
| Small Mammal | 309 | 3 | |||
| Unidentified Mammal | 634 | 4 | |||
| Unknown | 167 | 4 | |||
| Total | 5985 | 26 | 87 | 6 | |
Table 4
The total size of assemblages used in this analysis in identified NISP and MNI, and the dietary contribution of important species calculated as a percent of the assemblage identified to species.
| Group | Site | Time Period | NISP (MNI)1 | %Domestic | %Cow | %Pig | %Deer |
|---|---|---|---|---|---|---|---|
| Urban | Fort Loudoun (VA) | 1756–1760 | 290 (40) | 94.14 (77.50) | 48.28 (32.50) | 36.21 (27.50) | 4.48 (12.50) |
| St. Louis Bastion (QC) | 1760–1800 | 338 (21) | 97.04 (80.95) | 34.61 (23.81) | 46.75 (33.33) | 0 (0.00) | |
| Accessible | Fort Frederick (ML) | 1754–1783 | 959 (29) | 98.85 (82.75) | 64.86 (31.03) | 32.33 (34.48) | 0.31 (3.45) |
| Fort Ashby (WV) | 1755–1757 | 61 (11) | 73.77 (63.64) | 50.82 (27.27) | 18.03 (18.18) | 19.67 (18.18) | |
| Fort Hunter (PA) | 1756–1763 | 62 (7) | 85.48 (71.43) | 53.23 (28.57) | 9.68 (14.29) | 9.68 (14.29) | |
| Fort Loudoun (PA) | 1756–1765 | 782 (33) | 84.65 (51.52) | 64.71 (27.27) | 5.75 (12.12) | 0.64 (3.03) | |
| Fort Ligonier (PA) | 1758–1766 | 4552 (104) | 89.52 (60.58) | 59.97 (23.08) | 4.44 (5.77) | 2.54 (15.38) | |
| Fort Stanwix (NY) | 1758–1781 | — (72) | — (65.28) | — (33.33) | — (18.06) | — (18.06) | |
| Isolated | Fort Shirley (PA) | 1754–1756 | 477 (20) | 27.88 (40.00) | 21.59 (20.00) | 5.87 (10.00) | 49.48 (40.00) |
| Fort Loudoun (TN) | 1757–1760 | 1109 (13) | 56.27 (22.03) | 34.90 (6.78) | 16.14 (6.78) | 19.84 (10.17) | |
| Fort Michilimackinac (MI) | 1761–1781 | 354 (77) | 27.02 (24.68) | 8.94 (5.19) | 5.06 (12.99) | 0 (0.00) |
[i] 1Based on NISP and MNI identified to species, see reports for total NISP and MNI.
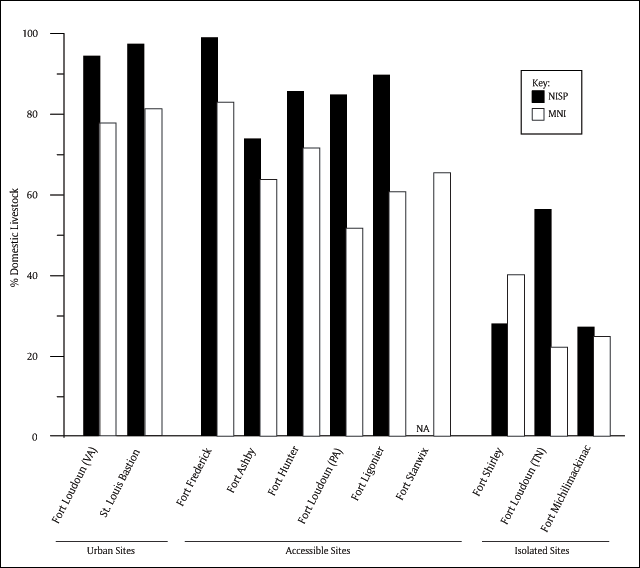
Figure 3
Percent of the Number of Identified Specimens (NISP; black) and Minimum Number of Individuals (MNI; white) composed of domestic livestock on isolated and accessible fortifications included in this analysis.
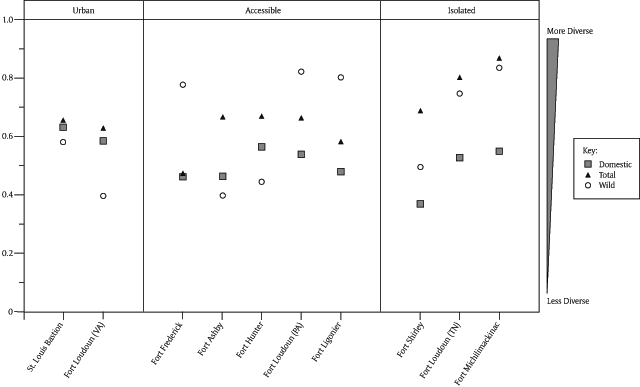
Figure 4
Simpson’s Diversity Indices for the total assemblage, domestic livestock, and wild game in assemblages used for this analysis.
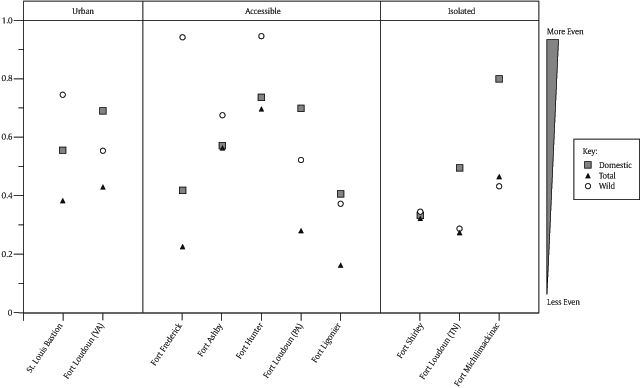
Figure 5
Simpson’s Evenness Indices for the total assemblage, domestic livestock, and wild game in assemblages used in this analysis.