
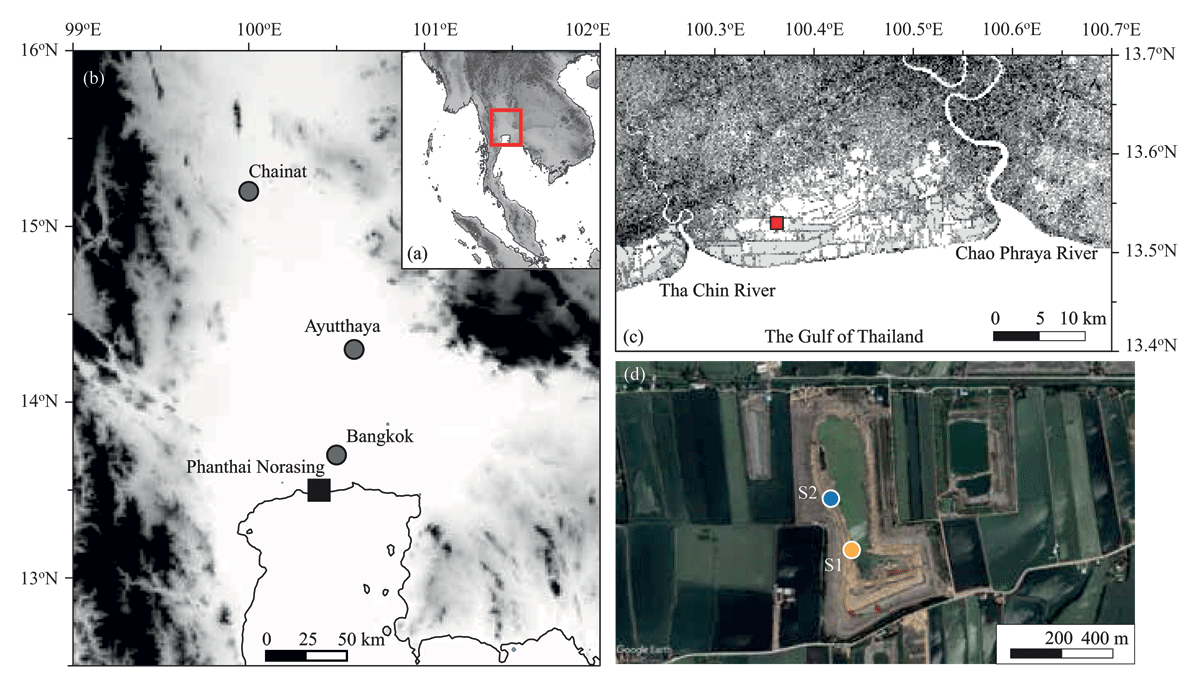
Figure 1
Location of the study area on (a) the lower central plain of Thailand (b) situated 1.5 km west of the Provincial Administrative Organisation of Phanthai Norasing sub-district in Samut Sakhon Province, 50 km west of Bangkok, and 5 km north of the upper Gulf of Thailand (red square) (c). The sediment samples were taken from an unnamed open excavation, covering an area of 0.42 km2 and approximately 24 m depth (d). The sampling sites were moved from S1 (orange circle) to S2 (blue circle) caused by the sediment slump along the open pit road.
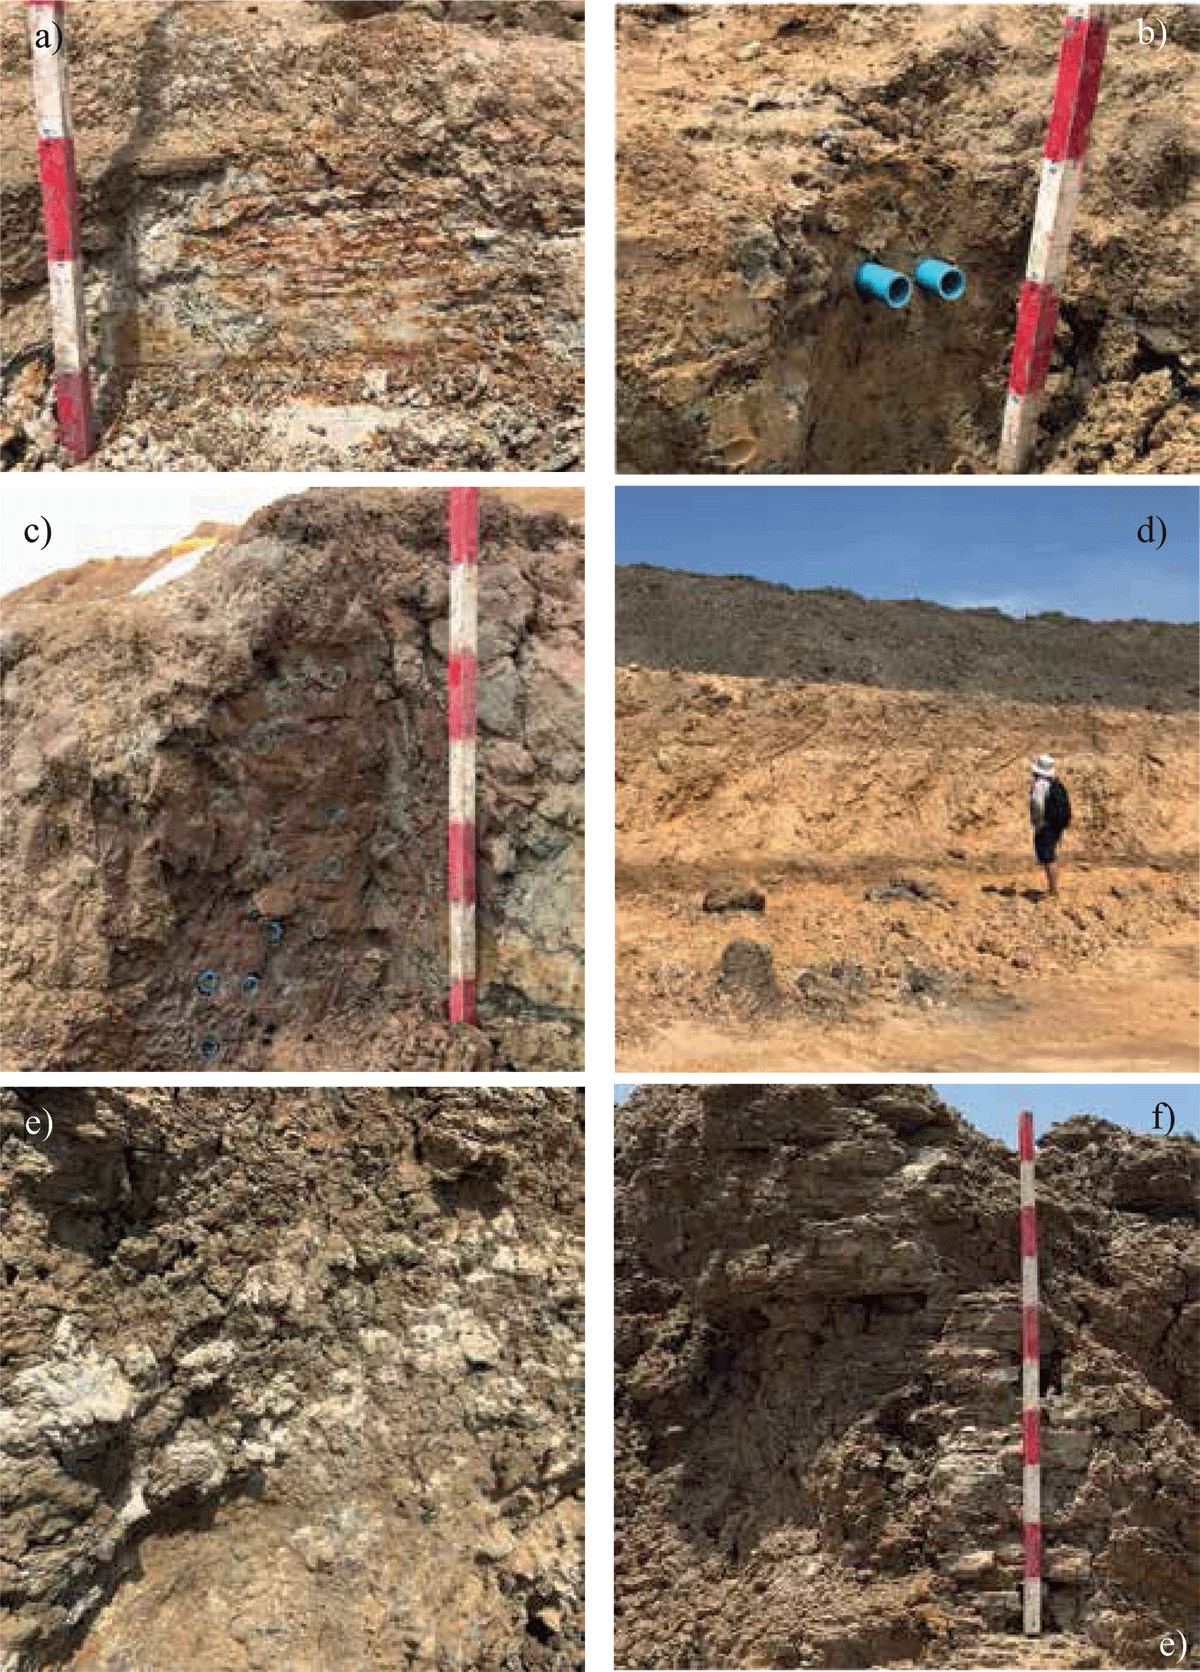
Figure 2
The lowermost unit A composes of light grey clayey silt (a). It is overlaid by unit B, consisting of interbedded clayey and sandy silt layers (b and c). Unit C is the thick bed of the brown silty sand (d), except for the brown silty sand with calcrete or caliche layer (e) from 18.6 to 18.2 meters BMSL. The uppermost unit D consists of thin beds (5–10 cm thick) of light grey clayey silt (f).
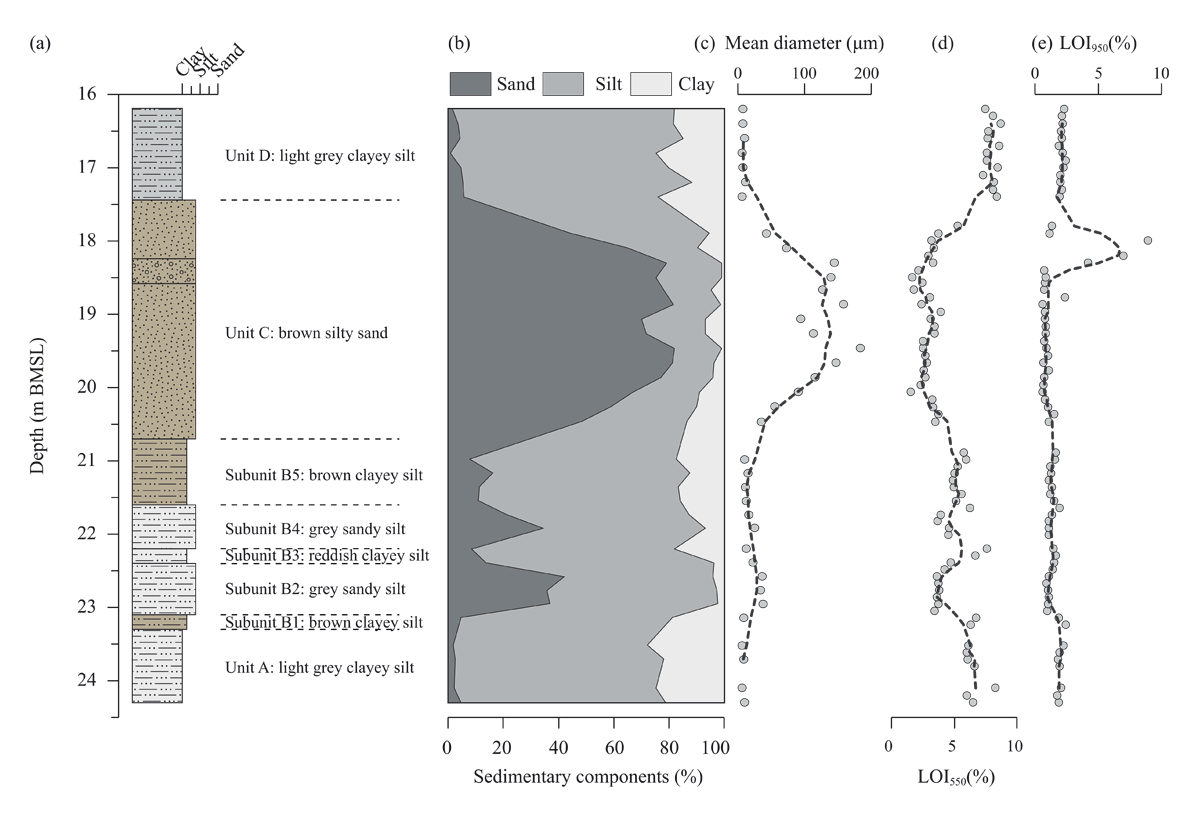
Figure 3
Lithostratigraphy (a), sedimentary compositions (b), mean diameter (c), and LOI at 550 (d) and 950°C (e). The back dash lines are moving average of five data points.
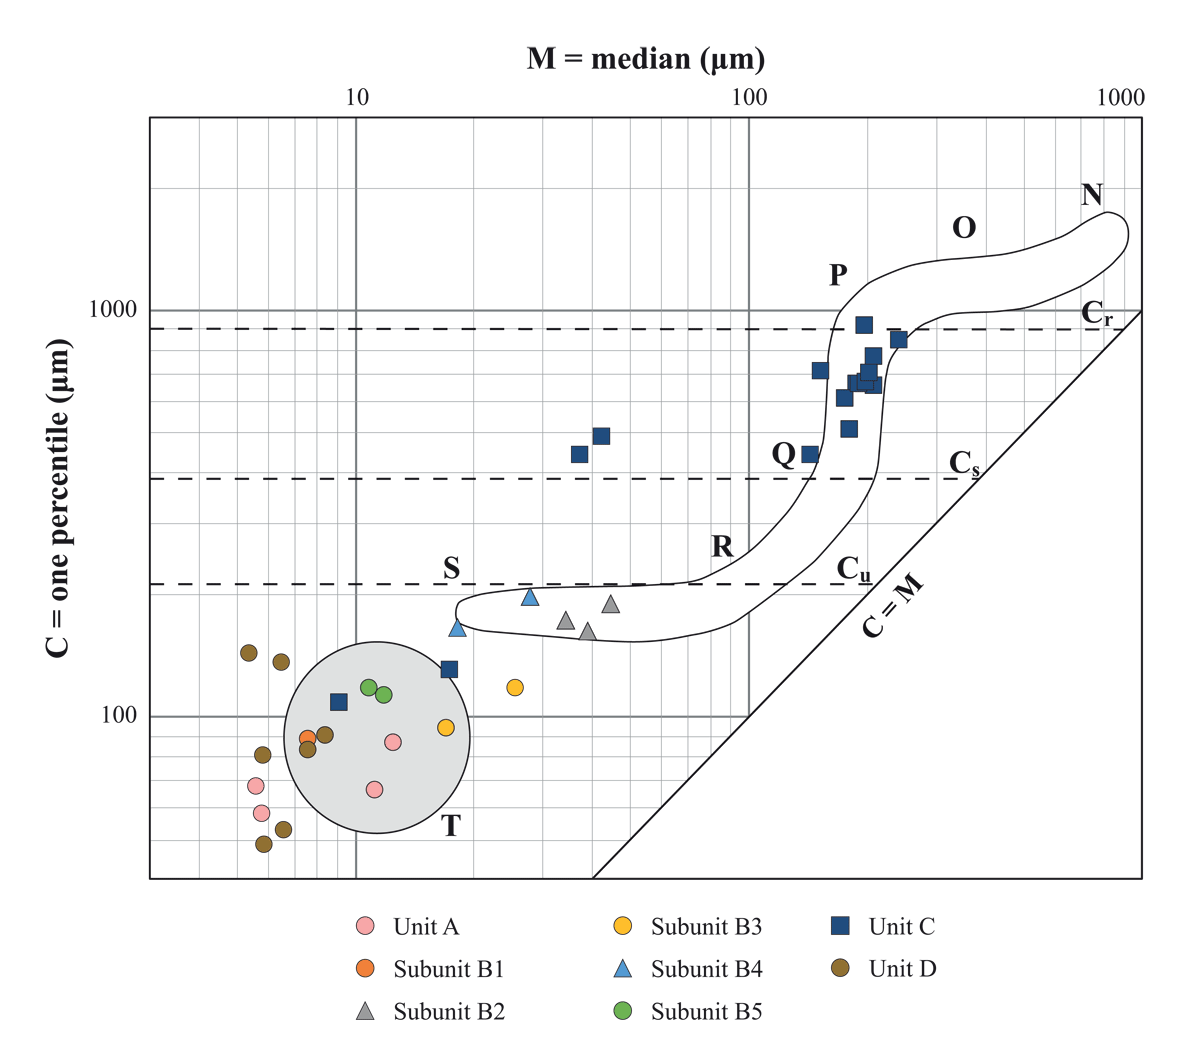
Figure 4
The coarse (C: one percentile) and median (M: fifty percentile) diameters of sediment were illustrated in the CM diagram to elucidate sediment transportation and depositional processes (Passega 1964; Kasim et al. 2023; Miao et al. 2023). According to the river and marine coastal sediment analysis, Passega and Byramjee (1969) established the transportation limits of rolling (Cr), graded suspension (Cs), and uniform suspension (Cu). The diagram is divided into five segments, corresponding points N, O, P, Q, R, S, and T. They consist of rolling (NO), bottom suspension and rolling (OPQ), graded suspension without rolling (QR), uniform suspension (RS), and pelagic suspension (T) (Kasim et al., 2023). The CM diagram demonstrates that pelagic suspension (T) plays a crucial role in the sediment transportation in the sedimentary units A and D, along with subunits B1, B3, and B5 (the circles). The sediment transportation mechanisms shift to uniform suspension (RS) in subunits B2 and B4 (the triangles), and suspension and rolling (PQ) in unit C (the squares), suggesting an increase in transportation energy.
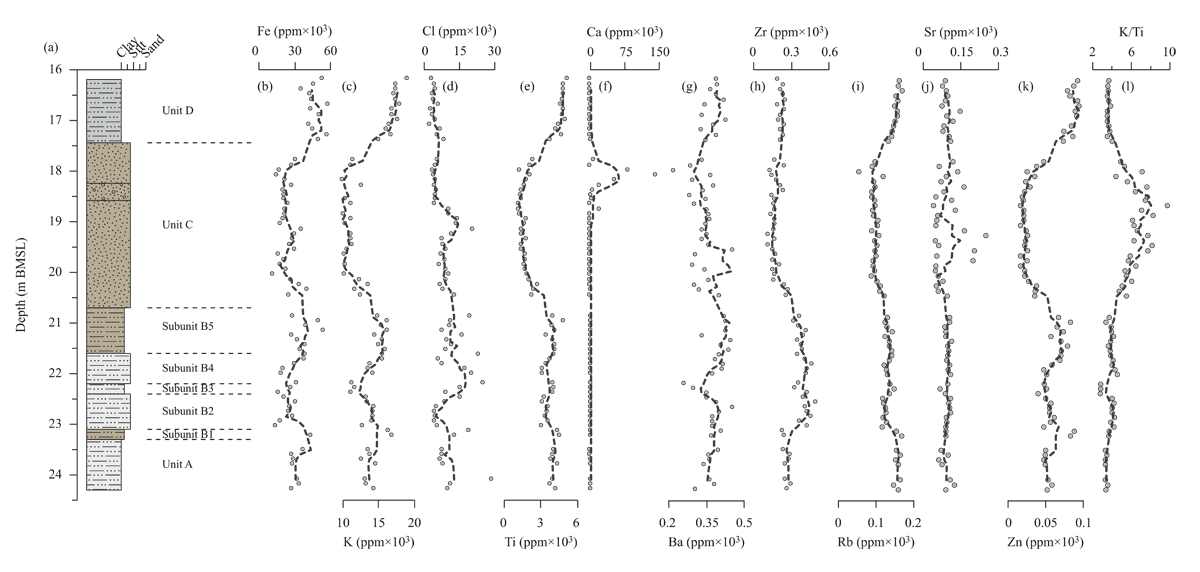
Figure 5
Lithostratigraphy (a), the variation of Fe (b), K (c), Cl (d), Ti (e), Ca (f), Ba (g), Zr (h), Rb (i), Sr (j), and Zn (k) concentrations, as well as the K/Ti ratios (l). The back dash lines are moving average of five data points.
Table 1
The correlation metric assesses the relationship between the concentrations of geochemical components within the sedimentary sequence. The grey highlights indicate the strong correlation of r values over 0.7. The p-values are below 0.001, indicating statistical significance.
| Cl | K | Ti | Fe | Zn | Rb | Sr | Zr | Ba | |
|---|---|---|---|---|---|---|---|---|---|
| Cl | 1.00 | ||||||||
| K | –0.11 | 1.00 | |||||||
| Ti | 0.01 | 0.91 | 1.00 | ||||||
| Fe | –0.04 | 0.75 | 0.67 | 1.00 | |||||
| Zn | –0.08 | 0.95 | 0.93 | 0.80 | 1.00 | ||||
| Rb | 0.09 | 0.82 | 0.92 | 0.59 | 0.81 | 1.00 | |||
| Sr | 0.11 | 0.00 | –0.04 | 0.08 | 0.07 | –0.05 | 1.00 | ||
| Zr | 0.21 | 0.37 | 0.47 | 0.01 | 0.38 | 0.35 | –0.02 | 1.00 | |
| Ba | 0.00 | 0.28 | 0.22 | 0.15 | 0.27 | 0.18 | 0.35 | 0.18 | 1.00 |
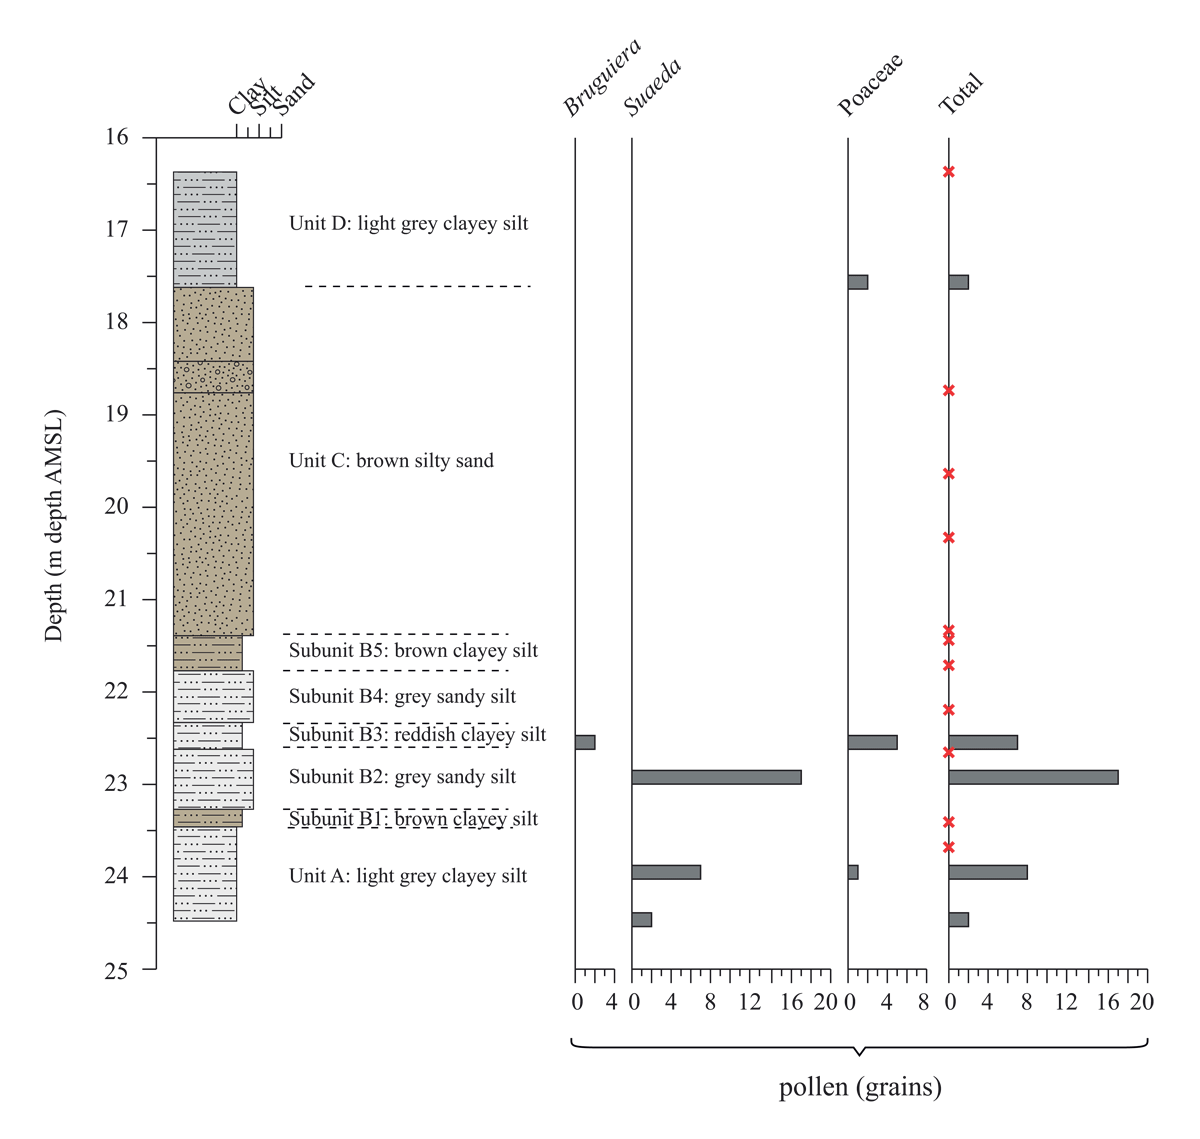
Figure 6
Lithostratigraphy and pollen stratigraphy. The red crosses are the sample that pollen is indeterminable.
Table 2
14C dates for the sediment sequence. Calibration of 14C dates is according to Reimer et al. (2020) and was made with the Calib 8.2 online program (http://calib.org/calib/calib.html). * are radiocarbon dating samples excluded in the age-depth plot in Figure 7.
| LAB CODE | SAMPLE TYPE | FRACTION OF MODERN | RADIOCARBON AGE (KA BP) | DEPTH (M BMSL) | 2-SIGMA (CAL KA BP) | MEDIAN (CAL KA BP) | ||
|---|---|---|---|---|---|---|---|---|
| pMC | ERROR | BP 1 | ERROR | |||||
| D-AMS 050257 | Bulk sediment | 6.291 | 0.08 | 22.22 | 0.102 | 24.32 | 26.11–26.92 | 26.51 |
| D-AMS 048747* | Bulk sediment | 16.85 | 0.13 | 14.31 | 0.062 | 24.30 | 17.12–17.73 | 17.39 |
| D-AMS 050258* | Bulk sediment | 2.473 | 0.053 | 29.72 | 0.172 | 21.94 | 33.91–34.55 | 34.27 |
| D-AMS 048748 | Bulk sediment | 9.33 | 0.11 | 19.05 | 0.095 | 20.88 | 22.70–23.19 | 22.99 |
| D-AMS 050259* | Bulk sediment | 6.14 | 0.11 | 22.42 | 0.144 | 20.16 | 26.38–27.11 | 26.74 |
| D-AMS 050260 | Bulk sediment | 9.624 | 0.09 | 18.81 | 0.075 | 17.30 | 22.50–22.95 | 22.73 |
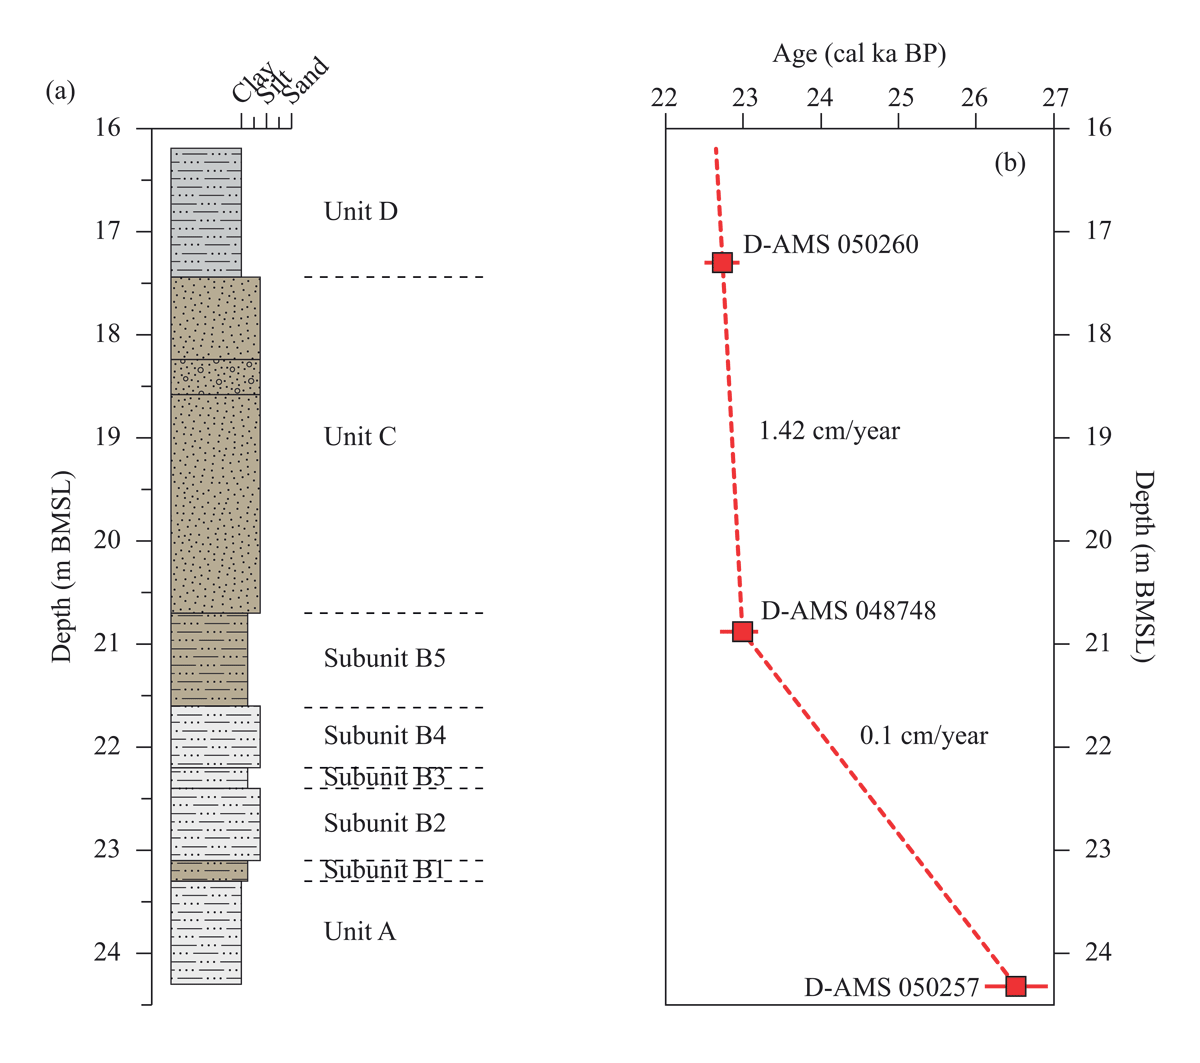
Figure 7
Lithostratigraphy (a) and the age-depth model (b) rely on three radiocarbon dating. The sedimentation rate is approximately 0.1 cm/year in units A and B and significantly increases to 1.42 cm/year in units C and D.
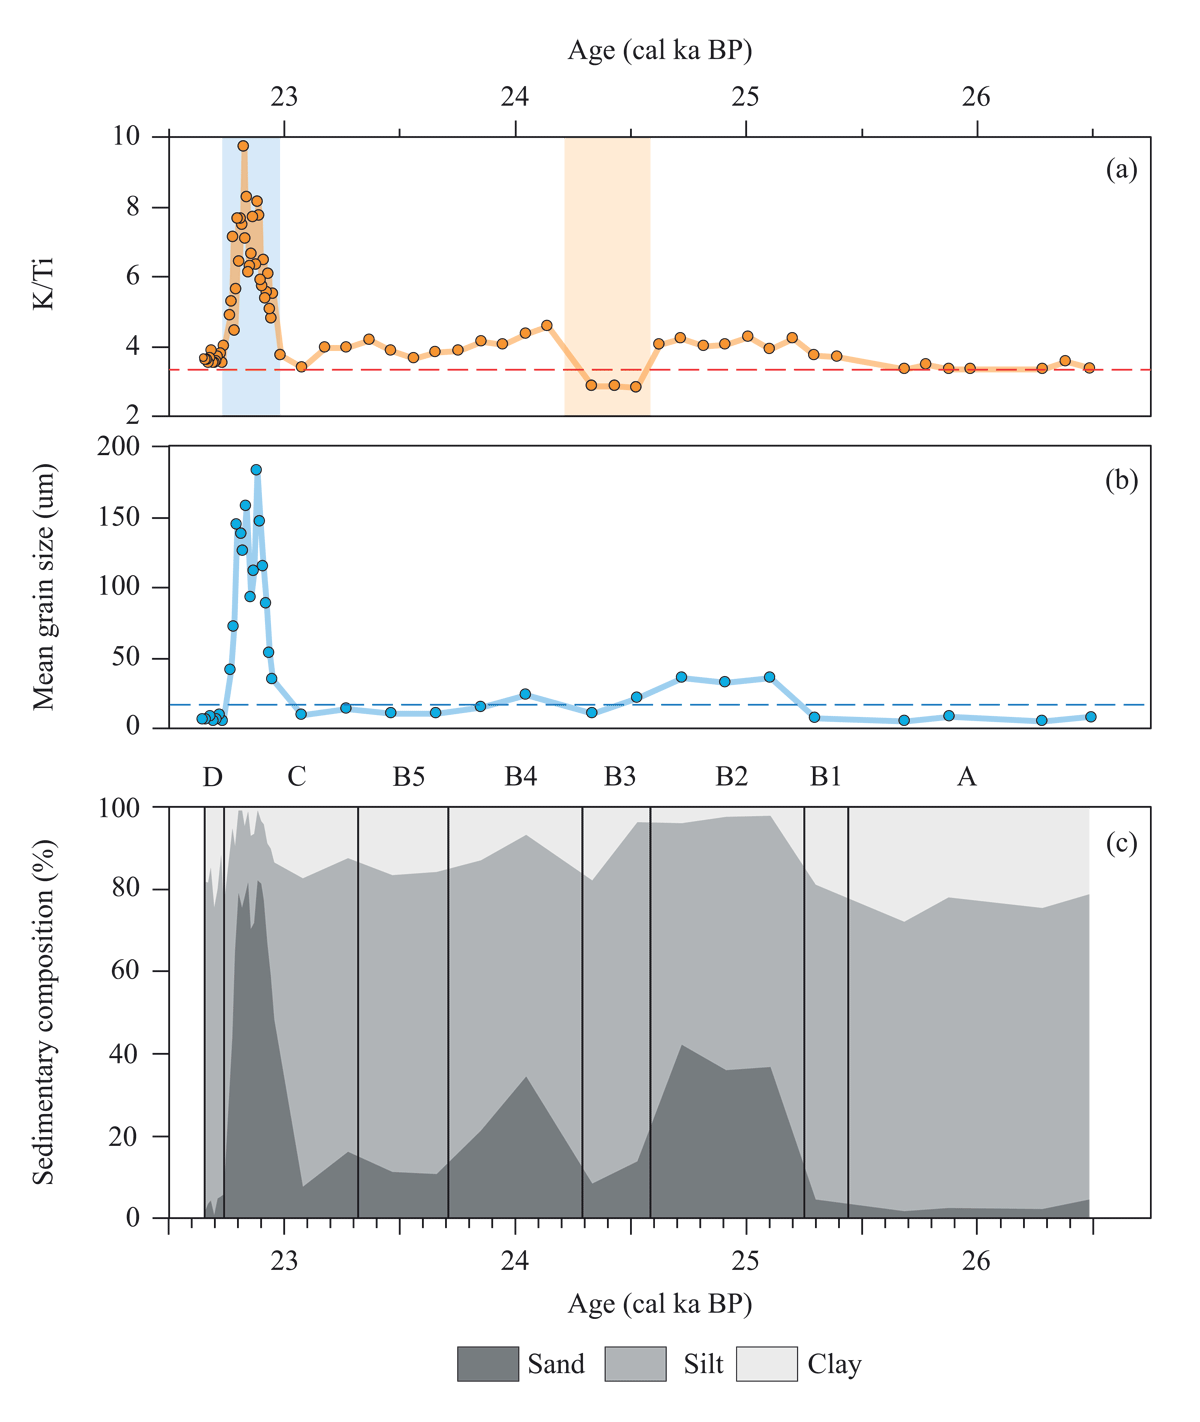
Figure 8
The sedimentary compositions, mean grain size, and the K/Ti ratios show the hydroclimatic change from 26.5 to 22.8 cal ka BP. The results indicate an intense runoff and increased rainfall from 26.5 to 24.6 cal ka BP, followed by a short period of drier conditions about 24.6–24.1 cal ka BP (red shading). Subsequently, there was a progressive decrease in the river runoff and precipitation until 23 cal ka BP, followed by notable wet conditions from 23–22.8 cal ka BP (blue shading). It was then terminated by a sudden lower runoff and precipitation after 22.8 cal ka BP. A comparison of the K/Ti ratio in recent sediment (red dash line) (Hossain et al., 2017) suggests that there may have been similar precipitation amount during the LGM and the present day.
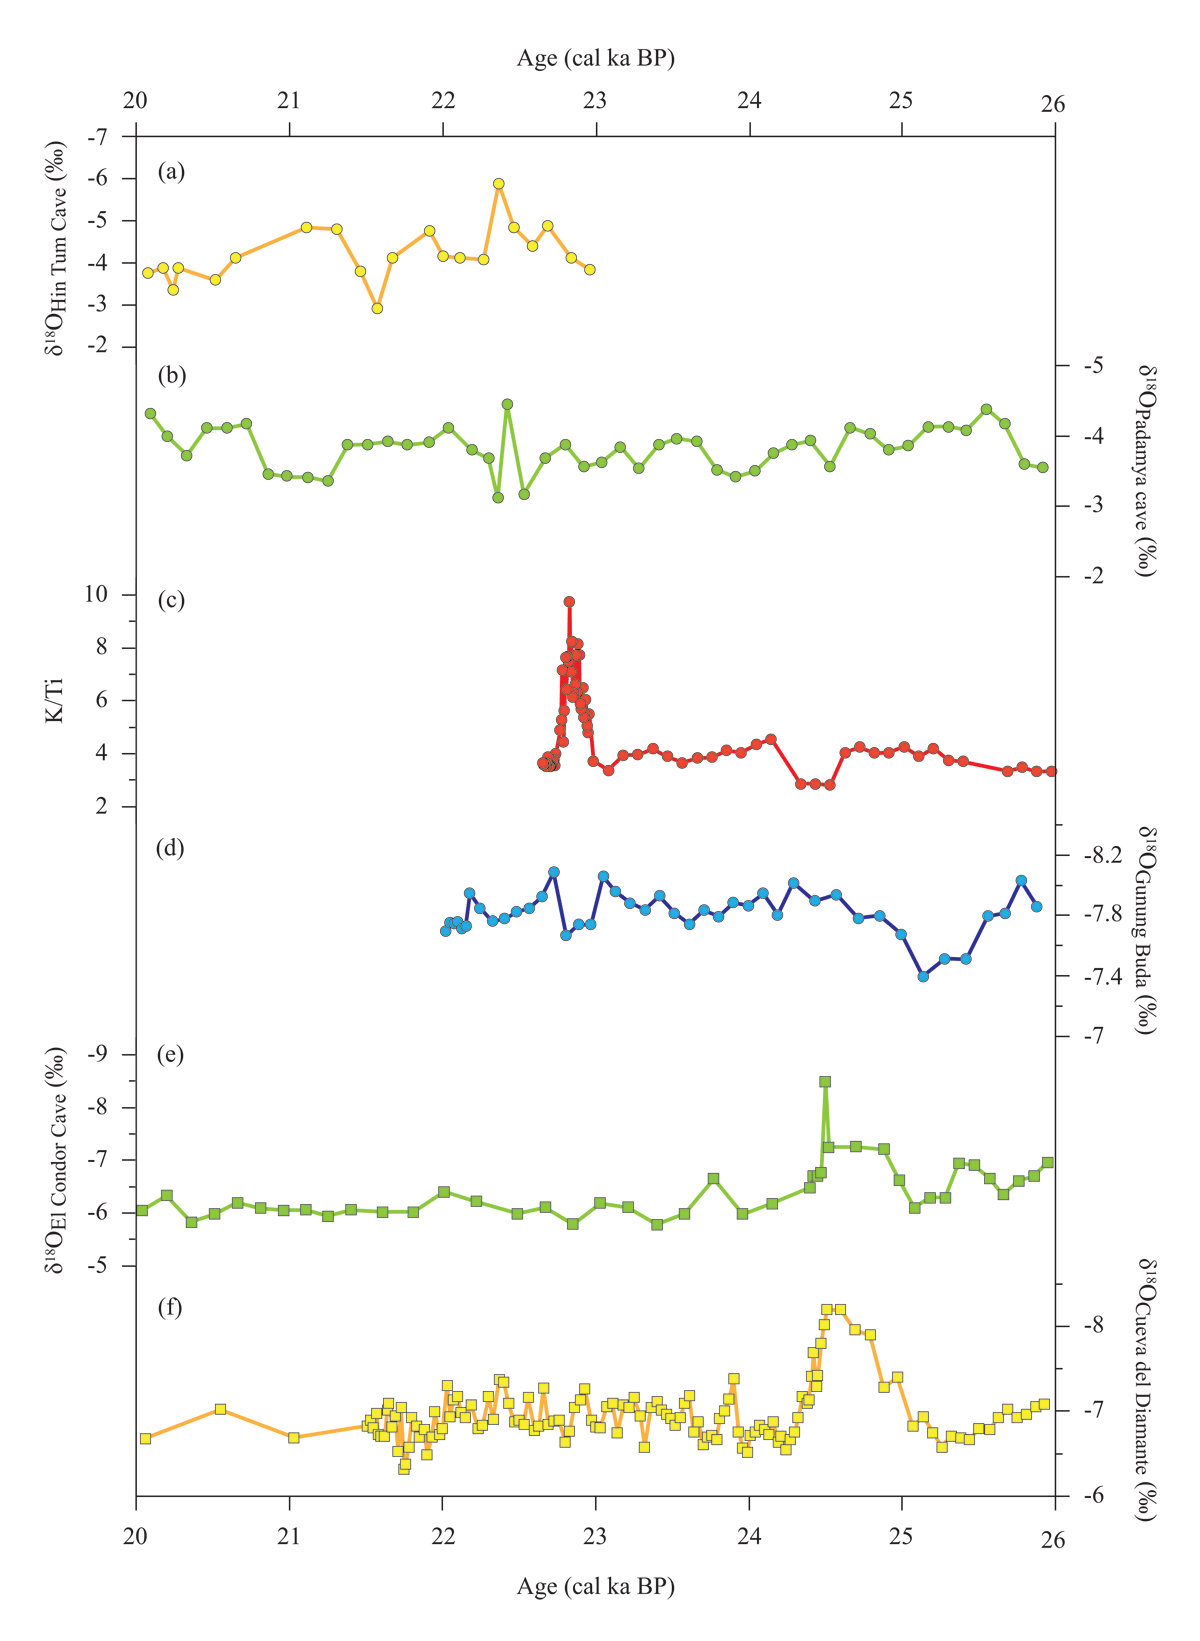
Figure 9
Comparison between the K/Ti ratios (c, red circles) and the δ18O values obtained from Hin Tum Cave (a, yellow circles), Padamya Cave (b, green circles), and Gunung Buda National Park (d, blue circles) in the western Pacific Ocean, and El Condor (e, green squares) and Cueva del Diamante Caves (f, yellow squares) in the eastern Pacific Ocean. Locations of the site in the east Pacific Ocean are shown in Figure 10 and Table 3. El Condor Cave is located 5.93°S and 77.3°W, while Cueva del Diamante is located at 5.73°S and 77.5°W.
Table 3
Palaeo-records and -proxies included in the compilation. The age assignments are determined using published 14C and U/Th dates. The number of dates within the time interval of 26–20 cal ka BP for each sequence is indicated in parentheses. See Figure 9 for the location of the sites.
| SITE NO. | SITE NAME | LAT (°) | LONG (°) | ELEVATION (M A.S.L.) | ARCHIVE | PROXY | AGE ASSIGNMENT | REFERENCES |
|---|---|---|---|---|---|---|---|---|
| 1 | GeoB10053-7 | –8.68 | 112.87 | –1375 | Marine | Ti/Ca | 14C (2) | Mohtadi et al. (2011); Ruan et al. (2019); Ruan et al. (2020) |
| 2 | Situ Bayongbong swamp | –7.18 | 107.28 | 1300 | Terrestrial | Pollen | 14C (1) | Stuijts et al. (1988) |
| 3 | Bandung basin | –7 | 108 | 665 | Terrestrial | Pollen | 14C (1) | van der Kaars & Dam (1995) |
| 4 | BAR94-42 | –6.75 | 102.42 | –2542 | Marine | Pollen | 14C (2) | van der Kaars et al. (2010) |
| 5 | MD98-2152 | –6.33 | 103.88 | –1796 | Marine | δ13Cwax | 14C (2) | Windler et al. (2019) |
| 6 | di Atas lake | –1.07 | 100.77 | 1535 | Terrestrial | Pollen | 14C (2) | Newsome & Flenley (1988) |
| 7 | SO189-39KL | –0.78 | 99.99 | –517 | Marine | δ18Osw | 14C (11) | Mohtadi et al. (2014) |
| 8 | Sentarum lake | 0.73 | 112.1 | 35–50 | Terrestrial | Pollen | 14C (1) | Anshari et al. (2001) |
| 9 | SO189-144KL | 1.15 | 98.05 | –481 | Marine | δD and δ13Cwax, and δ18Osw | 14C (6) | Niedermeyer et al. (2014); Mohtadi et al. (2014) |
| 10 | Pee Bullok swamp | 2.28 | 98.98 | 1400 | Terrestrial | Pollen | 14C (4) | Maloney & McCormac (1996) |
| 11 | Pea Sim-sim swamp | 2.29 | 98.89 | 1450 | Terrestrial | Pollen | 14C (4) | Maloney (1980) |
| 12 | BJ8-03-91GGC | 2.87 | 118.38 | –2326 | Marine | δ13Cwax | 14C (1) | Dubois et al. (2014) |
| 13 | Saleh Cave | 3.03 | 115.98 | 48 | Terrestrial | δ13Cwax | 14C (3) | Wurster et al. (2019) |
| 14 | Tasek Bera basin | 3.06 | 102.64 | 20–30 | Terrestrial | Hardwood remain | 14C (1) | Wüst & Bustin (2004) |
| 15 | Batu Cave | 3.21 | 101.7 | Terrestrial | δ13Cwax | 14C (1) | Wurster et al. (2010) | |
| 16 | Liang Mbelen Cave | 3.46 | 98.15 | Terrestrial | δ13Cwax | 14C (3) | McCarthy et al. (2022) | |
| 17 | SO189-119KL | 3.52 | 96.32 | –808 | Marine | δ18Osw | 14C (2) | Mohtadi et al. (2014) |
| 18 | Niah Cave | 3.82 | 113.77 | N/A | Terrestrial | δ13Cwax | 14C (1) | Wurster et al. (2010) |
| 19 | Cave in Gunung Buda National Park | 4.00 | 114.00 | ~1000 | Terrestrial | δ18O | U/Th (9) | Partin et al. (2007) |
| 20 | SO18302 | 4.15 | 108.57 | 83 | Marine | Pollen | 14C (1) | Wang et al. (2009) |
| 21 | SO18300 | 4.35 | 108.65 | 91 | Marine | Pollen | 14C (1) | Wang et al. (2009) |
| 22 | MD01-2393 | 10.50 | 110.05 | –1230 | Marine | Clay minerals | 14C (1) | Colin et al. (2010) |
| 23 | The lower central plain of Thailand | 13.53 | 100.37 | 1.8 | Terrestrial | K/Ti | 14C (3) | This study |
| 24 | Hin Tum Cave | 15.02 | 99.43 | N/A | Terrestrial | δ18O | U/Th (3) | Liu et al. (2020) |
| 25 | Padamya cave | 16.83 | 97.71 | N/A | Terrestrial | δ18O | U/Th (5) | Liu et al. (2020) |
| 26 | Hoa Huong Cave | 17.50 | 106.20 | 411 | Terrestrial | Mg/Ca and δ13C | U/Th (5) | Patterson et al. (2023) |
| 27 | Kwan Phayao | 19.17 | 99.87 | 380 | Terrestrial | Pollen | 14C (1) | Penny & Kealhofer (2005) |
| 28 | Tham Lod Rockshelter | 19.57 | 98.89 | 640 | Terrestrial | δ13C and δ18O | 14C (5) | Suraprasit et al. (2021); Marwick & Gargen (2011) |
| 29 | Lin Noe Cave | 21.23 | 96.43 | N/A | Terrestrial | δ18O | U/Th (10) | Liu et al. (2020) |
| 30 | Unnamed Cave | 23.50 | 104.00 | N/A | Terrestrial | δ18O | U/Th (10) | Liu et al. (2020) |
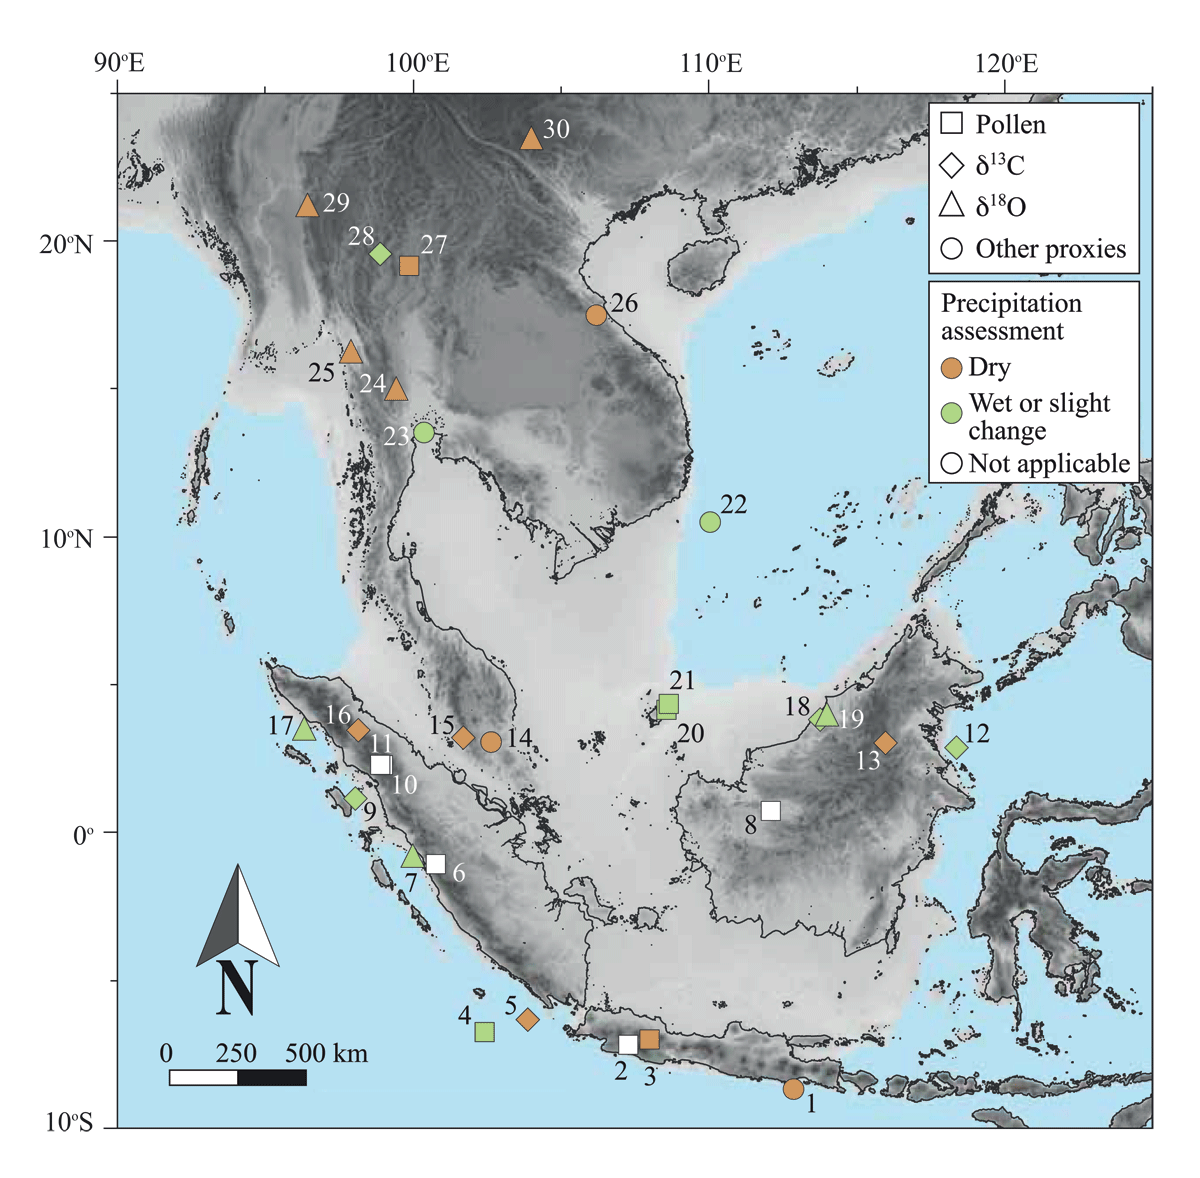
Figure 10
Compilation of the results obtained from the lower central plain of Thailand and the previous studies, indicate a comparable precipitation amount between the LGM and the present. See Table 3 for detail of each site.