

Figure 1
Regional to local contexts of the Masafi oasis. A: The south-east Arabian Peninsula and its main physiographic provinces (ESRI World Imagery). B: Geological map and reference sub-surface samples (UC – Upper Catchment samples) collected in the wadi Sidji catchment (SRTM 90 m, geology based on the British Geological Survey, 2006). C: Location of the geoarchaeological test pits dug in the oasis and presented in this paper (ESRI World Imagery).
Table 1
Degree of contribution of auxiliary components (serpentine and olivine) in the mineralogical assemblage.
| DEGREE OF CONTRIBUTION | % AUX. COMP. (<200 µM)a | % AUX. COMP. (200 µM- 2 MM)b |
|---|---|---|
| +++ | 20–25 | 15–30 |
| ++ | 10–15 | 5–15 |
| + | 5–10 | <5 |
[i] a: % of aux. comp. point counted in three areas of 4 mm² per micro-stratigraphic unit.
b: semi-quantification of aux.comp. as proportion of total area in the whole micro-stratigraphic unit.

Figure 2
A: Schematic sedimentary succession observed in the upper part of the superficial formations. B: Examples of fine sediments collected in the upstream catchments (see Figure 1B for location of the samples).

Figure 3
Result of the grain size analysis and mineralogy on the reference samples collected in the watershed and in the oasis.
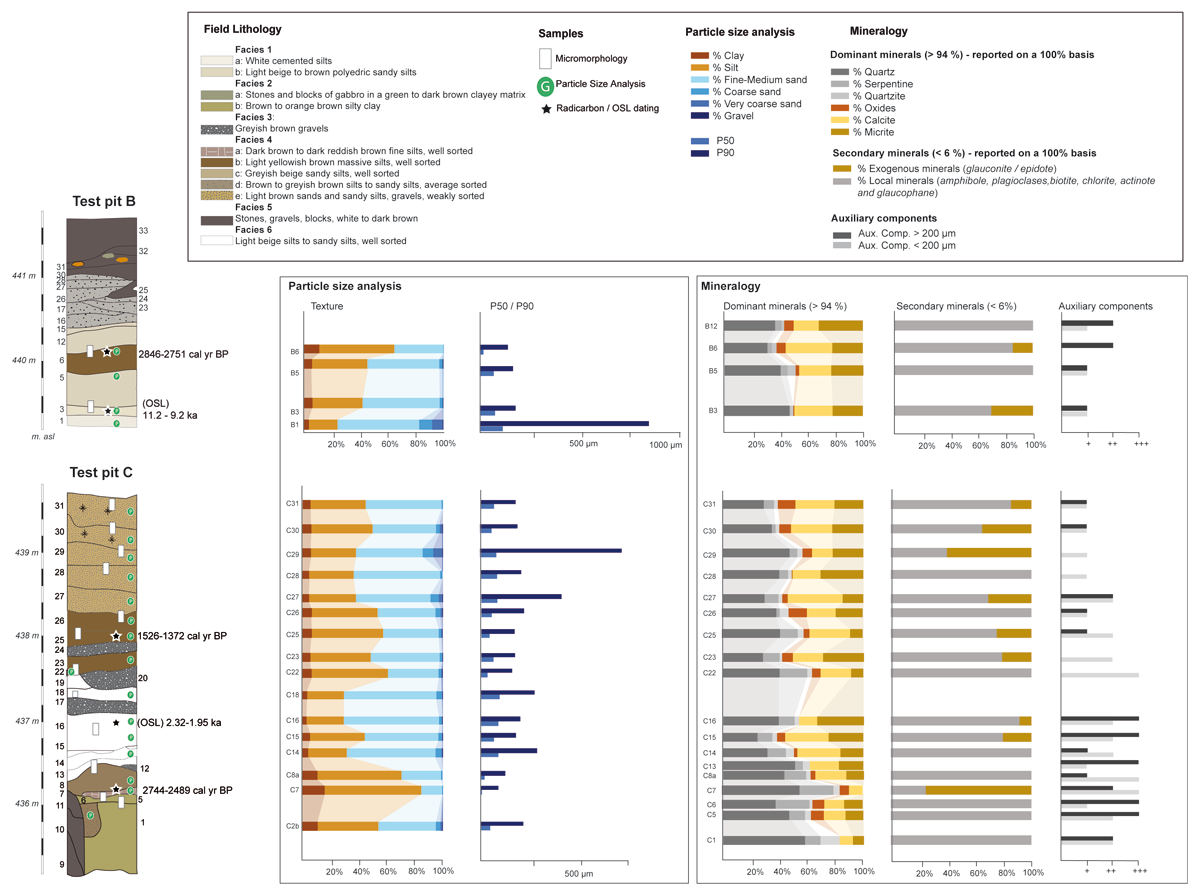
Figure 4
Field lithostratigraphy Lithostratigraphy and chronology (Purdue et al. 2019) and results of the grain size analysis and mineralogy in TP B and C.
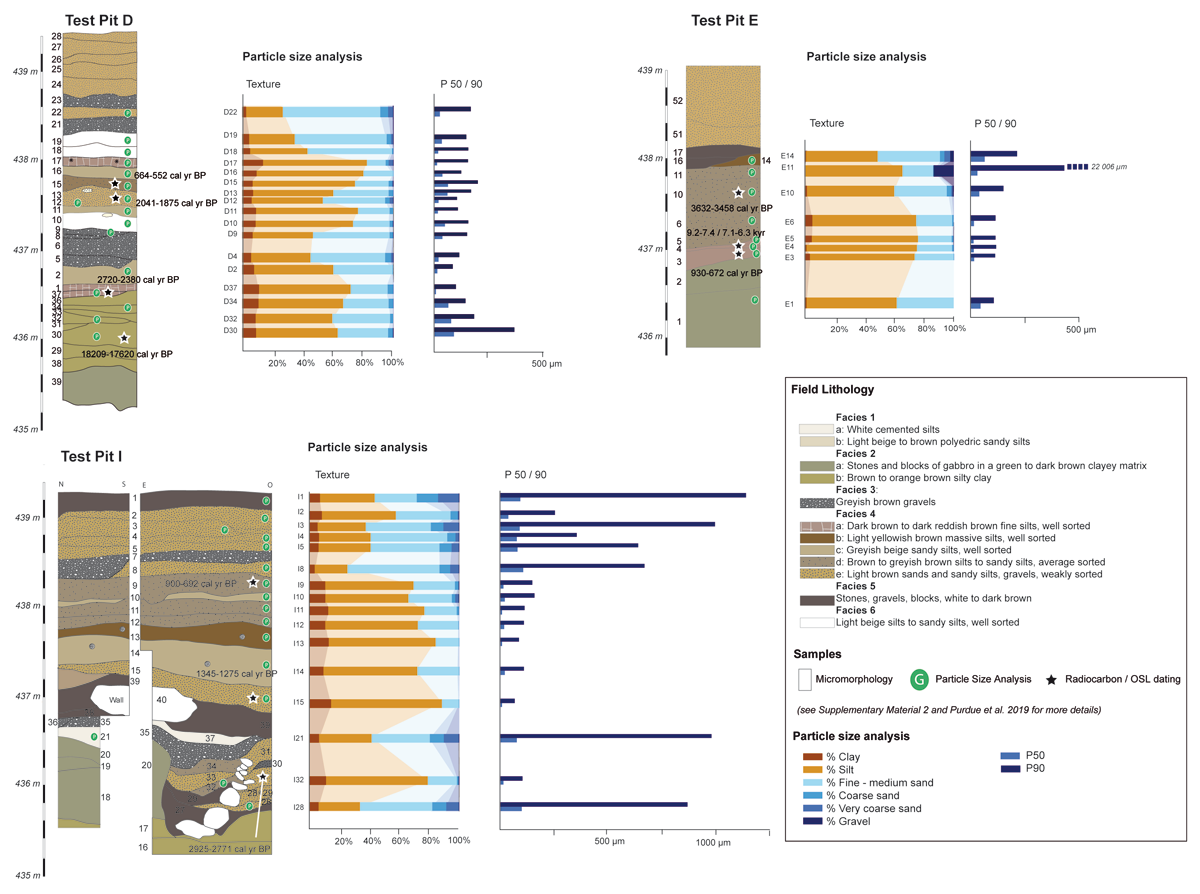
Figure 5
Field lithostratigraphy and chronology (Purdue et al. 2019) and results of the grain size analysis in TP D, E and I.
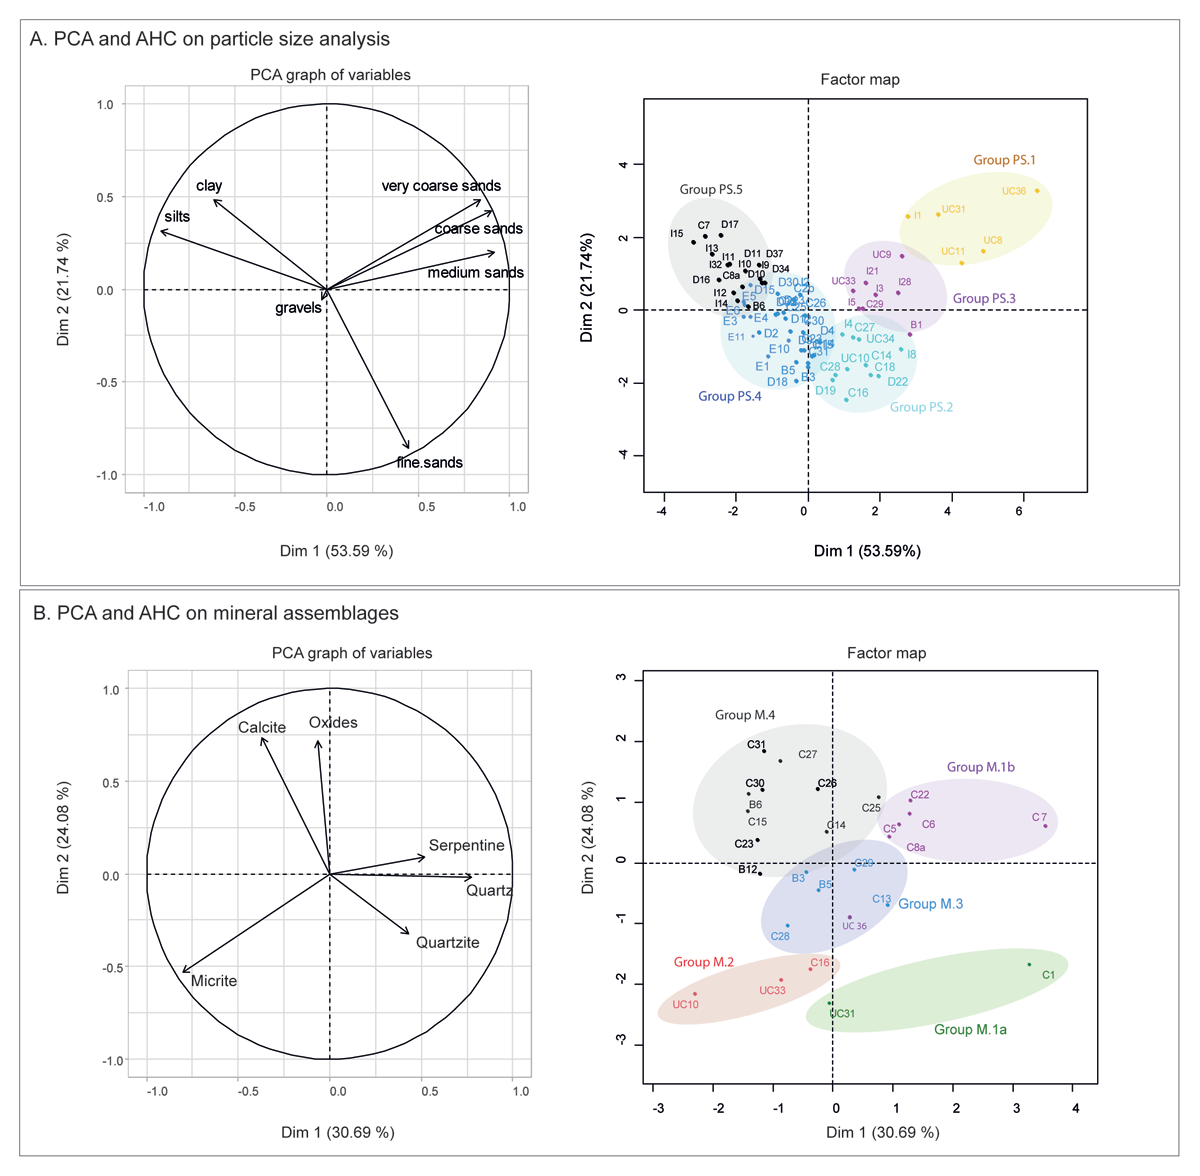
Figure 6
Principal component analysis to characterize sediment environment and origin. A: PCA conducted on the texture (clay to grave) of 69 samples, presentation of the first and second dimensions. B: PCA conducted on the dominant minerals (>94%) of the mineral assemblage of 27 samples, presentation of the first and second dimensions.
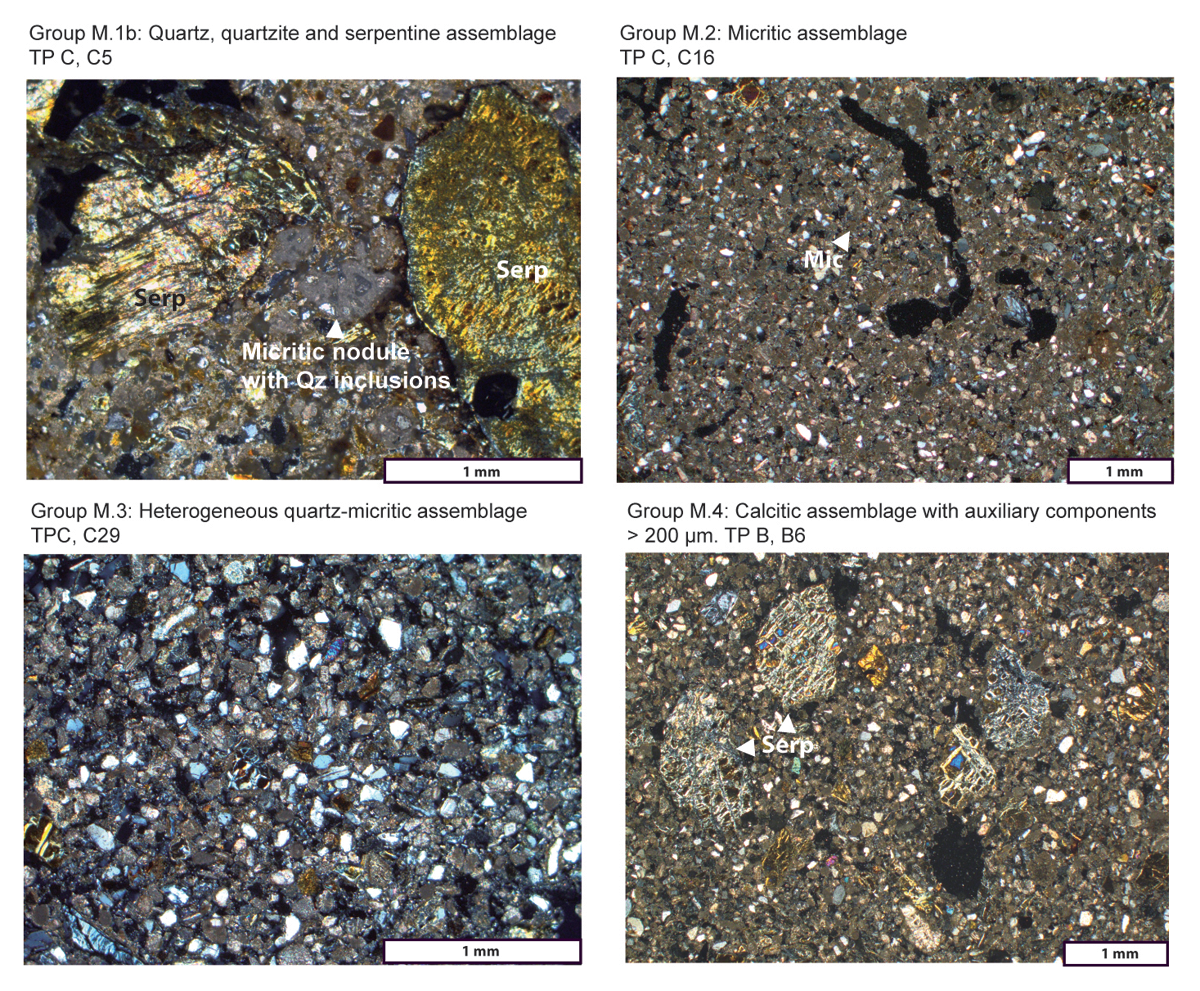
Figure 7
Microphotographic in Crossed Polarized Light of the various mineralogical groups identified in the reference and archaeological deposits in the oasis (Serp.: Serpentine; Mic: Micrite; Qz: Quartz, Qtzite: Quartzite).
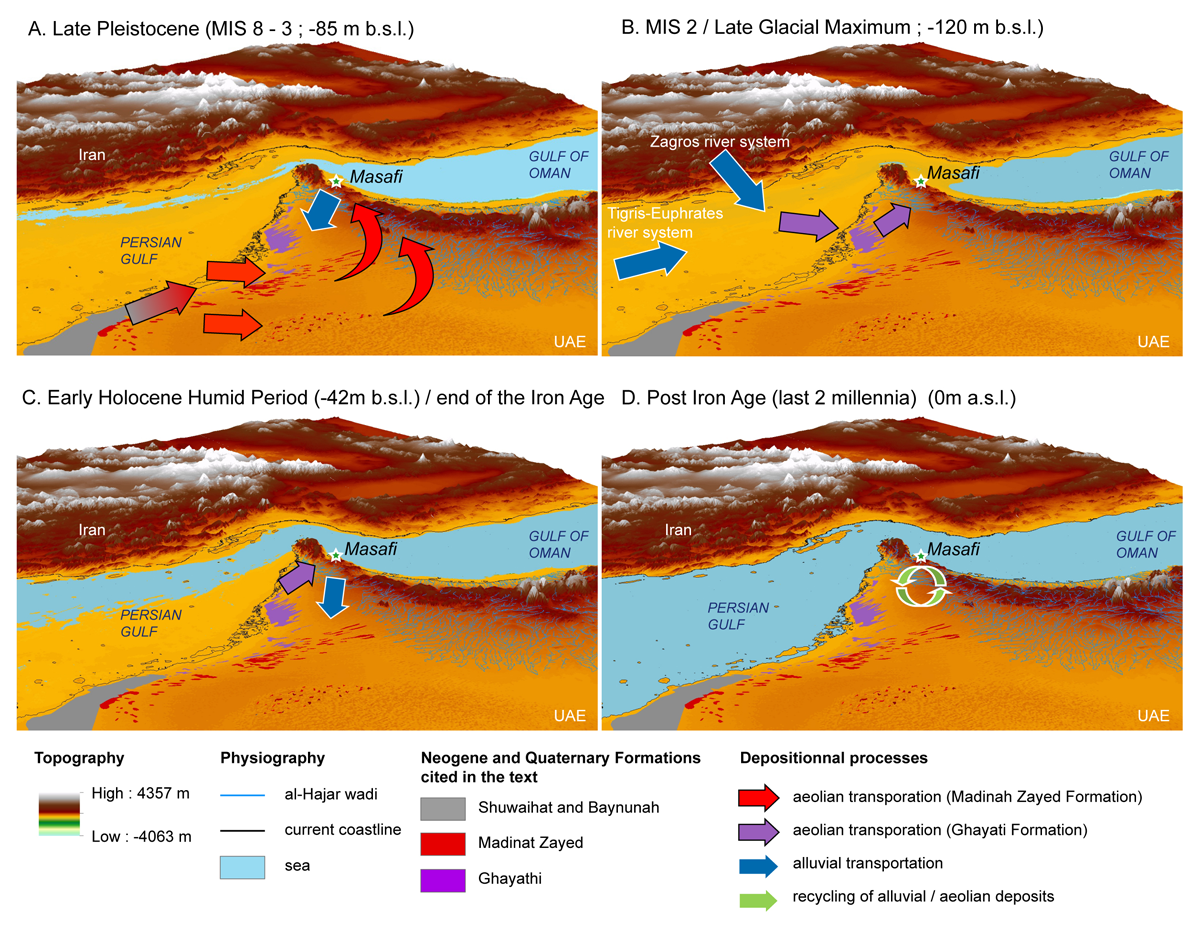
Figure 8
Synthesis of depositional processes and model of source-to-sink dynamics in southeast Arabia. A: see Waelbroek et al. 2002 for sea-level – average depth. B: see Lambeck, 1996 for sea level changes and Farrant et al. 2019 for the location of the Tigris sediment pathway. C: see Lambeck, 1996 for sea level changes.