
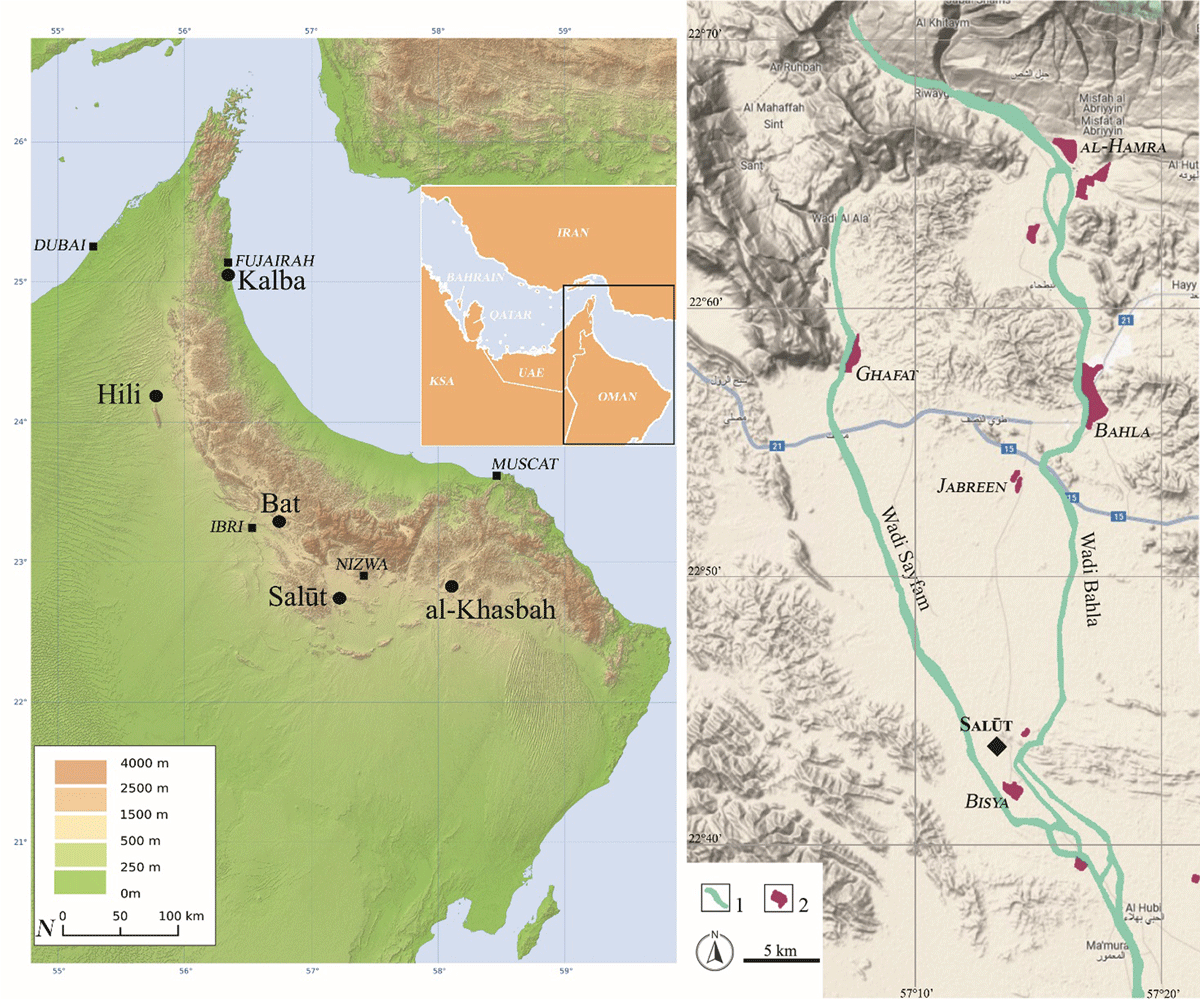
Figure 1
General and regional map. A) The location of Salūt and other main EBA sites in southeast Arabia (modified from Physical location map of Oman by Carport/CC BY-SA 3.0); B) the position of Salūt near the confluence of Wadi Bahla and Wadi Sayfham. 1) Main wadi channel; 2) modern cultivated areas (base relief map: © Google Maps 2024; details adapted from Orchards & Orchards 2007: plate 3).
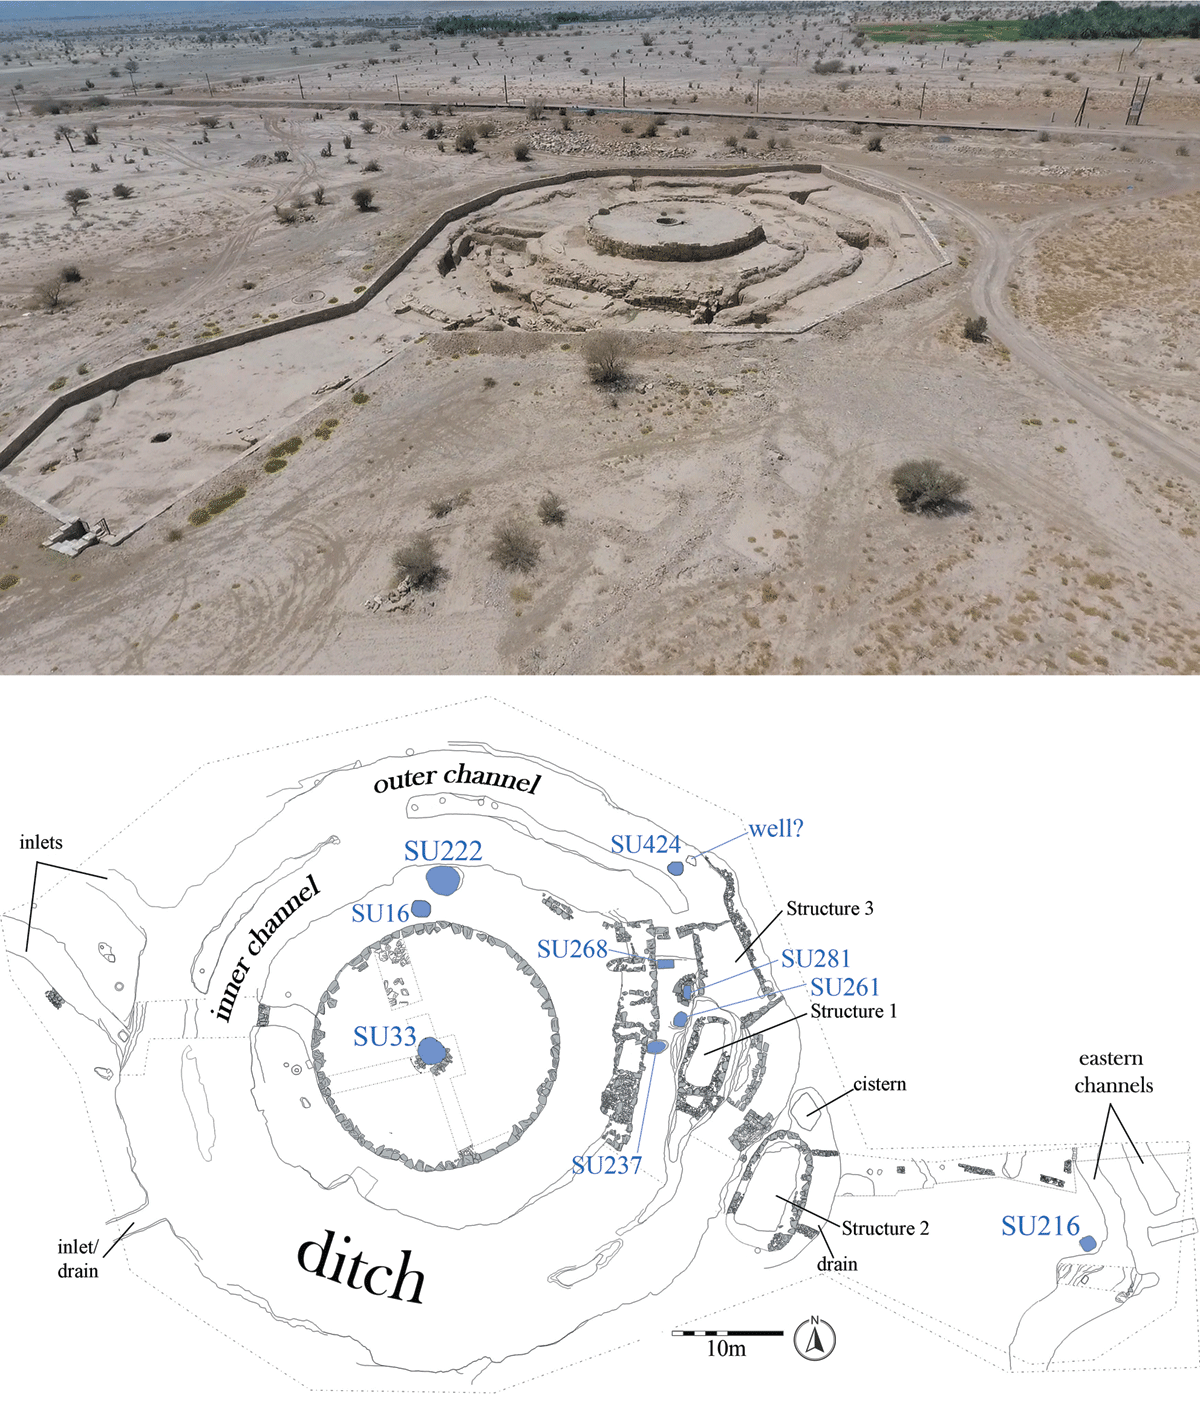
Figure 2
The EBA “tower” site of Salūt-ST1. Top: bird’s-eye view; bottom: plan with indication of the main hydraulic features discussed in the text (see Figure 5 for the plan location). SU = Stratigraphic Unit.
Table 1
Available radiocarbon dates for the sediments inside the main ditch at Salūt-ST1. Calibrated using OxCal v4.4.4 (Bronk Ramsey 2009) and the INTCAL20 atmospheric curve (Reimer et al. 2020). See Figure 8 for the relative position in relation to the general stratigraphy inside the ditch.
| LAB CODE | MATERIAL | UNIT/CONTEXT | 14C DATE (BP) | PRE-TREATMENT | MEASUREMENT TECHNIQUE | δ13C | pMC | 2σCALIBRATED DATE (BC) |
|---|---|---|---|---|---|---|---|---|
| 14Fi2250, 14Fi2255, 14Fi2258 | Charcoal from small dump | Unit 2/ SU 55 | 3830 ± 35 | ABA procedure | graphitisation/ combustion | 62.10 ± 0.25 | 2455 (6.3%) 2417 2410 (85%) 2196 2170 (4.2%) 2147 | |
| UGAMS 27659 | Charcoal from small fireplace | Unit 3 (base)/ SU 419 | 3890 ± 25 | –26.22 | 2464 (95.4%) 2294 |
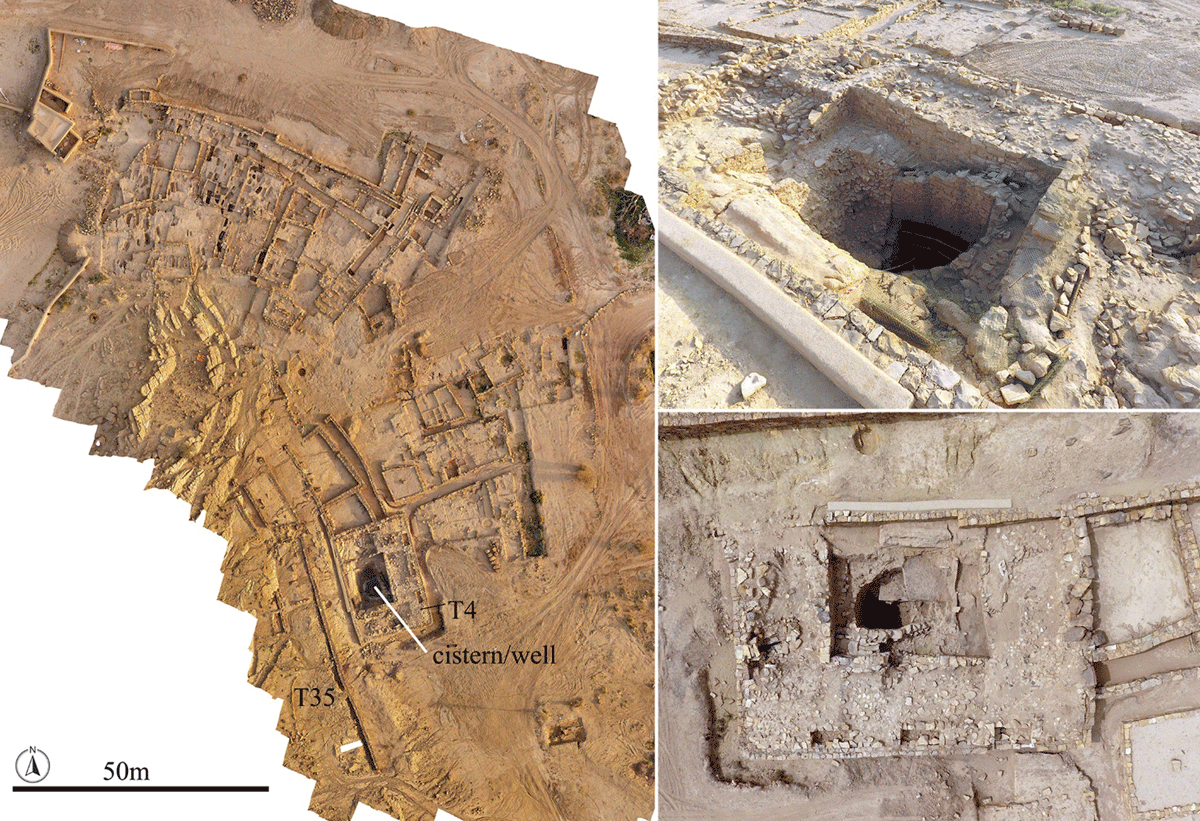
Figure 3
Qaryat Salūt. Left: orthorectified view of the eastern area of the site, with the location of the huge cistern/well; right: two views of the cistern/well.
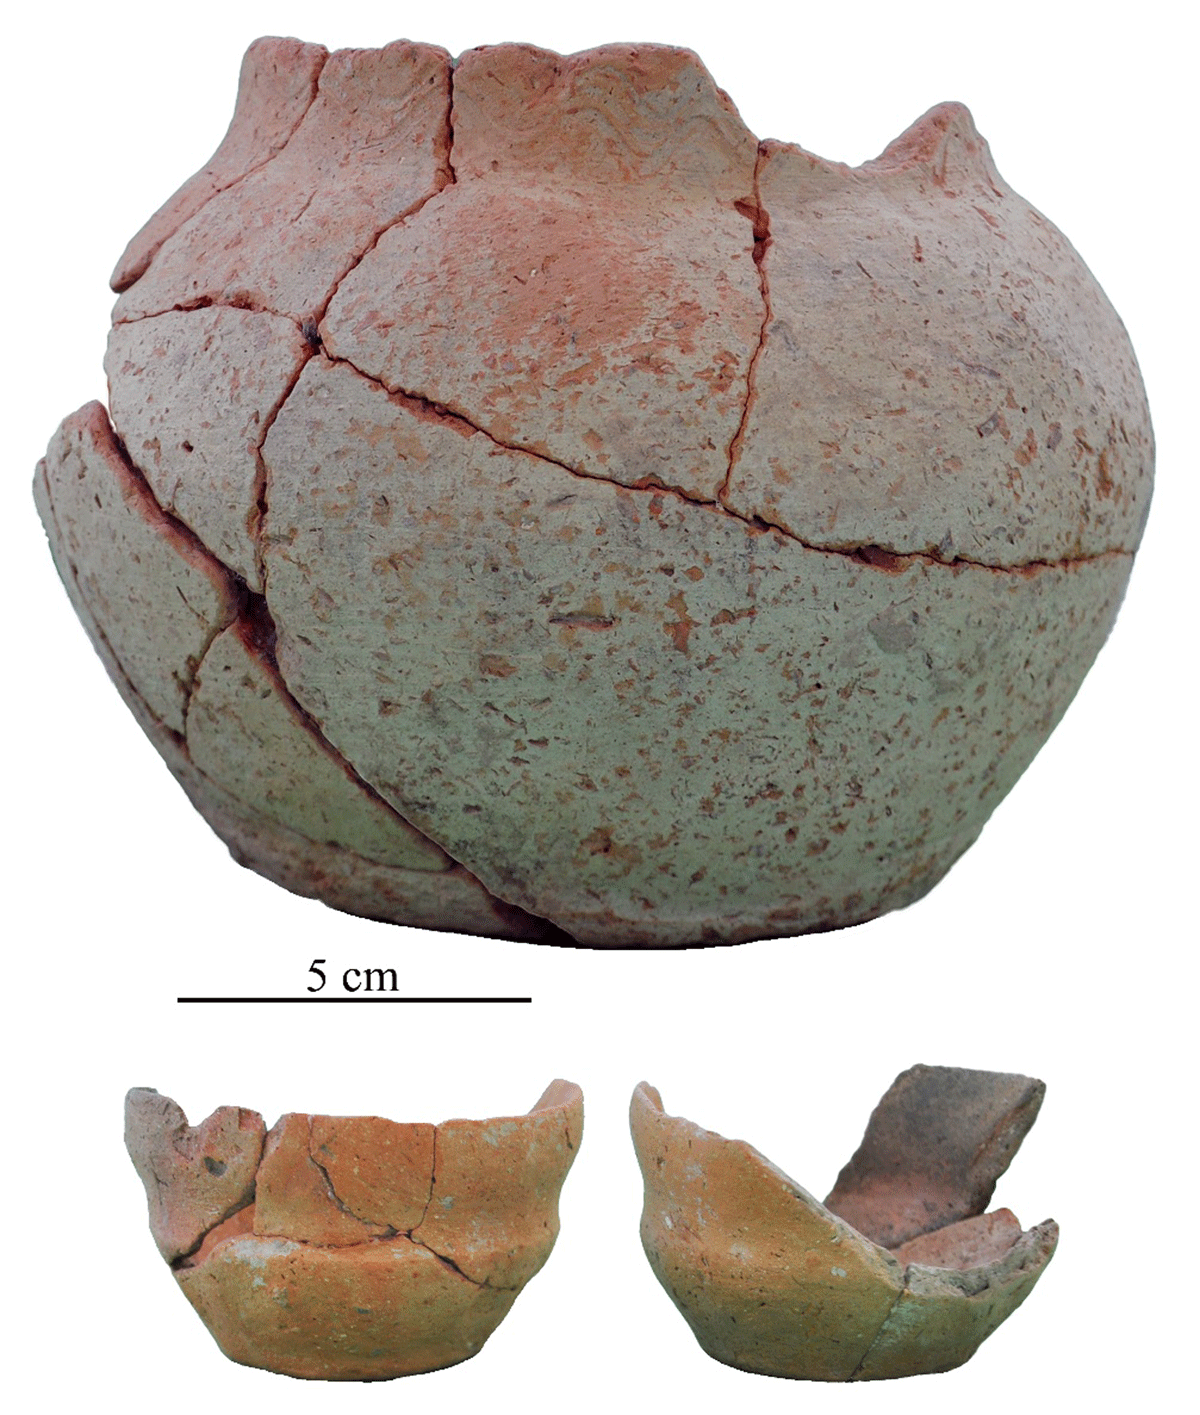
Figure 4
Iron Age pottery. Complete shapes discovered inside well SU216.
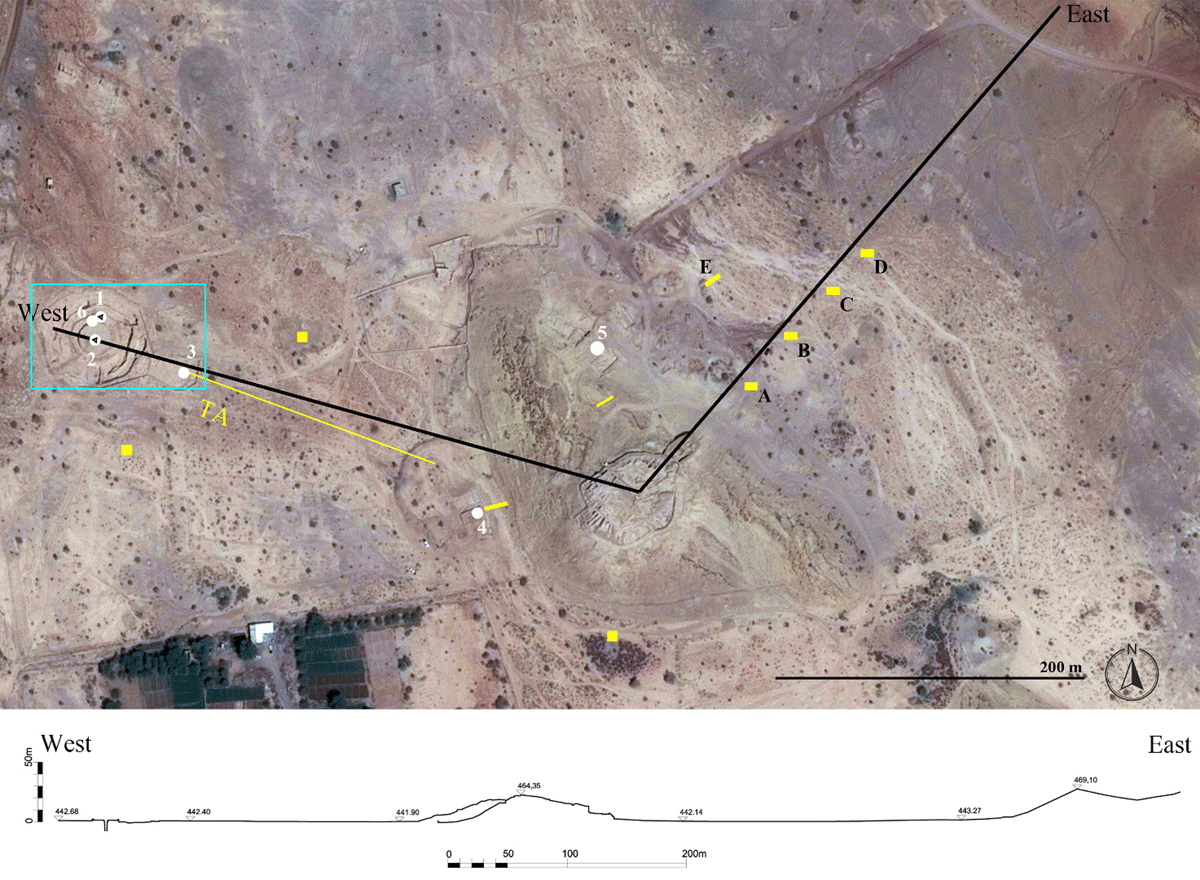
Figure 5
Satellite view (Maps data: Google © 2024 CNES/Airbus, acquired Oct. 2016) and general profile through the modern oasis (topographic survey by A. Massa). Top: location of the wells and cisterns discussed in the text (white numbers; EBA and possibly EBA wells with inner black triangle) and of the test pits excavated in the plain. 1) well SU222; 2) well SU33; 3) well SU216; 4) well W37; 5) well/cistern in Terrace 4; 6) well SU16; A-E) test pits illustrated in Figure 7. Yellow polygons indicate other test pits currently under study, with TA showing the alignment of 12 test pits. The light blue rectangle indicates the extension of the plan in Figure 2 bottom.

Figure 6
Illustrative stratigraphic logs of the substratum surveyed in the main ditch at Salūt-ST1, in well SU261, and in one of the wells at the bottom of the ditch (modified from Degli Esposti, Cremaschi & Costanzo, 2024: Figure 3). Keys: A) calcrete on gravel; B) loose gravel; C) mottled loose small gravel and sand/mottled sand and silt; D) calcrete on sand and silt; E) weakly cemented sand and silt; 1) soils in the plain; 2) impermeable layers (A+D); 3) poorly permeable layers E); 4) permeable layers (B+C). See Figure 1 for log location.
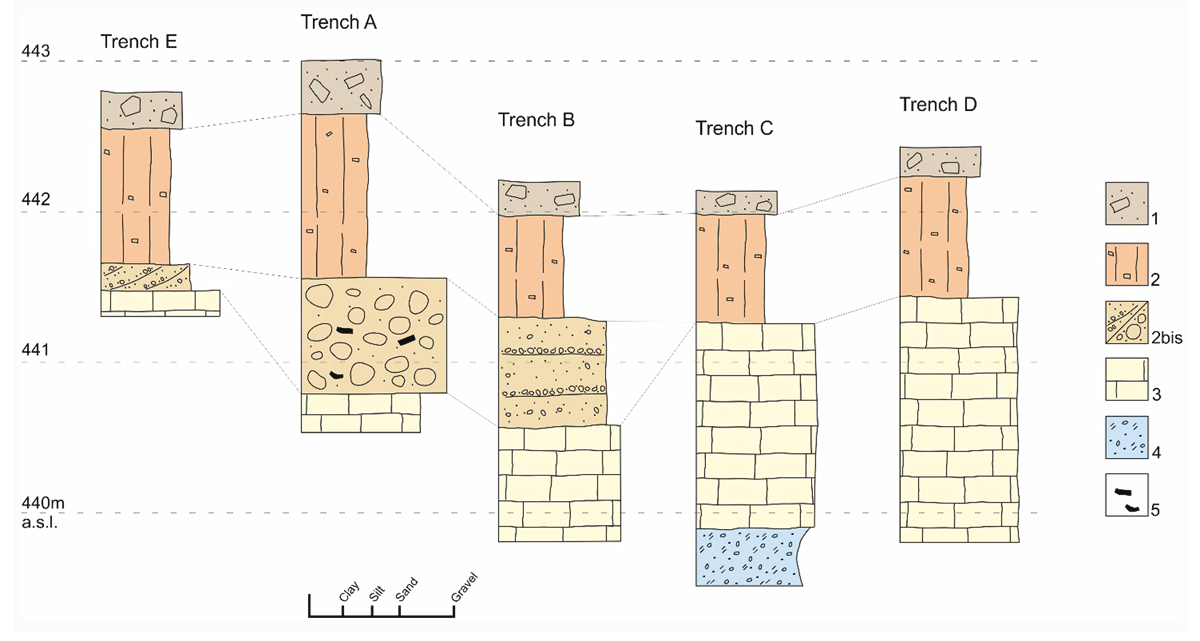
Figure 7
Stratigraphic logs from the test trenches in the plain to the east of Salūt-IA (for their location, see Figure 5). Keys: 1) loose sandy loam; 2) pale brown sandy, weakly developed soil; 2bis) fluvial coarse sand and gravel/anthropogenic stone accumulation; 3) calcrete on sand and silt (= Unit D) 4) mottled loose small gravel and sand (= Unit C?); 5) pottery.

Figure 8
An example of a section cut through the main ditch at Salūt-ST1 (modified from Degli Esposti, Cremaschi & Costanzo, 2024: Figure 5). Unit 2: loamy sand, massive; Unit 3: laminated sand and silt; Unit 4: olive brown laminated clay. The relative position of the radiocarbon dated contexts (see Table 1) is indicated with asterisks: * SU 419; ** SU 55. For substratum keys see Figure 6.
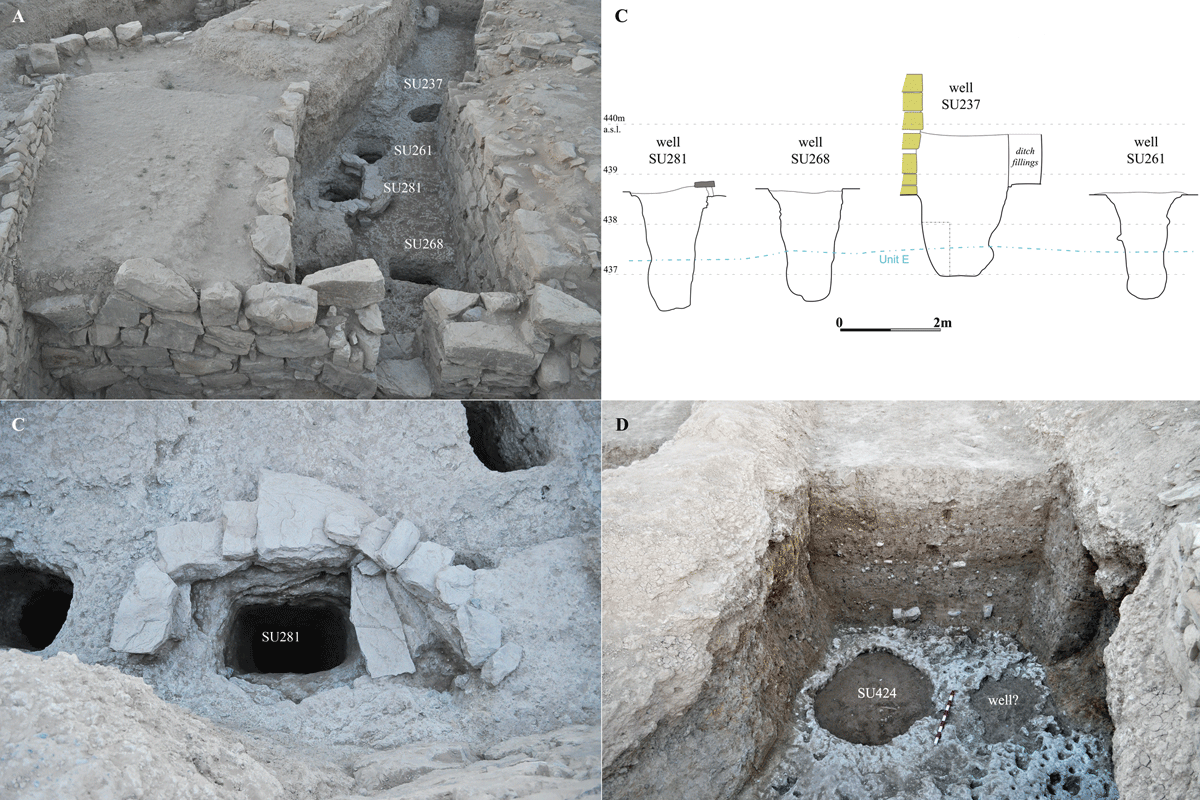
Figure 9
Views and profiles of the wells discovered at the bottom of the ditch at Salūt-ST1.
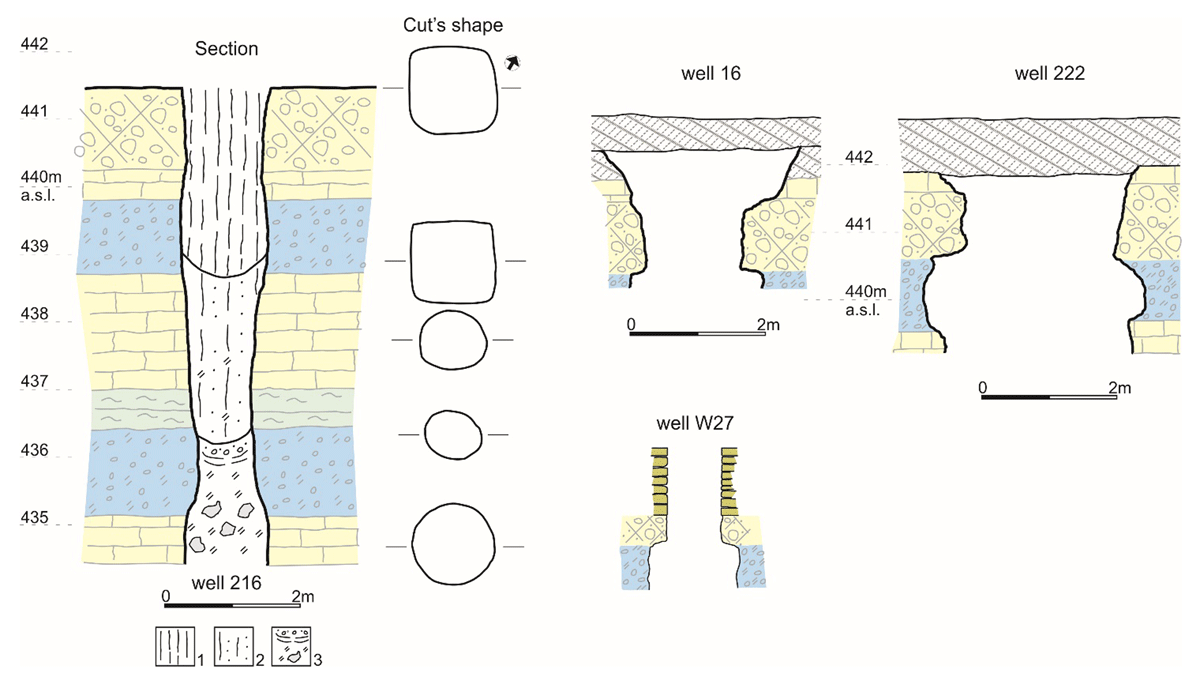
Figure 10
Section of the most relevant wells discussed in the text, excluding those at the bottom of the ditch Salūt-ST1. Keys: 1) upper infill, unstratified silty loam and calcrete fragments; 2) middle infill, massive sandy silt; 3) lower infill, mottled loamy silt and laminated small gravel at the top. For substratum keys see Figure 6.
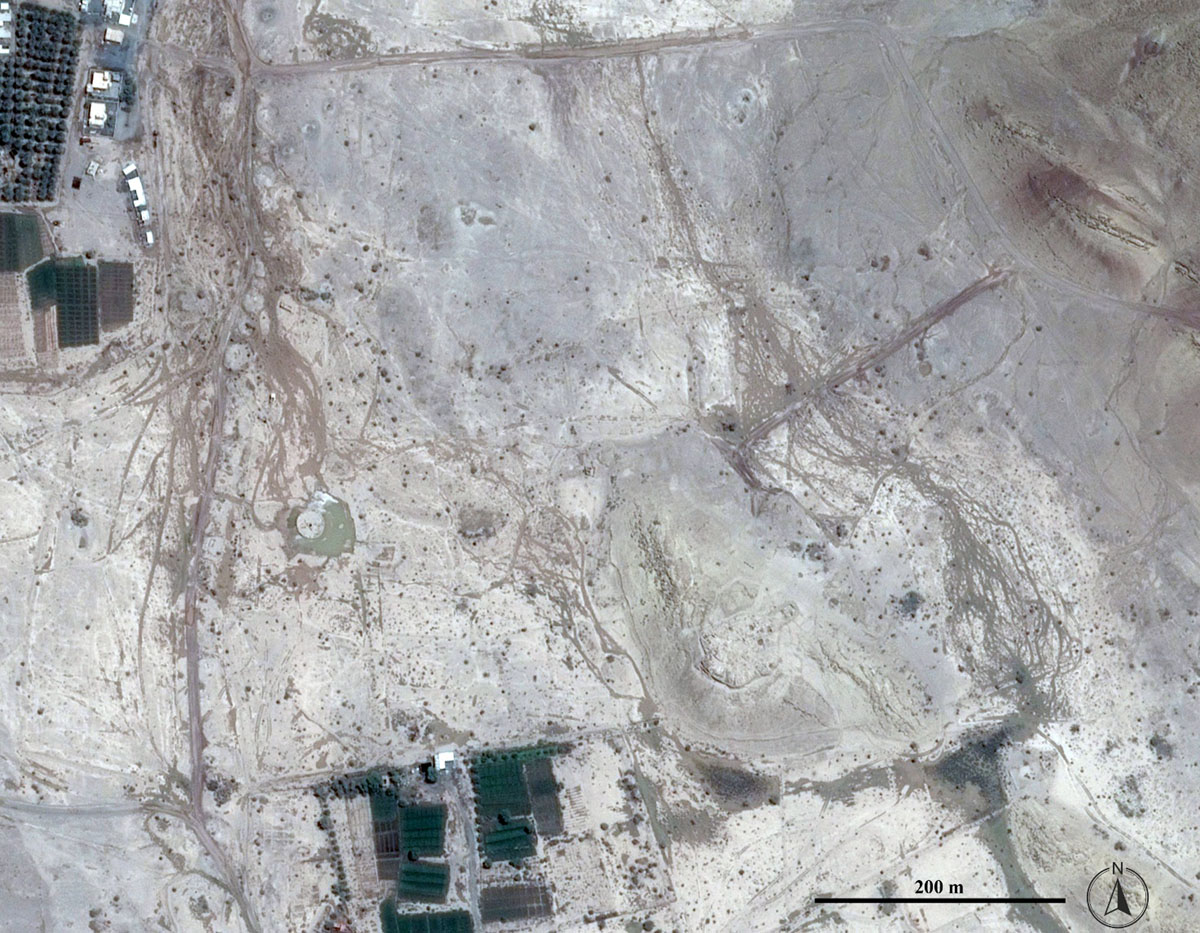
Figure 11
The effects of flash-floods at Salūt-ST1 and in the plain flanking Salūt-IA are evident in two main streams of gullies, plus a minor one just west of the hill hosting Salūt-IA – (Maps data: Google © 2024 CNES/Airbus, acquired Aug. 2013).
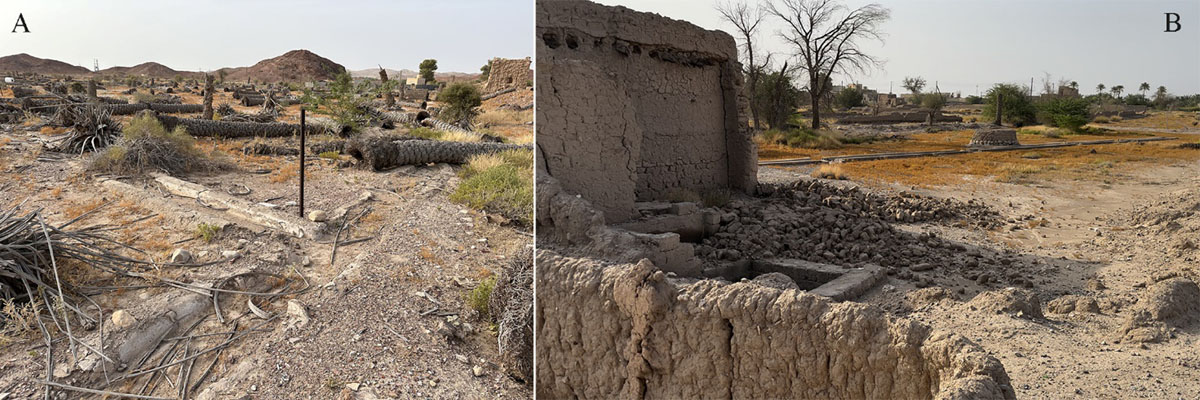
Figure 12
Abandoned cultivated fields in the old oasis of Bisya (B) and at a nearby location on along the edges of the alluvial plain (A). Photos S. Bizzarri.