
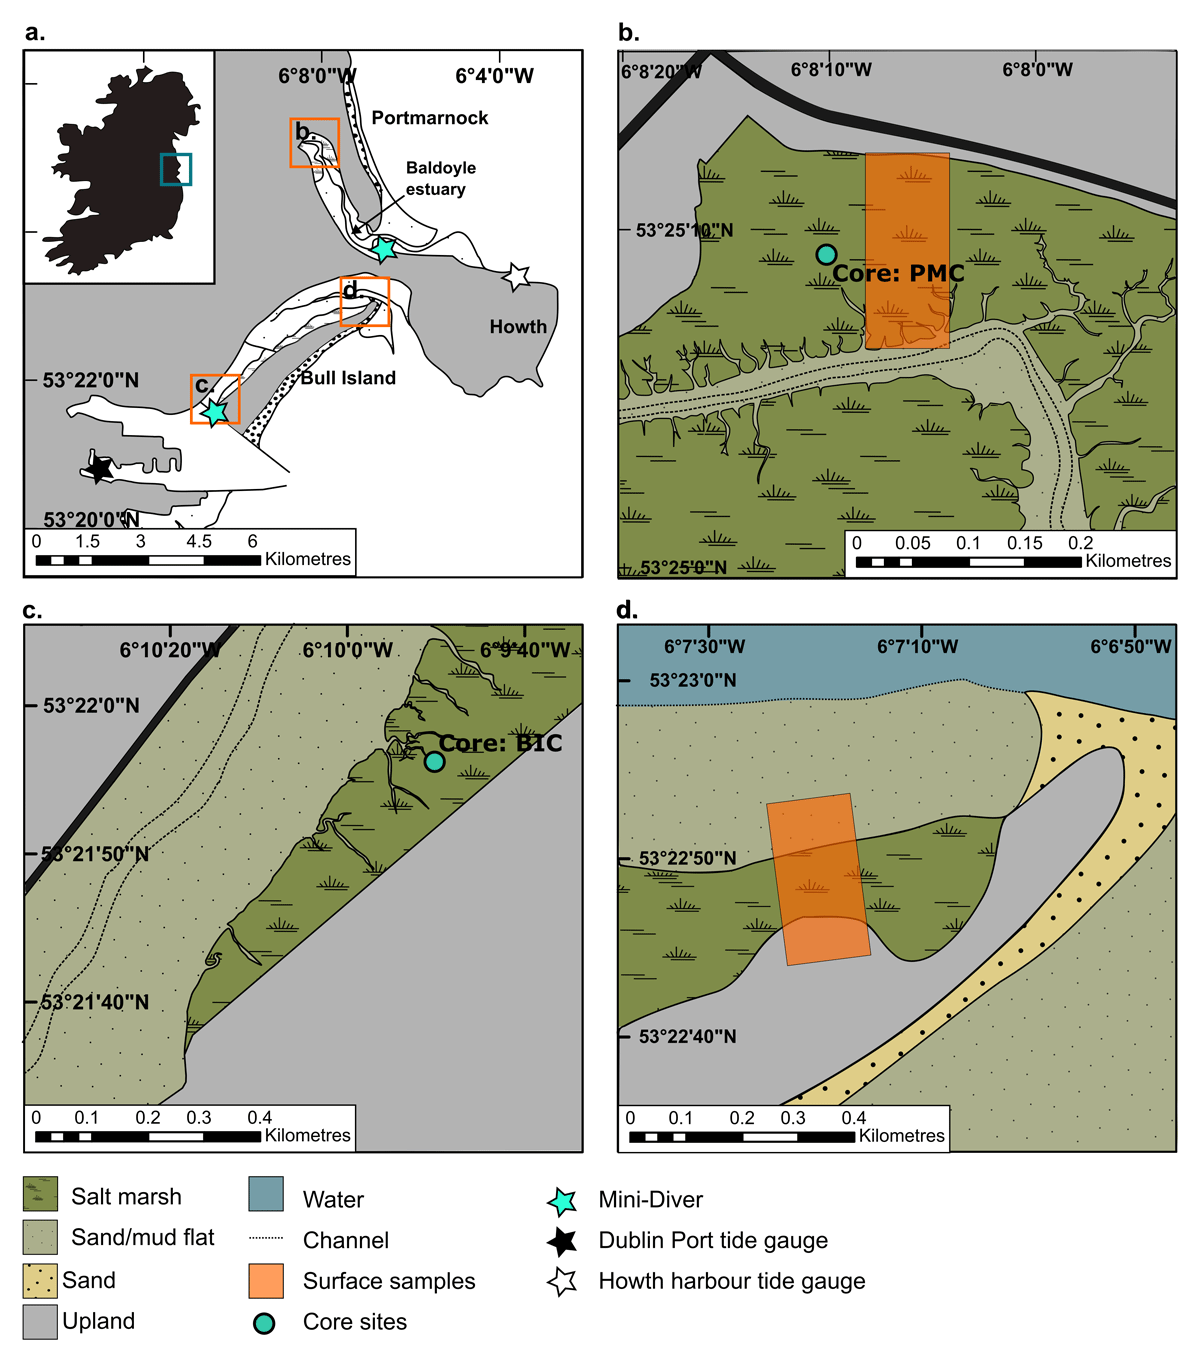
Figure 1
(a) Map of County Dublin indicating the location of our study sites; Portmarnock (b), Bull Island West (c) and Bull Island East (d). Core sites (green circle), locations of Mini-Divers (green star), Dublin Port tide gauge (black star), Howth Harbour tide gauge (white star) and surface sampling locations (orange box) are indicated.
Table 1
Tidal datums and standardisation of elevation data across tide gauge sites.
| BULL ISLAND MINI-DIVER (02/07/08 TO 17/09/08) | LEVEL RELATIVE TO ODM (M) |
|---|---|
| Mean High Water | 1.48 |
| Mean tide level | 0.01 |
| Highest occurrence of foraminifera | 2.01 |
| SUTTON MINI-DIVER (07/03/2009 TO 24/06/2009) | LEVEL RELATIVE TO ODM (m) |
| Mean High Water | 1.48 |
| Mean tide level | 0.01 |
| Highest occurrence of foraminifera | 2.05 |
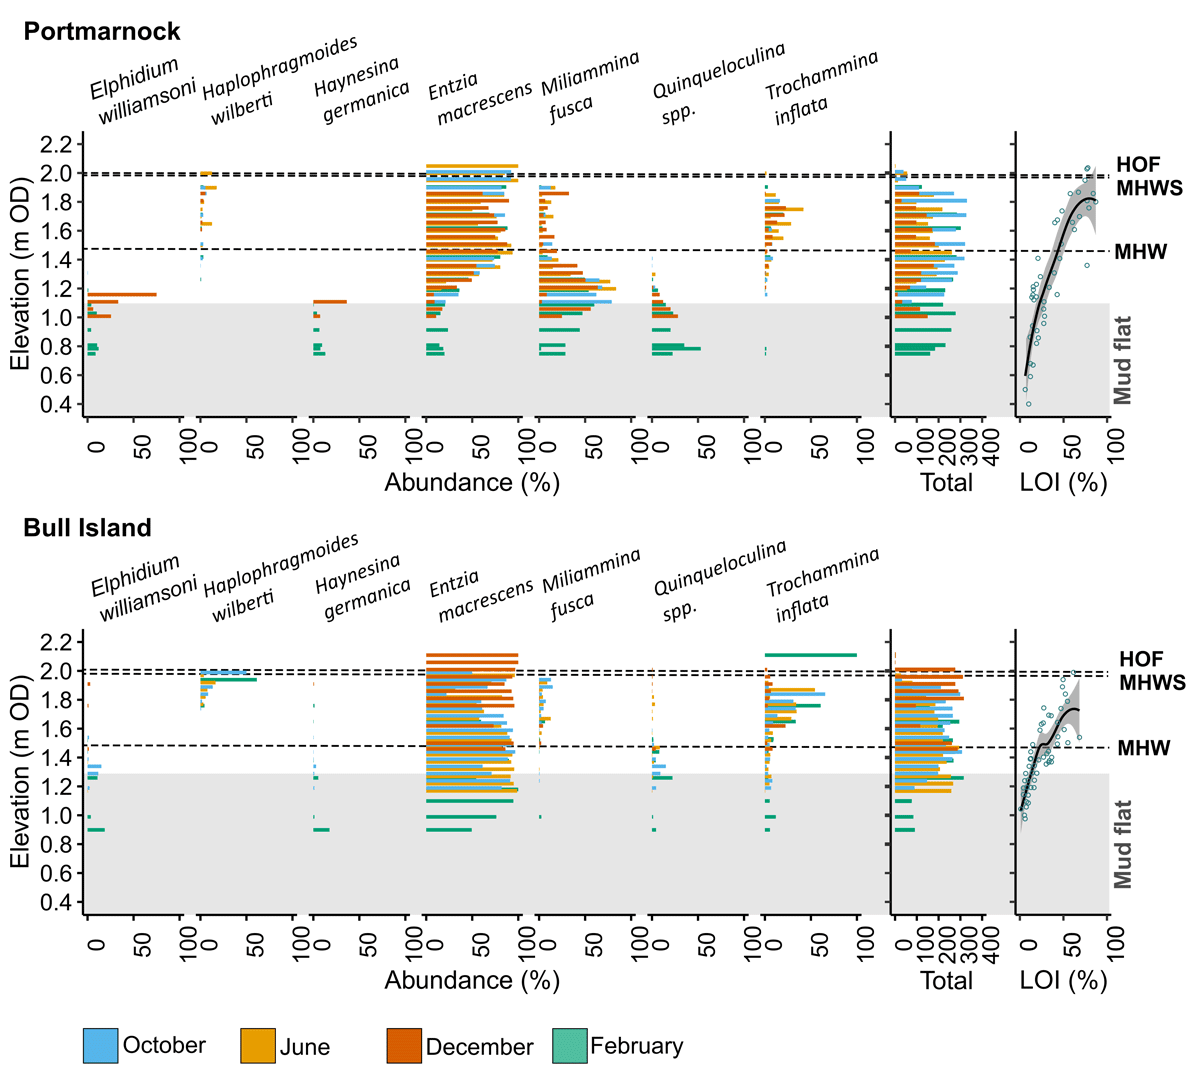
Figure 2
Raw foraminifera data (dominant species expressed as relative abundance and colour coded based on month of collection), total number of foraminifera identified and total organic matter (loss on ignition; LOI) against elevation (m OD) for Portmarnock and Bull Island. HOF = Highest occurrence of foraminifera, MHWS: Mean high water springs, MHW = Mean high water.
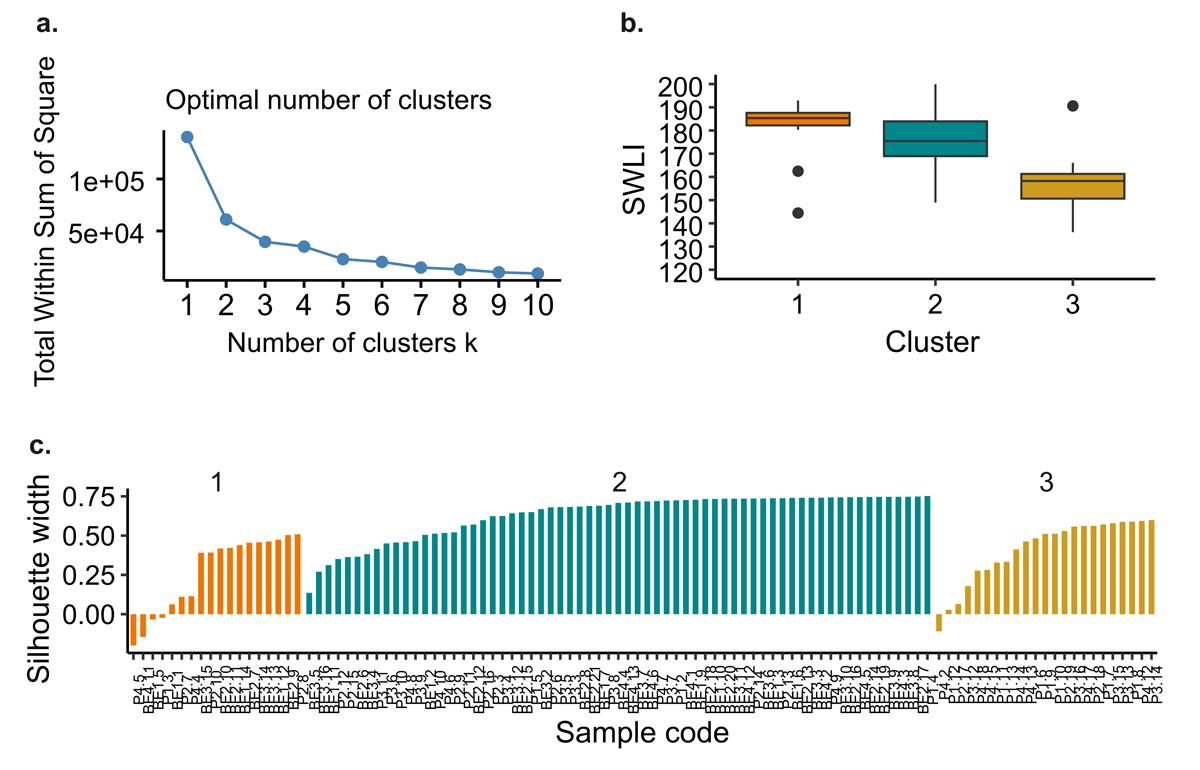
Figure 3
Partitioning around medoids (PAM) analysis on screened and combined surface foraminifera data set. This includes samples from Bull Island and Portmarnock. (a) Optimal number of clusters for our dataset, guided by ‘NbClust’ (Charrad et al., 2014). (b) Box and whisker diagram showing standardised elevation (SWLI) range of clusters. (c) Silhouette plot showing silhouette widths for samples from Bull Island and Portmarnock.
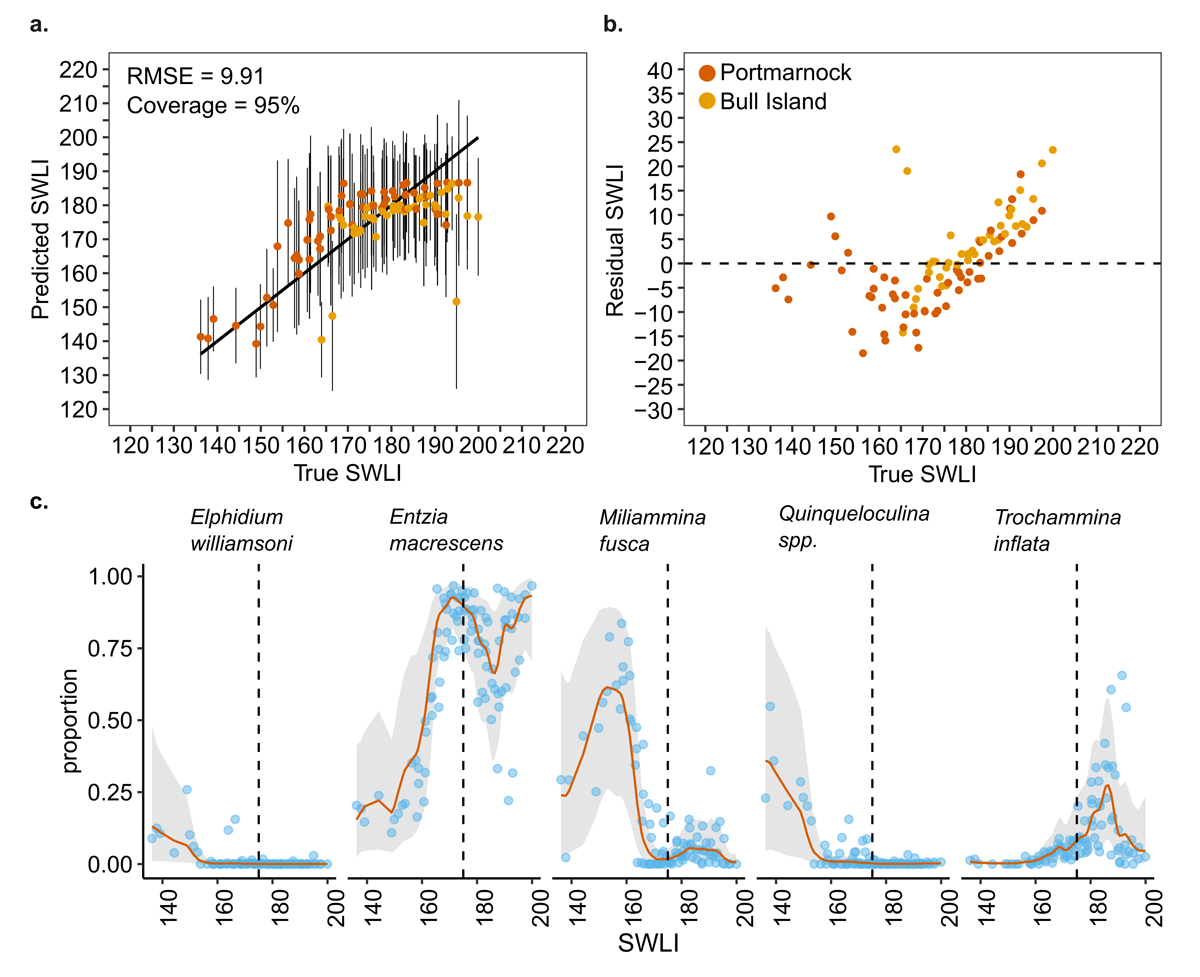
Figure 4
(a) Bayesian transfer function (BTF) 10-fold cross validation. Modern sample SWLI plotted against predicted SWLI predicted by the BTF. 95% of the time the True SWLI falls within the model 95% credible intervals. Prediction of error is 9.91, as measured by the Root Mean Squared Error (RMSE). (b) Observed-predicted residuals. (c) Species response curves for our screened, combined dataset (red line), with 95% confidence intervals (grey area). This incorporates surface samples from Bull Island and Portmarnock (blue circles). The proportion of each species is plotted against standardised elevation (SWLI). MHW is shown as a vertical dashed line.
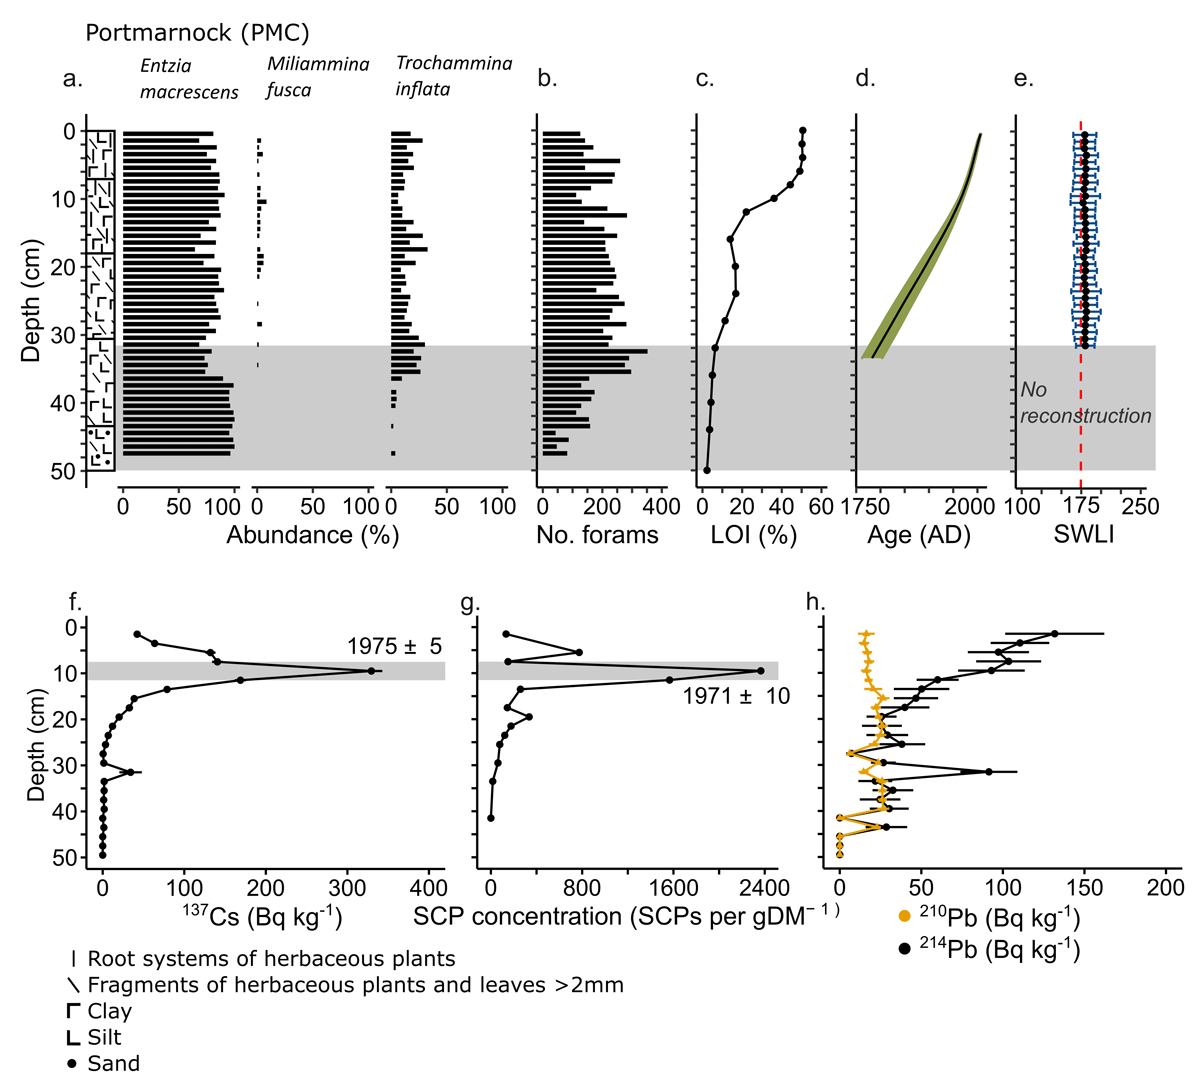
Figure 5
(a) Core log and relative abundance of foraminifera, (b) number of foraminifera counted, (c) percentage total organic matter (LOI), (d) age depth model obtained from R package ‘rplum’ with 95% confidence interval and (e) palaeomarsh elevation predicted by the Bayesian transfer function, expressed as standardised water level index (SWLI) with 95% confidence interval. The red dashed line indicates the core top SWLI. PMC is cropped (a–e) to only include saltmarsh sediments. (f) 137Cs, (g) Spheroidal carbonaceous particle (SCP) concentration and (h) 210Pb and 214Pb results for Portmarnock core PMC.
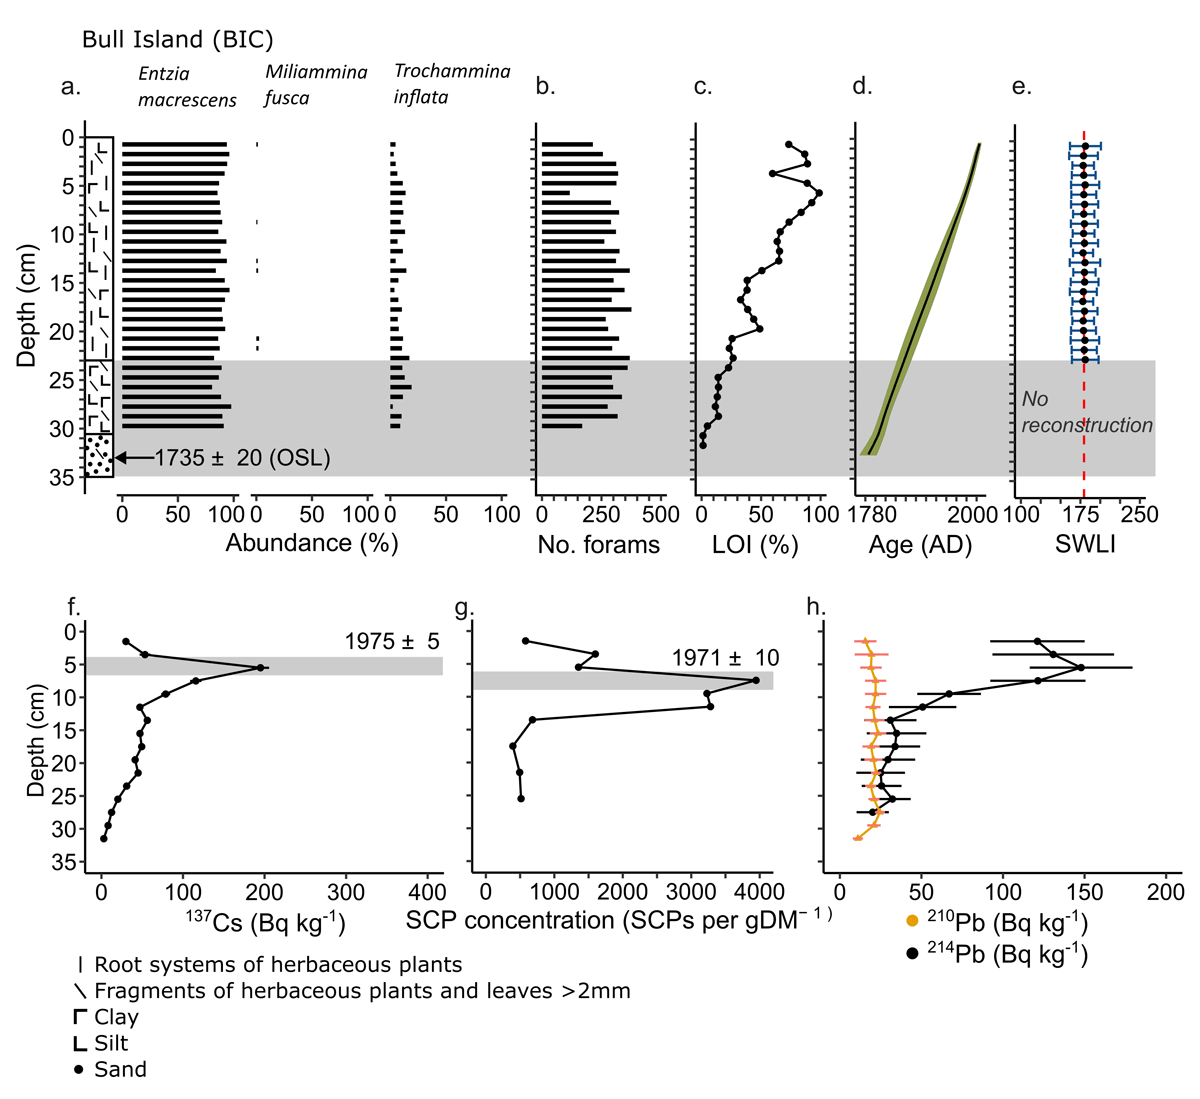
Figure 6
(a) Core log and relative abundance of foraminifera, (b) number of foraminifera counted, (c) percentage total organic matter (LOI), (d) age depth model obtained from R package ‘rplum’ with 95% confidence interval and (e) palaeomarsh elevation predicted by the Bayesian transfer function, expressed as standardised water level index (SWLI) with 95% confidence interval. The red dashed line indicates the core top SWLI. BIC is cropped (a–e) to only include saltmarsh sediments. (f) 137Cs, (g) Spheroidal carbonaceous particle (SCP) concentration and (h) 210Pb and 214Pb results for Bull Island core BIC.
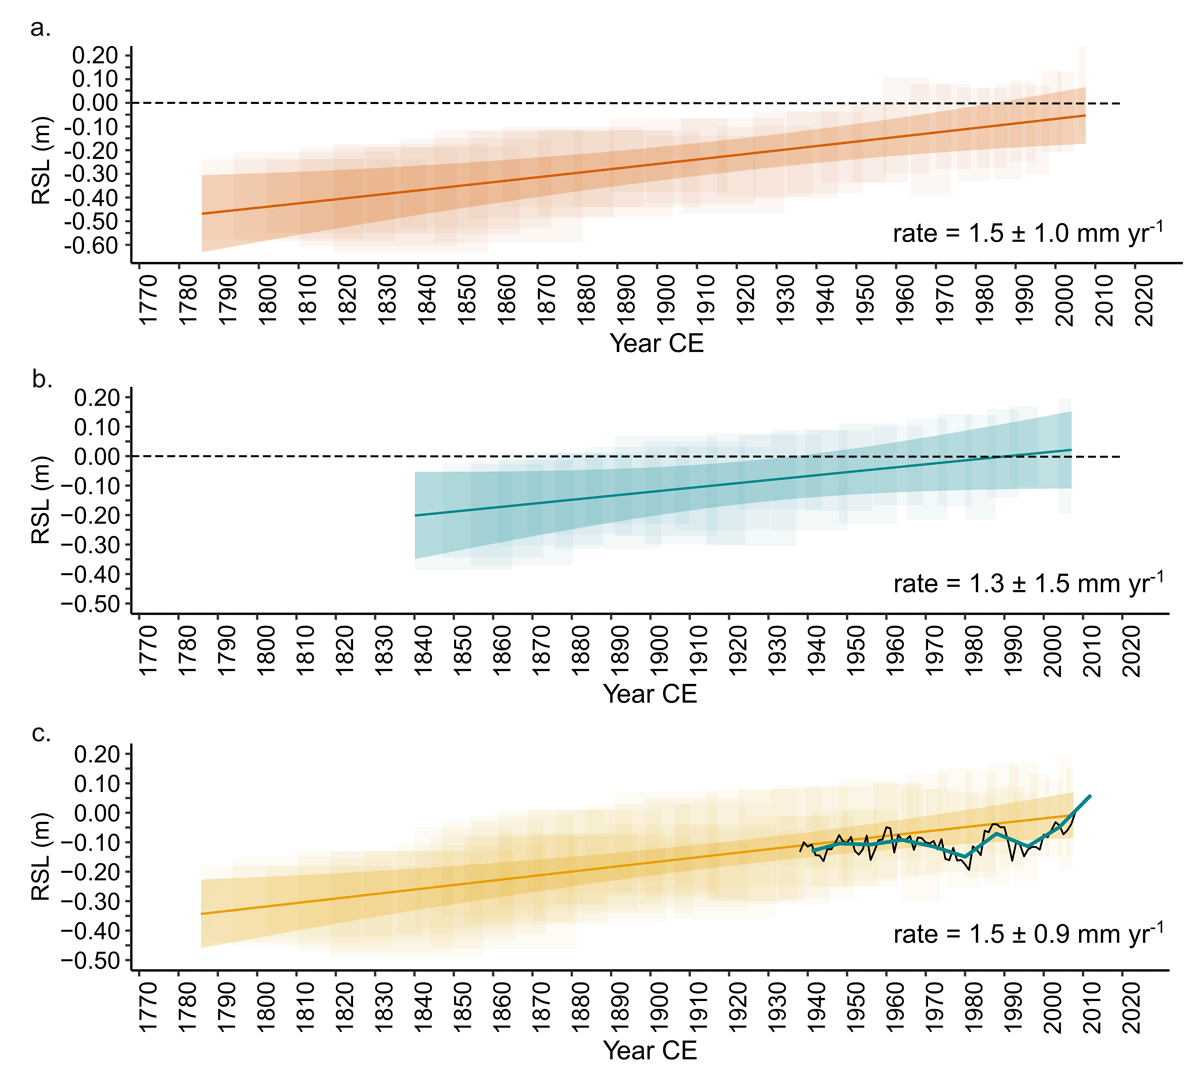
Figure 7
Errors in Variables Integrated Gaussian Process model results for County Dublin sites (a) Portmarnock (orange), (b) Bull Island (blue) and (c) a combined record including results from Portmarnock and Bull Island (yellow) showing mean with 95% confidence interval. Dublin Port tide gauge RSL data is also shown as annual (black line) and 8-year (turquoise) averages.
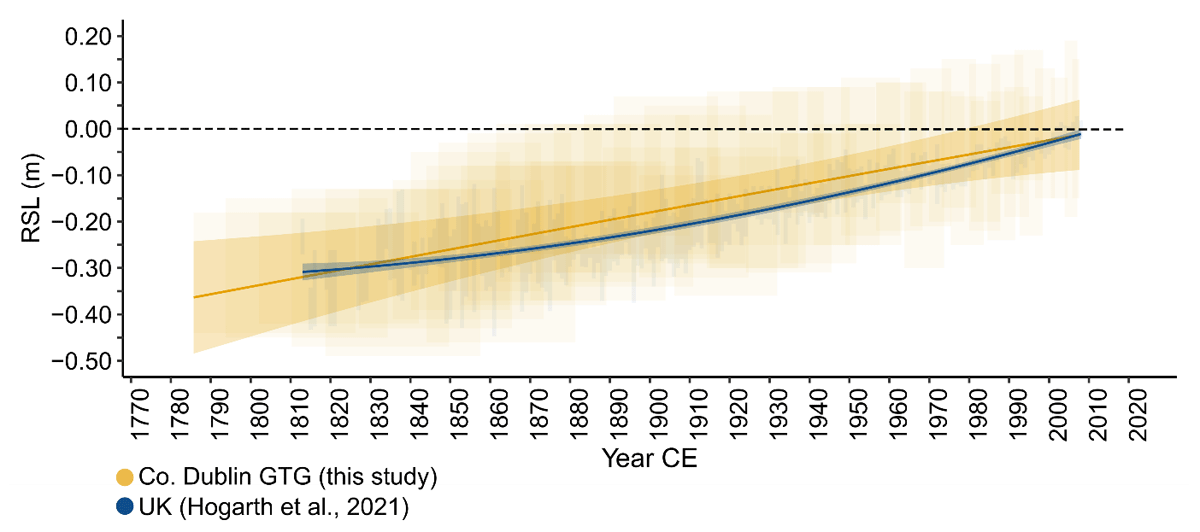
Figure 8
Errors in Variables Integrated Gaussian Process model results for County Dublin (yellow) and the UK (blue; Hogarth et al., 2021) with 95% confidence interval.