
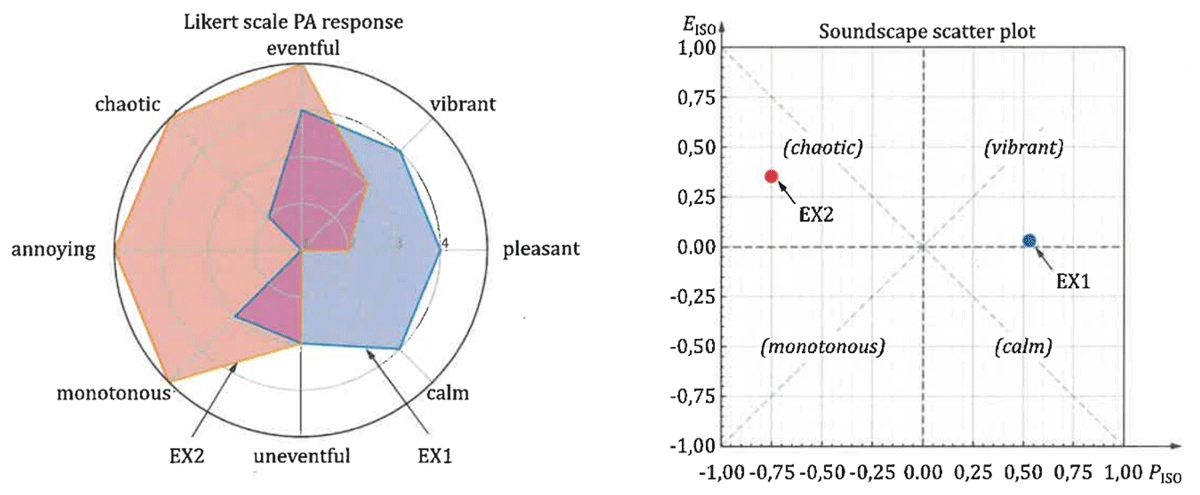
Figure 1
ISO 12913-3 (2025), representation proposal.
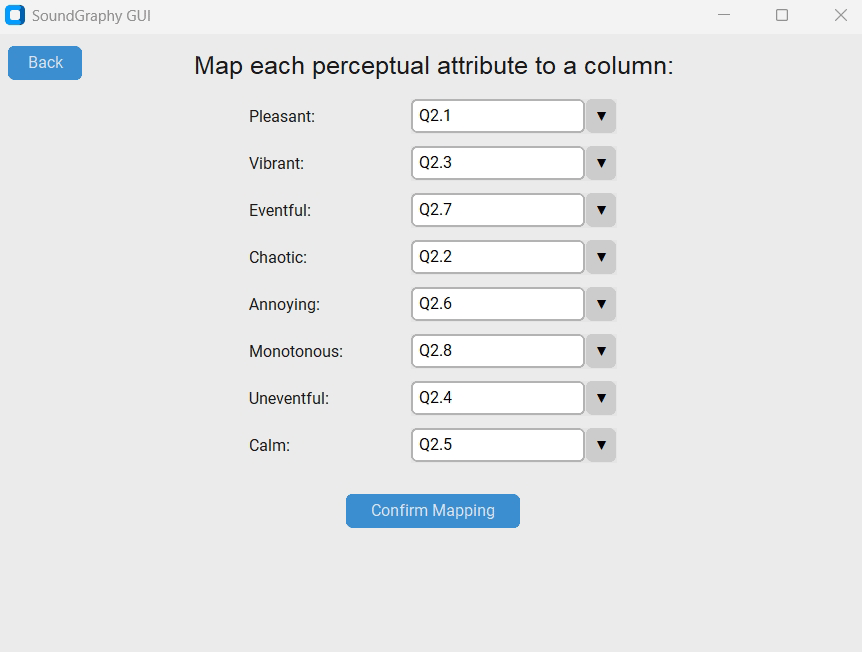
Figure 2
Example of a custom mapping from columns to the perceptual attributes.
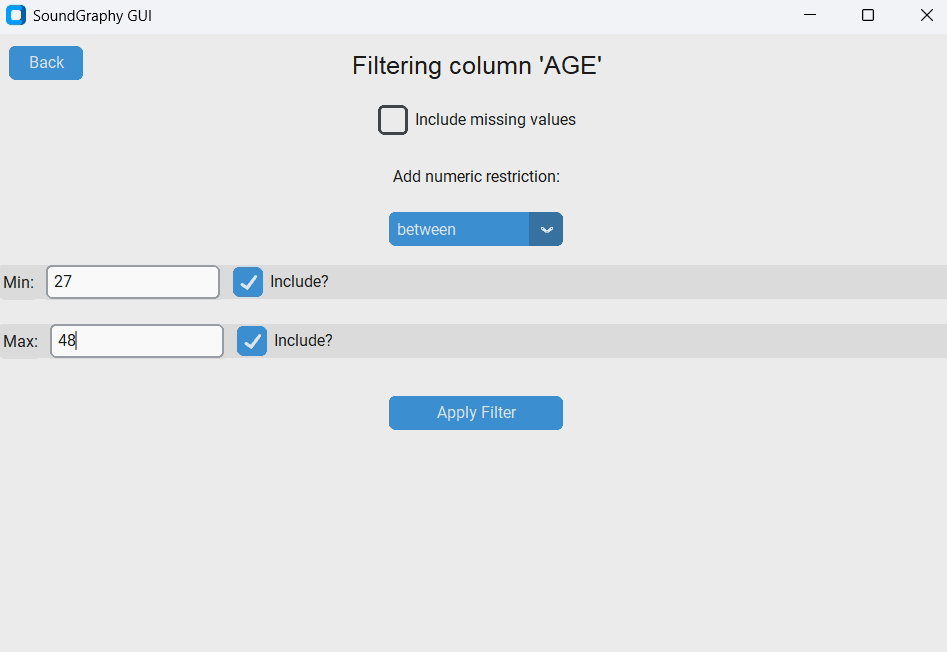
Figure 3
Numerical filtering example, where the quantitative variable ‘AGE’ is isolated using the ‘between’ logical operator to restrict the active dataset to participants aged 27–48 years old, inclusive. The interface also highlights options to manage missing values and toggle boundary inclusion thresholds.
Table 1
Median PA values and projected ISO Pleasantness (PISO) and Eventfulness (EISO) coordinates for multi-site and single-site example datasets.
| PA | 1 | 2 | 3 | 4 | 5 | 6 | 7 | 8 | PISO | EISO |
|---|---|---|---|---|---|---|---|---|---|---|
| SITE | P | CH | V | U | CA | A | E | M | ||
| 1 | 3.0 | 1.0 | 3.5 | 3.0 | 4.0 | 1.0 | 3.0 | 2.0 | 0.537 | –0.110 |
| 2 | 3.0 | 3.0 | 2.0 | 2.0 | 2.0 | 4.0 | 4.0 | 3.0 | –0.250 | 0.207 |
| 3 | 3.0 | 2.0 | 3.0 | 2.0 | 3.0 | 2.0 | 4.0 | 3.5 | 0.140 | 0.097 |
| 4 | 3.0 | 4.0 | 3.0 | 1.0 | 3.0 | 3.5 | 4.0 | 3.0 | –0.125 | 0.384 |
| Single site | 4.0 | 4.0 | 3.0 | 2.0 | 3.0 | 3.0 | 4.0 | 3.0 | 0.030 | 0.280 |
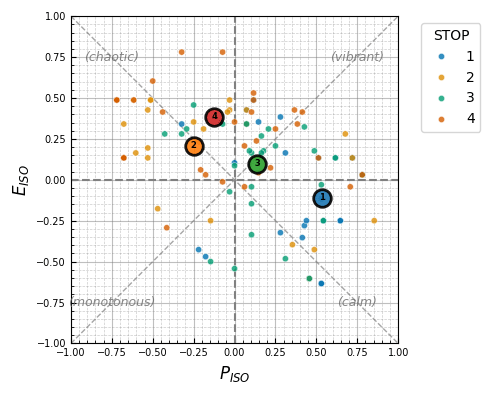
Figure 4
Two-dimensional Cartesian projection (scatter plot).
Individual responses from the multi-site dataset projected onto the PISO and EISO axes, displaying an integrated median representation marker for each of the four stops.
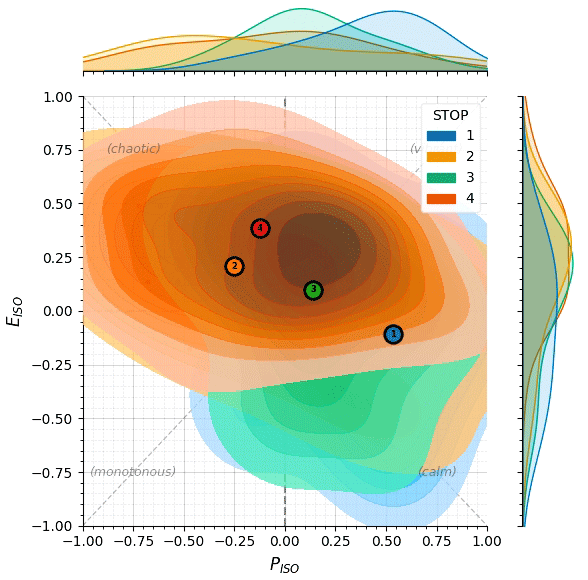
Figure 5
Kernel density option (full percentile contour spectrum).
Provides bivariate distribution layout showing human response variance across all deciles from P10 to P90, accompanied by independent marginal axis distributions.
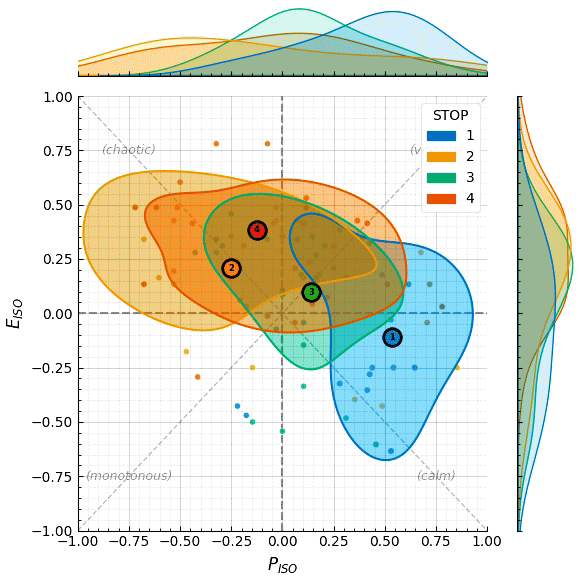
Figure 6
Kernel density option (isolated P50 contour).
Shaded vector limits restricted exclusively to the core P50 boundary, enabling a simplified visual comparison of overlapping spatial categories on a single plane.
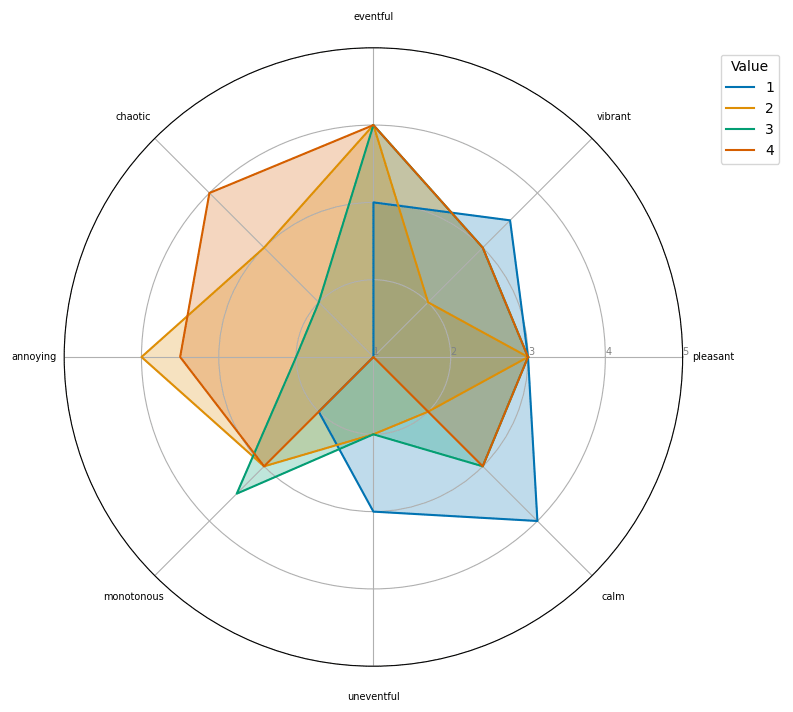
Figure 7
Radar plot (spider chart) for multi-site evaluation.
Simultaneous circular mapping comparing the median response profiles of the eight standardized perceptual attributes across Stops 1 to 4.
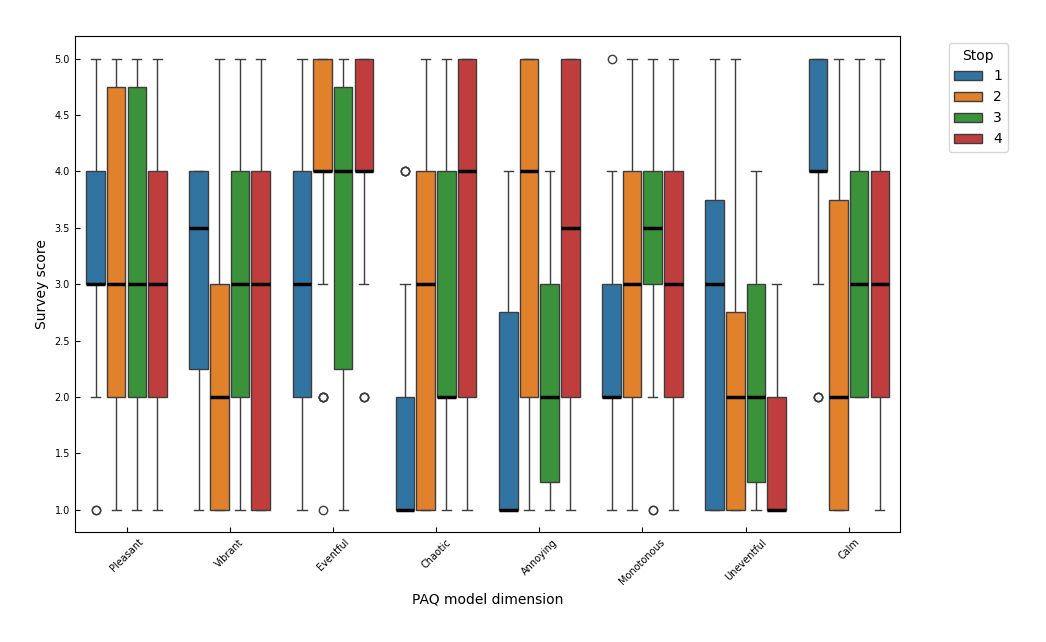
Figure 8
Box-and-whisker plot.
Statistical distribution spread revealing the IQR, internal medians, and outliers for each of the eight standardized perceptual dimensions, grouped by evaluation site.
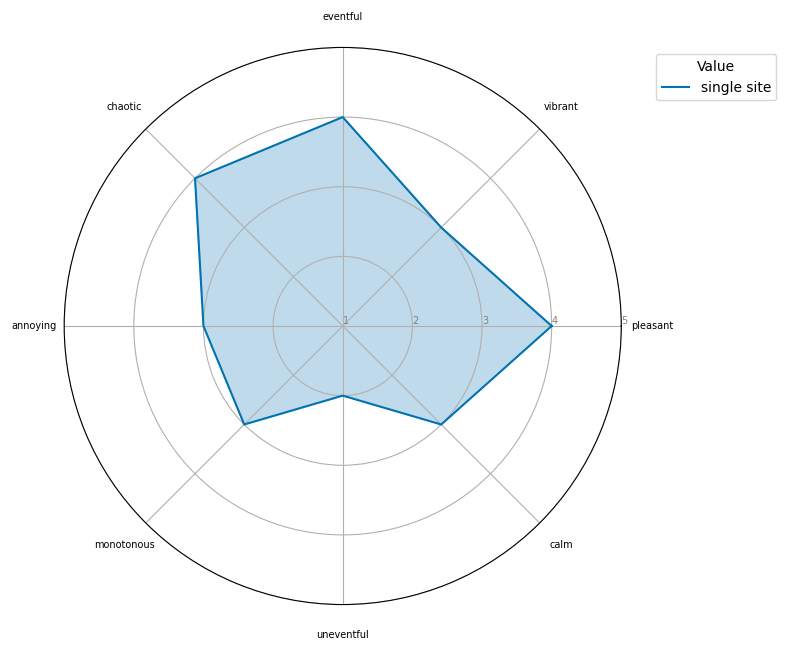
Figure 9
Radar plot (spider chart) for a single site.
Circular profile mapping displaying the individual intensity metrics and dominant perceptual orientations for the localized in situ assessment.
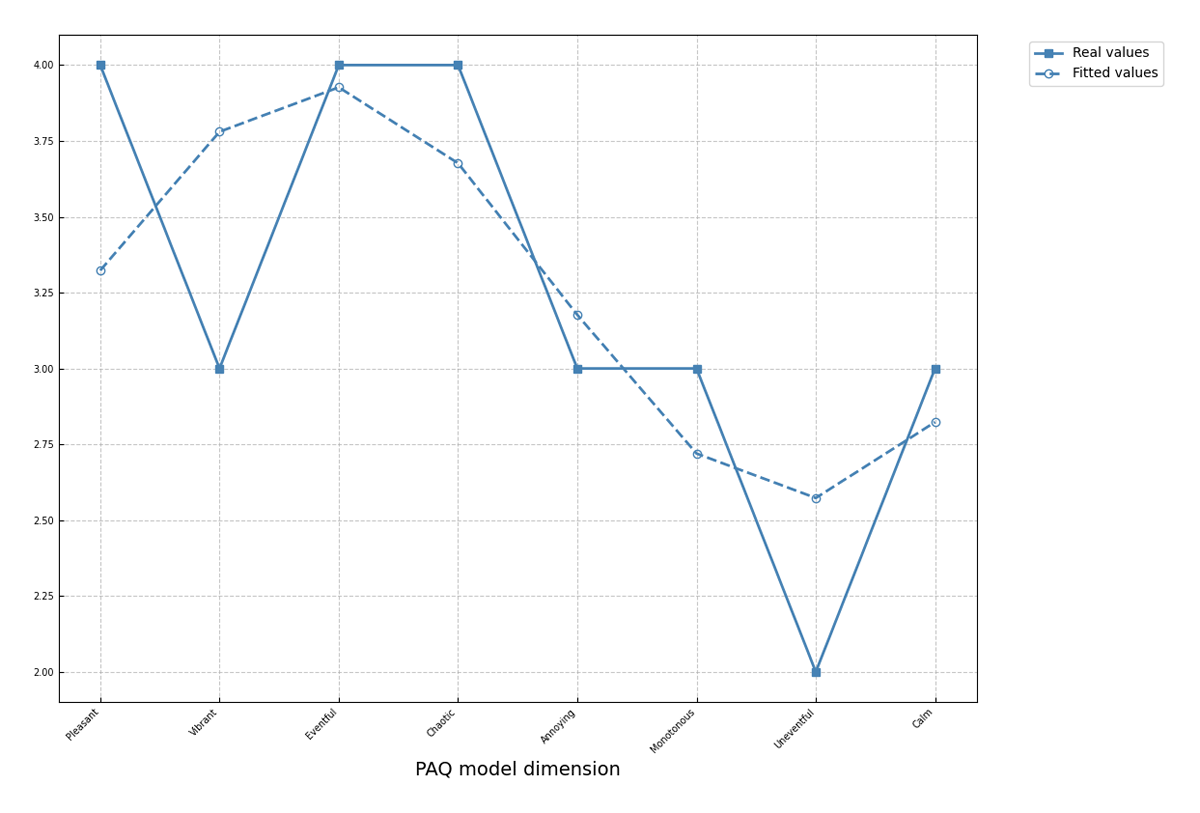
Figure 10
Structural Summary Method (SSM) fitting.
Standardized two-dimensional layout contrasting the empirical profile against the optimized theoretical profile wave to verify geometric conformity to the circumplex model.