
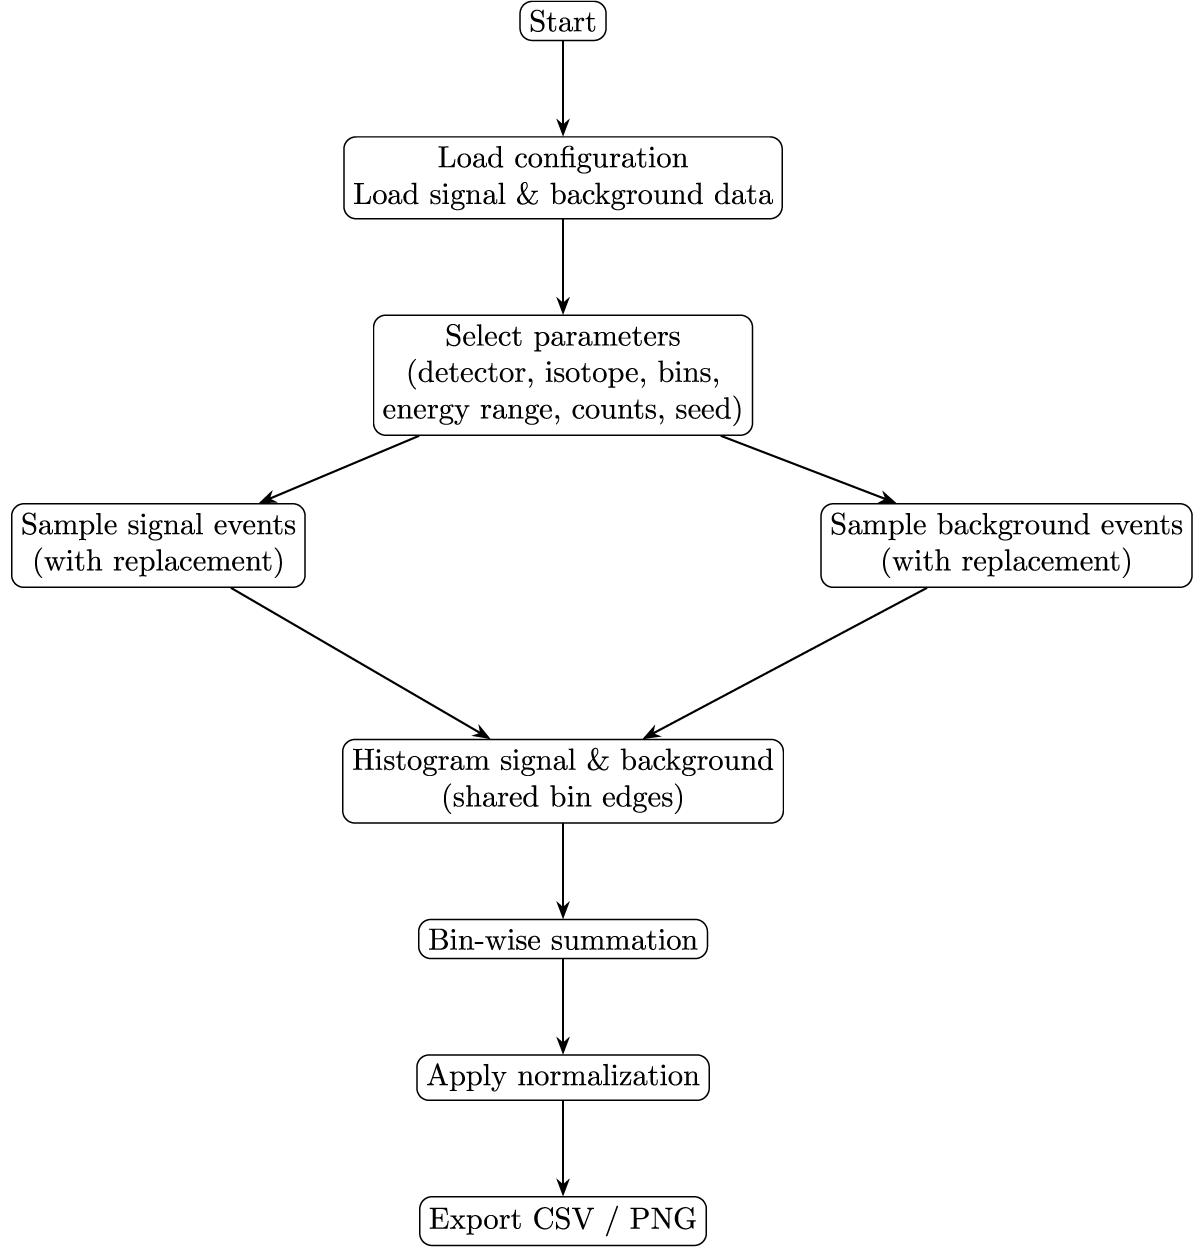
Figure 1
Software workflow of the Isotope Spectrum Builder. Detector-specific signal and background event pools are loaded, user-defined parameters are selected, signal and background events are sampled with replacement, and both components are histogrammed using shared bin edges. The resulting spectra are summed bin-wise, normalized according to the selected option, and exported as CSV or PNG files.
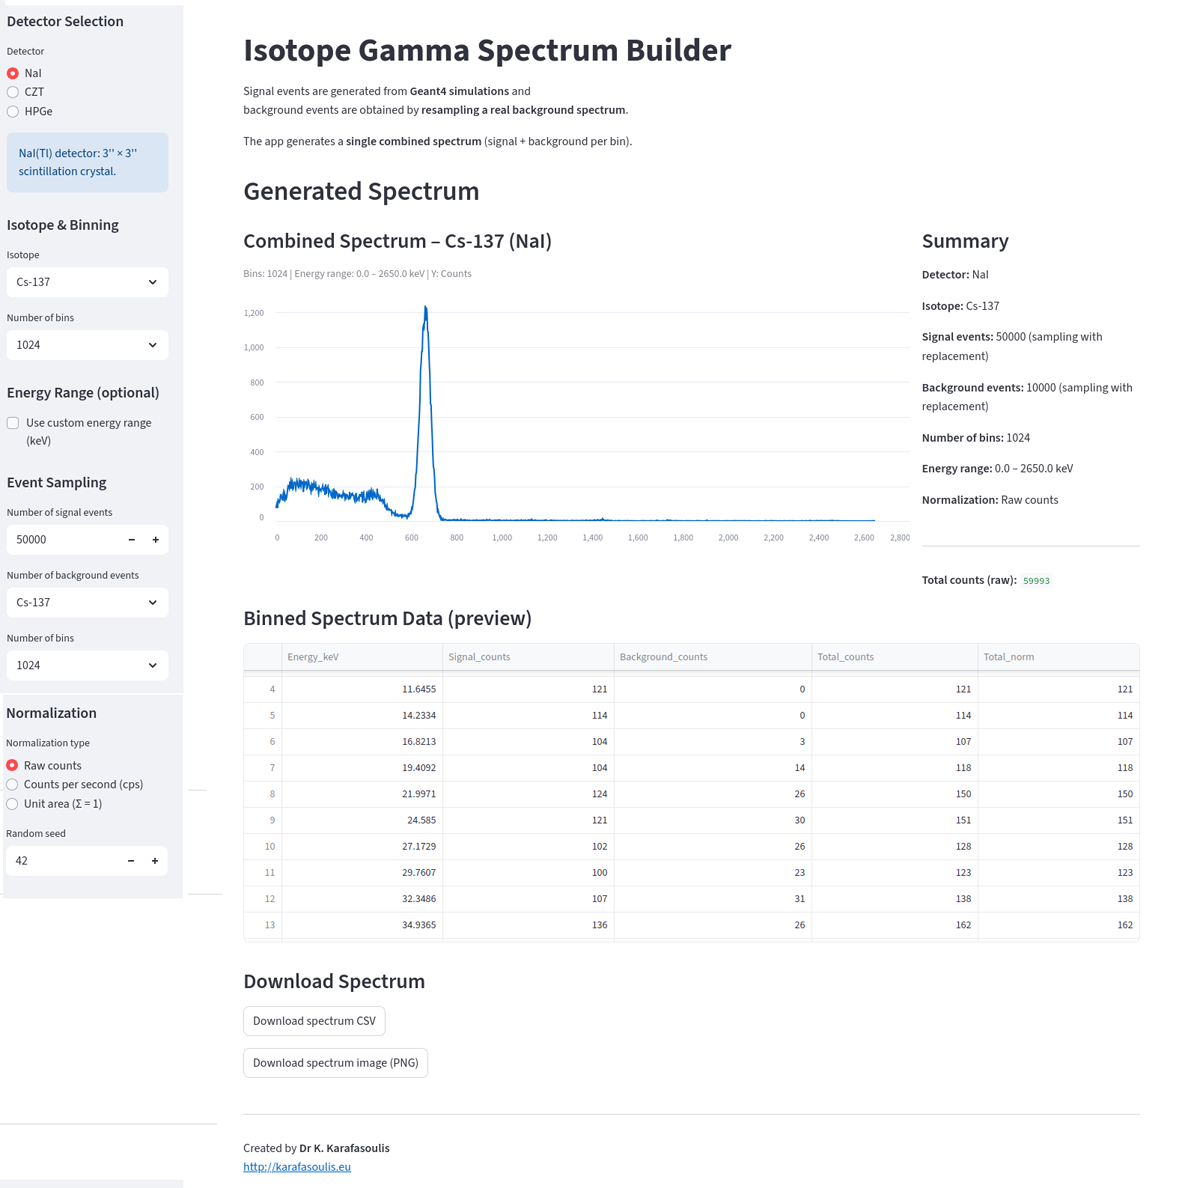
Figure 2
Interactive Streamlit web interface of the Isotope Spectrum Builder. The sidebar provides controls for detector selection, isotope choice, binning, event statistics, energy range, normalization, and random seed. The main panel displays the generated signal-plus-background spectrum, summary statistics, a preview of the binned data, and download buttons for CSV and PNG export.