
(1) Overview
Introduction
Gamma-ray spectroscopy (1) is a foundational technique in nuclear science, supporting applications ranging from environmental radioactivity monitoring and nuclear safeguards to homeland security, medical physics, and basic research. In practice, measured spectra are shaped not only by the discrete emission lines of the radionuclide of interest but also by detector-dependent response effects and by background radiation fields that may dominate the signal at low count rates. These factors complicate both pedagogical demonstrations and the development of robust automated analysis pipelines.
Recent years have seen increasing adoption of data-driven methods, including machine learning and deep learning, for tasks such as isotope identification, peak detection, spectral unmixing, and anomaly detection in streaming measurements (2). These methods typically require large volumes of labeled, detector-aware spectral data spanning a wide range of counting statistics and background conditions. Acquiring such datasets experimentally is expensive and time-consuming, while purely simulated spectra often lack realism if background conditions are oversimplified or absent.
Gamma-ray spectroscopy software can be grouped into three main categories: Monte Carlo simulation frameworks, spectral-analysis environments, and detector-specific acquisition software. For example, Geant4 provides detailed particle-transport simulations through matter, including geometry definition, particle tracking, physics processes, detector response, and event handling (3, 4). ROOT and similar scientific-analysis environments are powerful for histogramming, fitting, visualization, and large-scale scientific data analysis (5). Commercial or laboratory multichannel-analyzer and gamma-spectroscopy software, such as ORTEC MAESTRO, ORTEC GammaVision, and Mirion Genie, is primarily focused on detector control, spectrum acquisition, display, peak analysis, and reporting (6, 7, 8).
Full Monte Carlo simulation frameworks such as Geant4 provide high-fidelity modeling of radiation transport and detector response, but are not designed for rapid, interactive spectrum construction. They require local installation, domain expertise, and significant computational effort, making them inaccessible for many educational and exploratory use cases.
The Isotope Spectrum Builder was developed to bridge this gap. It decouples offline event generation from online spectrum construction by combining two complementary data sources: (i) Monte Carlo–generated signal event pools that encode isotope physics and detector response and (ii) experimentally derived background event pools that preserve realistic continuum and line structures. The software enables rapid, reproducible spectrum generation through both a web-based interface and batch-oriented command-line tools, without requiring users to run Monte Carlo simulations themselves.
Implementation and Architecture
Software overview
The Isotope Spectrum Builder is implemented in Python and organized as a modular software stack. At its core is a reusable Python library (spectrum_builder), distributed through PyPI, that implements event sampling, histogramming, normalization, and export functionality. This allows the package to be installed directly using pip and reused programmatically in external Python workflows.
This separation allows the scientific logic of spectrum construction to be tested, reused, and extended independently of the user interface.
Data model
For each supported detector, two CSV datasets are required:
Signal dataset: Event-level energies generated offline with Geant4, including detector-response smearing. Required columns are Isotope, Event (unused in spectrum construction), and EnergySmeared (keV).
Background dataset: Event-level energies obtained by resampling measured laboratory background spectra for the same type detector. Required columns are Isotope, Event (unused), and Energy (keV).
The signal event pools were generated offline with Geant4.10 using the QGSP_BIC_HP reference physics list together with the PENELOPE low-energy electromagnetic physics models.
For each detector-isotope configuration, the detector was placed at a source-to-detector distance of 20 cm, primary gamma emissions were transported through the detector geometry, and the deposited energy in the sensitive volume was recorded on an event-by-event basis.
Before histogramming, the deposited energy E of each event was Gaussian smeared in order to emulate the finite energy resolution of the corresponding detector. The energy-dependent full width at half maximum was described by
The parameters A and B were selected according to the detector type.
NaI 3" × 3" detector: A = 0 and B = 52.96 keV.
CZT detector, 1 cm × 1 cm × 0.5 cm: A = 0 and B = 26.36 keV.
HPGe detector, diameter 81 mm and length 30.5 mm: A = 1.27 keV and B = 1.32 keV.
The smeared energy, used by the application, corresponds to the event energy after this detector-response smearing. The generated pools are therefore Monte Carlo response distributions that preserve the main spectral characteristics expected for each isotope and detector configuration, including full-energy peaks, Compton continua, and detector-resolution effects. They are subsequently sampled by the application to construct spectra with user-defined count statistics without requiring a new Geant4 simulation for each spectrum.
Additional detector metadata are defined in software-side configuration dictionaries.
This design clearly separates computationally intensive simulation and experimental data acquisition from interactive spectrum construction.
Execution model and performance
Figure 1 summarizes the spectrum construction workflow implemented by the software. At application startup, detector-specific datasets are loaded and cached in memory. Signal events are indexed by isotope, enabling constant-time access to event pools during interactive use. This avoids repeated disk I/O and ensures responsive parameter exploration.
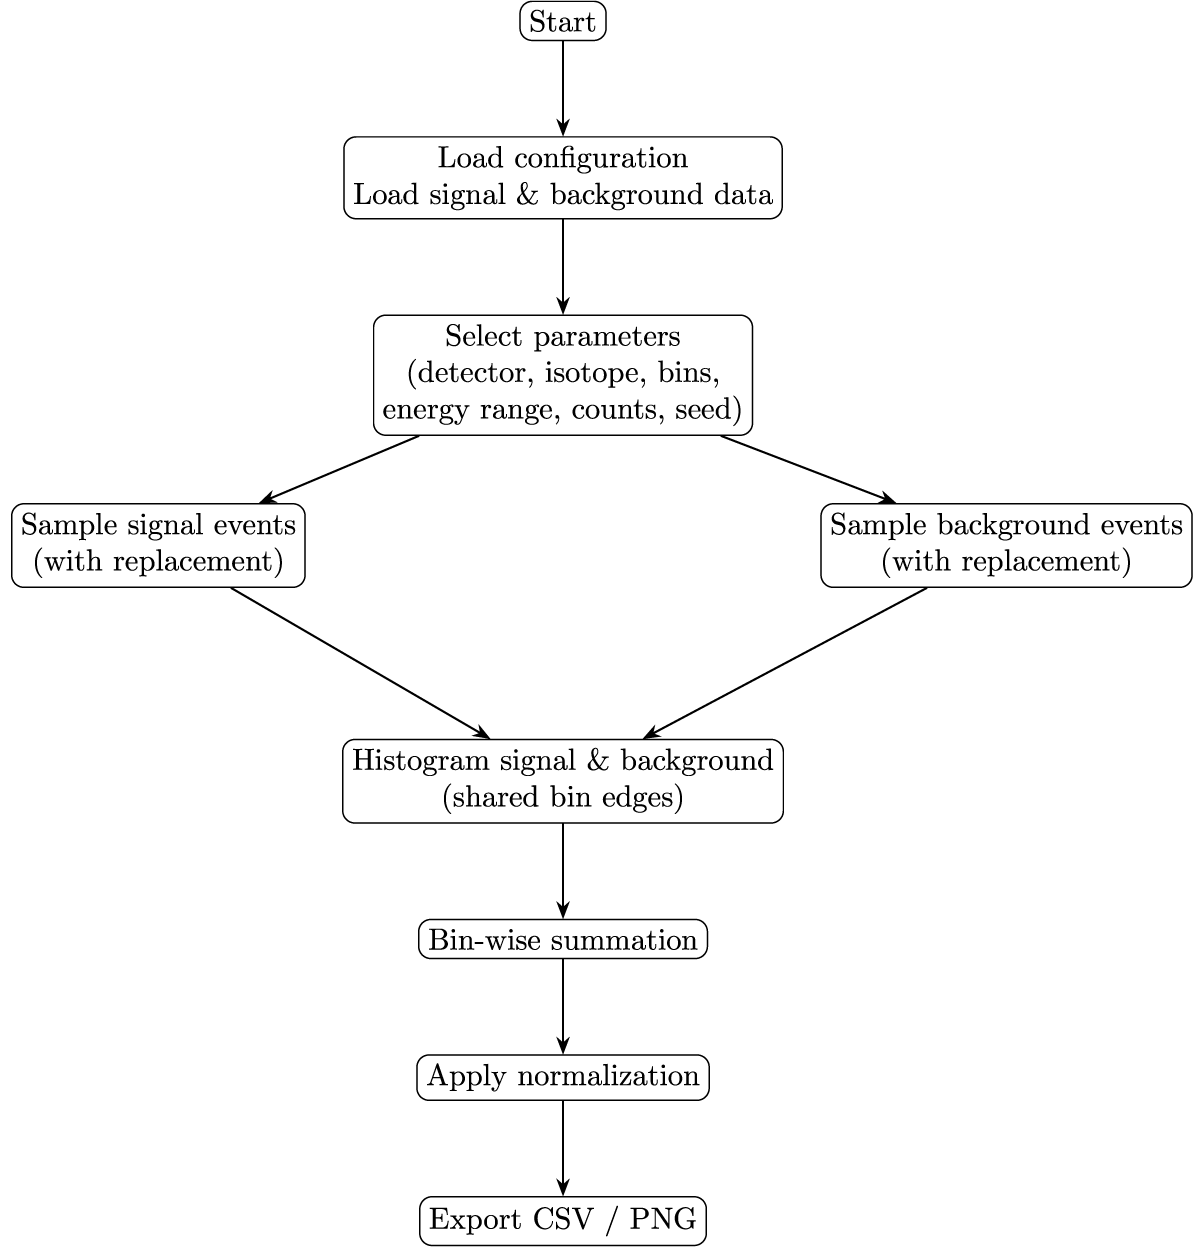
Figure 1
Software workflow of the Isotope Spectrum Builder. Detector-specific signal and background event pools are loaded, user-defined parameters are selected, signal and background events are sampled with replacement, and both components are histogrammed using shared bin edges. The resulting spectra are summed bin-wise, normalized according to the selected option, and exported as CSV or PNG files.
Detectors are activated in the user interface only when valid signal and background datasets are available. File-system details are handled internally and are not exposed to the user.
Spectrum construction pipeline
For a selected detector and isotope, the spectrum construction pipeline proceeds as follows:
Signal events are sampled with replacement from the isotope-specific Monte Carlo pool. This means that after an event is selected, it is returned to the pool and can be selected again in the same generated spectrum. Statistically, this corresponds to bootstrap- like sampling from a finite detector-response distribution. It allows spectra with arbitrary total counts to be generated rapidly while preserving the spectral shape of the original Monte Carlo pool.
Background events are sampled with replacement from the detector-specific background pool.
A common energy range [Emin, Emax] is defined either explicitly by the user or automatically from the sampled events.
Signal and background events are histogrammed using shared bin edges defined by the chosen number of bins.
Histograms are combined bin-wise:
The combined spectrum is normalized according to the selected scheme (raw counts, counts per second, or unit area).
The resulting spectrum is visualized and optionally exported.
When the requested number of sampled events is much larger than the size of the original event pool, the generated spectrum should be interpreted as repeated sampling from the same empirical distribution rather than as a new independent Geant4 simulation. The method is therefore well suited for education, algorithm benchmarking, and machine-learning dataset generation, but it does not replace a full detector-specific Monte Carlo simulation when absolute efficiency, activity estimation, or detailed uncertainty propagation is required.
Web application graphical user interface
The web application is implemented using Streamlit (9) and provides an interactive graphical user interface accessible through a standard web browser. The interface is organized into a main visualization panel and a sidebar for parameter control (Figure 2). The web application is publicly accessible at https://spectrum-builder.streamlit.app, allowing users to interactively construct and export spectra without local installation.
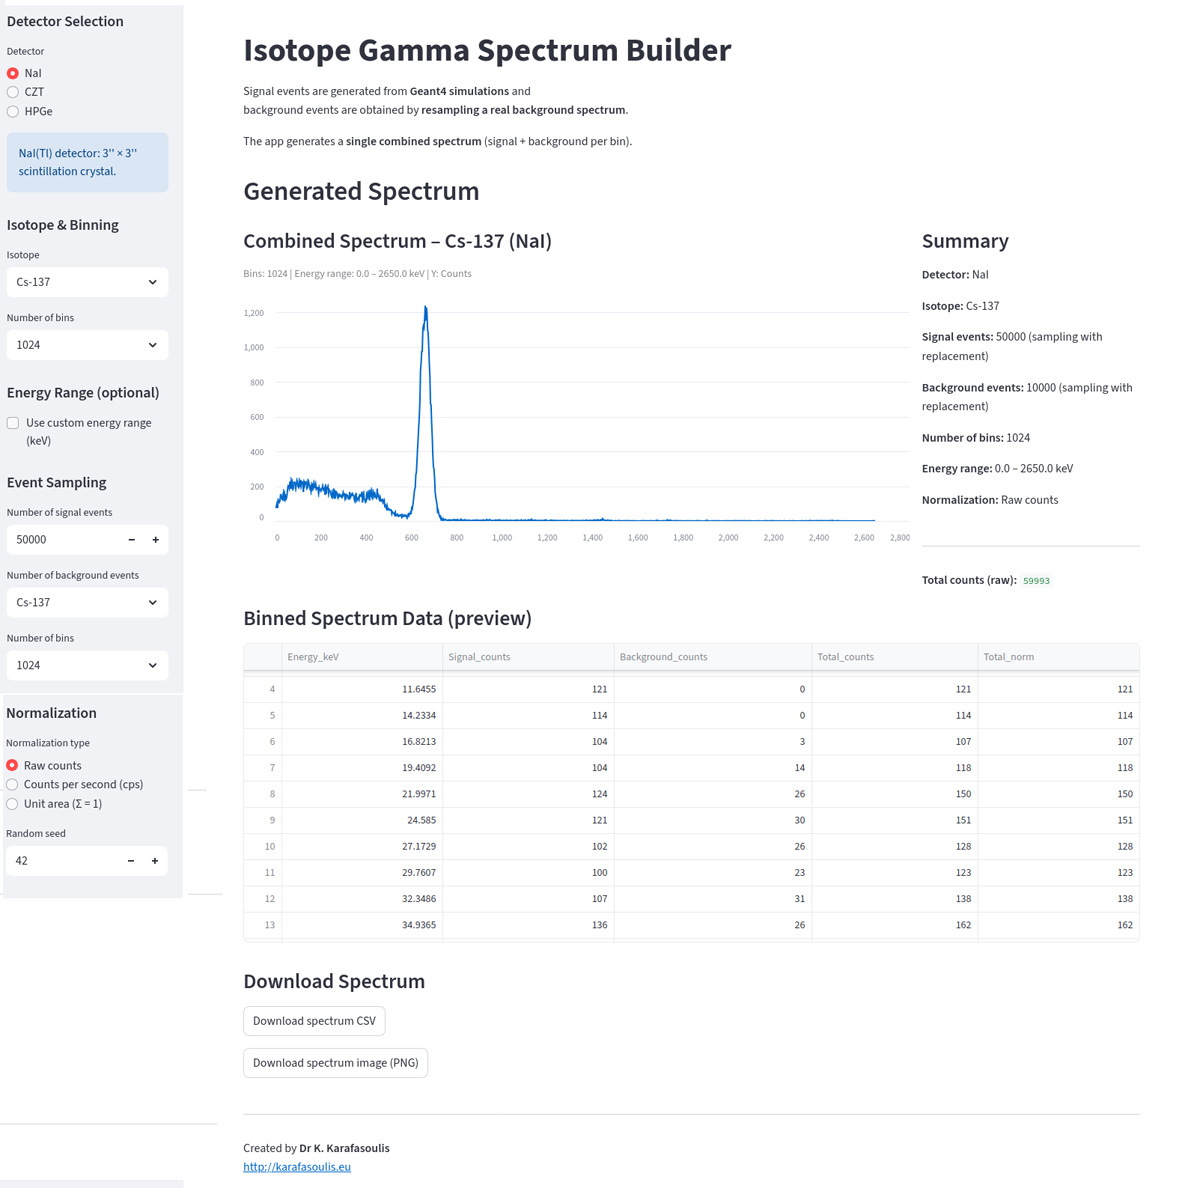
Figure 2
Interactive Streamlit web interface of the Isotope Spectrum Builder. The sidebar provides controls for detector selection, isotope choice, binning, event statistics, energy range, normalization, and random seed. The main panel displays the generated signal-plus-background spectrum, summary statistics, a preview of the binned data, and download buttons for CSV and PNG export.
The sidebar allows users to:
Select the detector type (e.g., NaI(Tl), CZT, HPGe) from available configurations.
Select the radionuclide isotope from a dynamically populated list based on available signal datasets.
Specify the number of signal and background events to be sampled.
Choose the number of histogram bins (1024, 2048, or 4096).
Define an optional energy range [Emin, Emax]; if omitted, the range is determined automatically.
Select the normalization scheme (raw counts, counts per second with acquisition time, or unit-area normalization).
Set a random seed to ensure reproducibility.
The main panel displays the resulting spectrum as an interactive plot, allowing zooming and inspection of spectral features. Detector metadata (e.g., crystal dimensions or detector volume) is displayed to contextualize the spectral response. Users can export the generated spectrum as a CSV file or download an annotated PNG image that includes the isotope name and software attribution.
This interface supports rapid exploration of how detector choice, statistics, binning, and background influence spectral appearance, making it suitable for both teaching and exploratory research.
Batch spectrum generation scripts
Alongside the web interface, the Isotope Spectrum Builder includes two command-line batch scripts that support reproducible, large-scale spectrum generation.
Single-configuration batch generation
The first batch script, (batch_generate.py), enables non-interactive generation of spectra based on a user-supplied job configuration file (CSV). Each row specifies detector type, isotope, number of signal and background events, binning, energy range, normalization, and random seed. The script processes all jobs sequentially and writes individual output files or structured datasets suitable for downstream analysis.
This mode is intended for automated reproduction of specific spectra, parameter studies, and integration into external workflows such as continuous integration pipelines or simulation campaigns.
Sweep-based dataset generation
The second batch script, (batch_sweep_isotope.py), supports sweep-based generation of multiple spectra for a single isotope and detector by sampling signal and background event counts from user-defined ranges. For each sweep, the script generates multiple statistically independent spectra and writes all outputs into a single CSV file, with one spectrum per row.
Each row includes metadata columns describing the isotope, detector, normalization, binning, and event-count parameters used to generate the spectrum. This format is optimized for machine-learning applications, enabling straightforward ingestion into training and validation pipelines for classification, regression, or anomaly-detection tasks.
Both batch scripts rely on the same core library as the web application, ensuring consistency between interactive and automated spectrum generation.
Detectors and variants
The architecture supports multiple detector technologies. Current deployments include NaI(Tl), CZT, and HPGe configurations, provided corresponding datasets are available. Detector metadata (e.g., NaI(Tl) 3" × 3" crystal, CZT volume 0.5 cm3) is presented to users to contextualize expected spectral characteristics.
Quality Control
Quality control in the Isotope Spectrum Builder is addressed through a combination of systematic input validation, deterministic execution, automated testing of the core library, and cross-checking against independent reference implementations. The objective is to ensure internal consistency, reproducibility, and transparent behavior across both interactive and batch execution modes.
Input validation: All user inputs and datasets are validated at runtime before spectrum construction. This includes verification of required dataset columns, non-empty isotope event pools, physically meaningful energy ranges (Emax > Emin), supported bin counts, and valid normalization parameters. For counts-per-second normalization, the presence of a positive acquisition time is enforced. Invalid configurations are rejected with explicit error messages to prevent silent failures or ambiguous results.
Deterministic execution and reproducibility: Spectrum generation relies on pseudo-random sampling with replacement from fixed event pools. A user-controlled random seed is exposed in both the web application and batch scripts, allowing deterministic reproduction of spectra for identical configurations and datasets. This enables exact regeneration of results for benchmarking, debugging, and peer verification.
Automated testing: A lightweight automated test suite targets the core spectrum-construction library independently of the web interface. Tests verify fundamental properties including conservation of event counts under histogramming, correct bin-wise summation of signal and background, correct behavior of normalization modes (raw counts, counts per second, and unit-area), sampling with replacement for pool sizes smaller than requested event counts, and integrity of CSV and image export functions. These tests are designed to be fast and data-independent, relying on small synthetic inputs rather than large detector datasets.
Cross-checking against reference histogramming: Generated spectra have been cross-validated against independent offline histogramming of the same sampled energies using identical bin definitions and ranges. This comparison confirms agreement of bin counts and normalization, ensuring that the implemented pipeline behaves as expected and does not introduce hidden transformations.
Consistency across execution modes: Both the interactive web application and the batch scripts invoke the same core library functions for sampling, histogramming, normalization, and export. This architectural choice ensures that spectra generated via the graphical interface are numerically identical to those produced in non-interactive batch workflows given the same configuration and random seed.
Taken together, these measures ensure that generated spectra are internally consistent, reproducible, and suitable for use in educational demonstrations, algorithm benchmarking, and data-driven research workflows. While the software does not aim to replace full detector simulation or calibration pipelines, its quality-control mechanisms provide transparent and reliable behavior within its intended scope.
(2) Availability
Operating System
Platform independent. Local execution supported on Linux, macOS, and Windows with Python ≥ 3.9.
Programming Language
Python ≥ 3.9.
Dependencies
The main runtime dependencies are NumPy, pandas, Matplotlib, and Streamlit. Exact tested versions are specified in the repository requirements.txt file and in the archived software release to support reproducible local installation. Development and testing dependencies are documented separately in the repository.
Software Location
Archive
Name: Zenodo archive
Persistent identifier: https://doi.org/10.5281/zenodo.18134777
Licence: MIT License
Publisher: Konstantinos Karafasoulis
Version published: v1.0.3
Package repository
Name: PyPI
Identifier: spectrum-builder
Persistent identifier: https://pypi.org/project/spectrum-builder/
Licence: MIT License
Publisher: Konstantinos Karafasoulis
Version published: v1.0.3
Code repository
Name: GitHub
Persistent identifier: https://github.com/ckaraf/spectrum-builder
Licence: MIT License
Sample datasets
A set of sample signal and background CSV files is provided with the software repository and archival release. These files allow users to verify the installation, inspect the required input format, and generate example spectra without running Geant4 simulations. The sample signal files contain event-level isotope labels and smeared deposited energies, while the background files contain event-level energies derived from measured laboratory background spectra.
Language
English.
List of Contributors
Konstantinos Karafasoulis (Hellenic Army Academy): Conceptualization, software design and development, implementation of the spectrum construction framework, validation, documentation, and manuscript preparation.
Aristotelis Kyriakis (Institute of Nuclear and Particle Physics, NCSR “Demokritos”, Greece): Provision of CZT detector data incorporated in this work.
Constantinos Potiriadis (Greek Atomic Energy Commission): Provision of experimental background gamma-ray spectra used for background event resampling.
(3) Reuse Potential
The Isotope Spectrum Builder is designed for reuse across education, research, and applied data-analysis contexts. Typical reuse scenarios include educational demonstrations of counting statistics and background effects, benchmarking of isotope-identification and anomaly-detection algorithms (10), generation of labeled datasets for machine learning, and comparative studies of detector response.
The modular architecture allows new detectors and isotopes to be added by introducing additional datasets, without modification of the core software. Distribution through PyPI further supports reuse by enabling straightforward installation in Python environments, including scripts and machine-learning pipelines. The permissive MIT license encourages reuse in both academic and applied settings.
Future extensions will allow users to upload experimental background spectra through the web interface, compare measured spectra with simulated-plus-background spectra, and access expanded signal datasets that include shielding, scattering, and mixed-source scenarios. These additions would support more realistic benchmarking cases, such as shielded sources, mixed-isotope spectra, and direct comparison between measured and synthetic spectra.
Support Mechanisms
User support and community contributions are managed through the GitHub issue tracker at https://github.com/ckaraf/spectrum-builder/issues.
Acknowledgements
The author acknowledges the Geant4 Collaboration for the development and maintenance of the Geant4 Monte Carlo simulation toolkit, which was used to generate the signal event pools underlying this software. The author also acknowledges Streamlit Inc. for providing the Streamlit framework, which enables the development and deployment of the interactive web application interface.
Author Contributions
Konstantinos Karafasoulis: Conceptualization, Software, Methodology, Validation, Writing.