
Figure 1
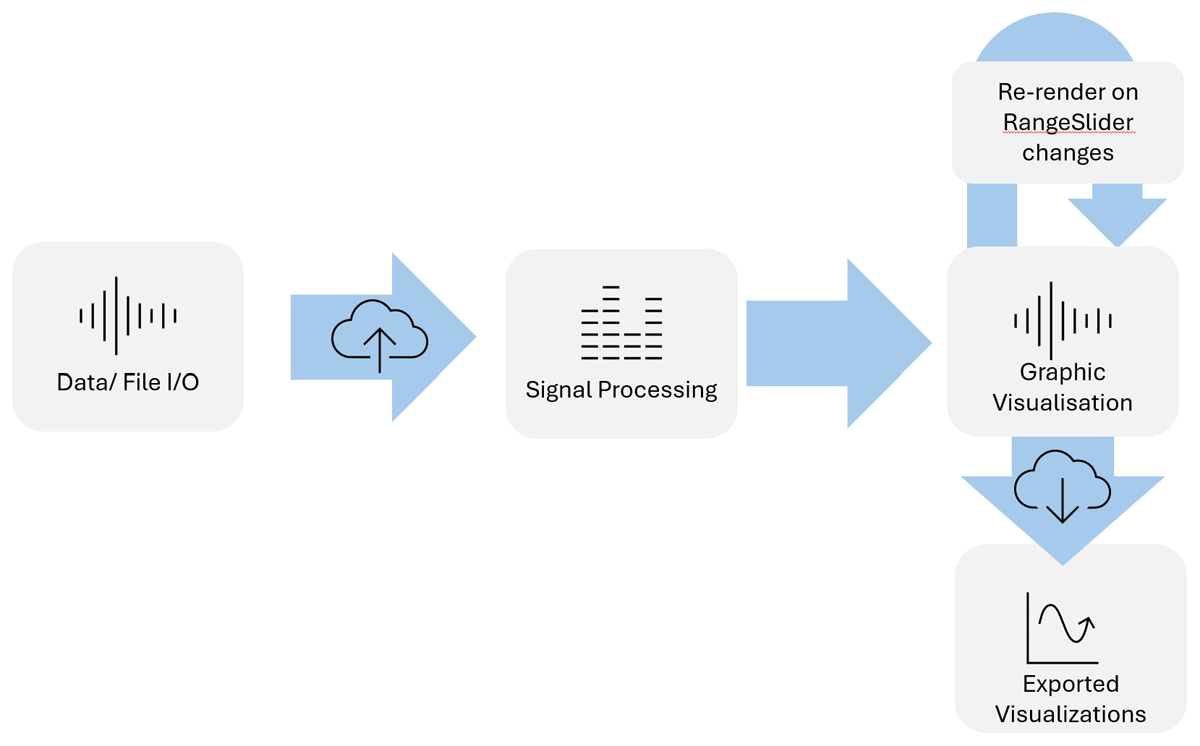
BickGraphing system architecture showing the data flow from file input to signal processing then graphical visualisation and finally export, with a re-render loop on RangeSlider changes.
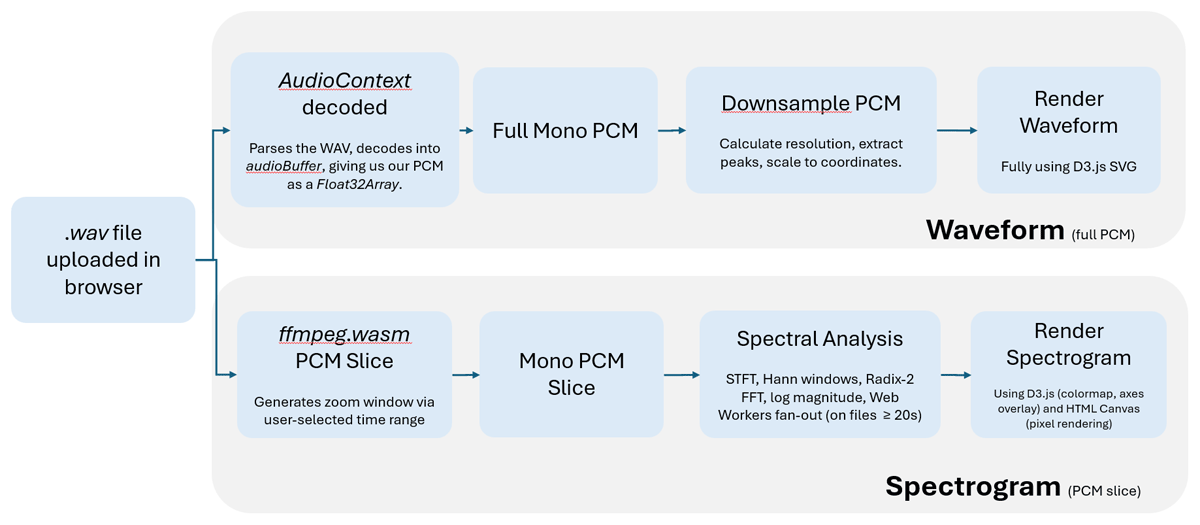
Figure 2
Client-side signal processing pipeline. The .wav file is decoded via two parallel paths: AudioContext decodes the full file for waveform generation, while ffmpeg.wasm slices a user-selected time window for spectrogram computation via Radix-2 FFT with an optional pool of Web Workers for files longer than 20 seconds.
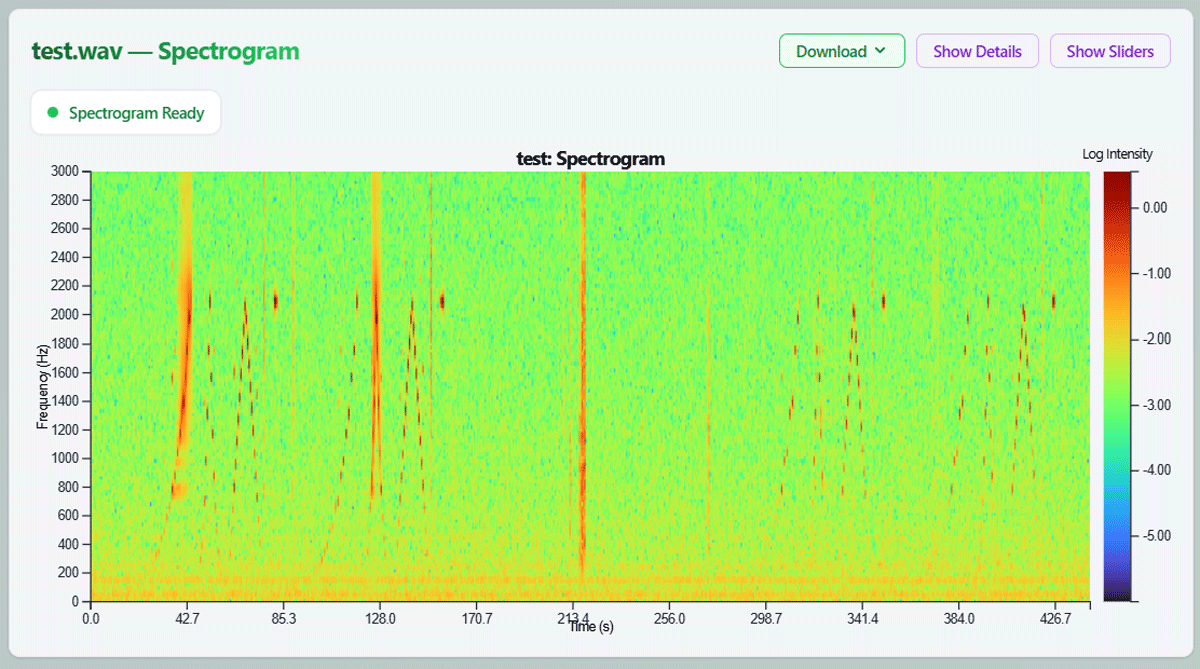
Figure 3
Spectrogram heatmap generated from test.wav in BickGraphing, showing time on the x-axis, frequency from 0–3000 Hz on the y-axis, and a log-intensity colour scheme legend on the right. The interface includes interactive controls and a “Spectrogram Ready” status indicator.
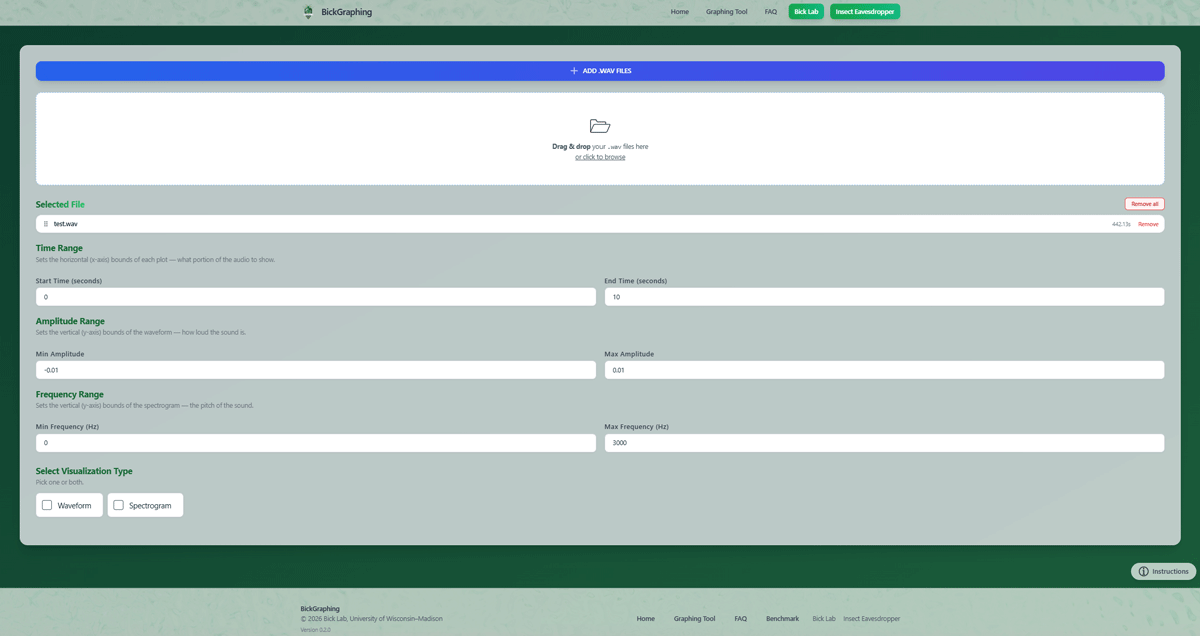
Figure 4
BickGraphing UI component layout showing the central Graph component managing file management, view control, global time, amplitude, frequency controls, and main visualisation components.
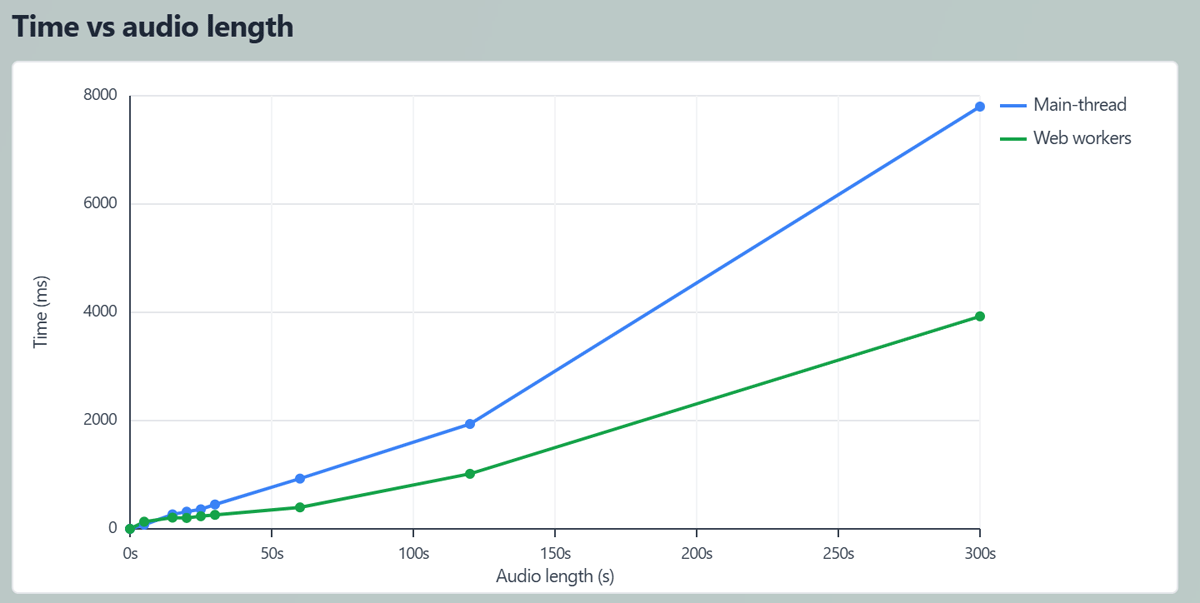
Figure 5
STFT computation time versus audio length comparing main-thread and Web Worker execution. The lines diverge at approximately 20 seconds, with Web Workers reducing computation time by approximately 50% at 300 seconds (4,654 ms versus 1,423 ms), identifying the empirical threshold below which Web Worker startup overhead exceeds the parallelism benefit.
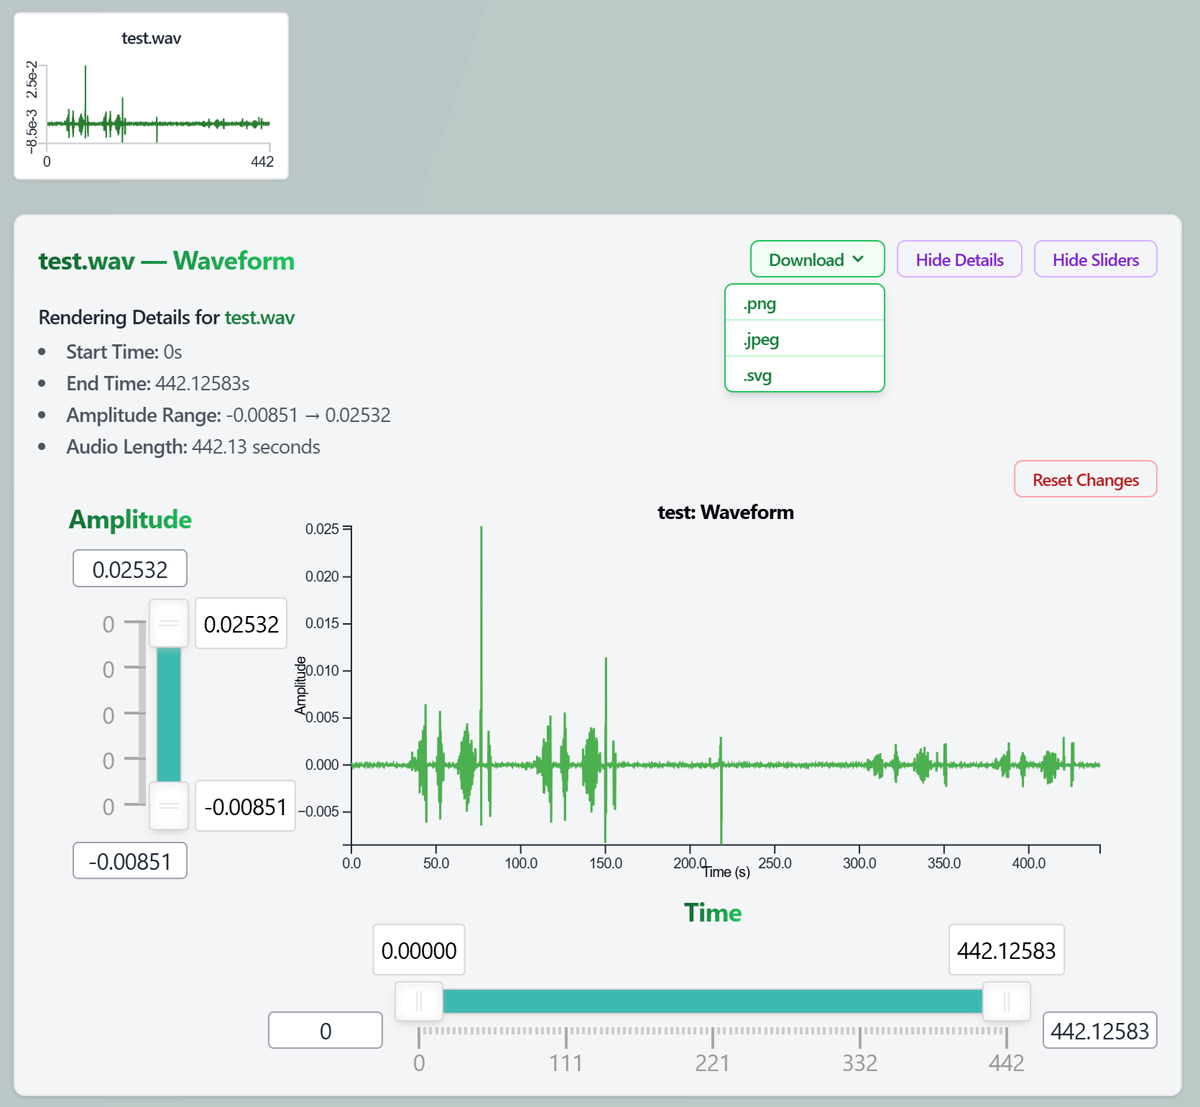
Figure 6
BickGraphing waveform view of test.wav (442 seconds) showing insect vibrational events as amplitude spikes concentrated between 30 and 160 seconds, with MiniWaveform thumbnail and interactive amplitude and time range sliders.
Table 1
BickGraphing Feature Comparison versus Leading Audio Research Tools.
| FEATURE | BICKGRAPHING | RAVEN PRO | AUDACITY | SONIC VISUALISER | LIBROSA | |
|---|---|---|---|---|---|---|
| Accessible Deployment | Browser-based (no install) | Yes | No | No | No | No |
| Field-portable (low compute) | Yes | No | No | No | No | |
| Mobile/tablet support | Yes | No | No | No | No | |
| Cost | Free | Paid | Free | Free | Free | |
| Coding required | No | No | No | No | Yes | |
| Licence | MIT | Proprietary | GPL-2.0+ | GPL-2.0 | ISC | |
| Offline capable | Yes | Yes | Yes | Yes | Yes | |
| Visualisation | Waveform display | Yes | Yes | Yes | Yes | Yes |
| Spectrogram display | Yes | Yes | Yes | Yes | Yes | |
| Multi-file batch viewing | Yes | Yes | Limited | Separate | Scripted | |
| SVG export | Yes | Yes | Yes | Yes | Yes | |
Table 2
BickGraphing STFT Benchmark: Main-thread versus Web Worker computation time at selected audio lengths.
| LENGTH (s) | FRAMES | MAIN-THREAD (ms) | WEB WORKERS (ms) | SAVED (ms) |
|---|---|---|---|---|
| 5 | 214 | 68 | 132 | –64 |
| 15 | 644 | 207 | 185 | 22 |
| 20 | 860 | 273 | 212 | 61 |
| 22 | 946 | 284 | 227 | 57 |
| 24 | 1032 | 303 | 243 | 60 |
| 25 | 1075 | 318 | 222 | 96 |
| 30 | 1290 | 387 | 261 | 126 |
| 60 | 2582 | 763 | 351 | 412 |
| 120 | 5166 | 1493 | 681 | 812 |
| 300 | 12918 | 4654 | 1423 | 3231 |