
(1) Overview
Introduction
Audio data is of increasing importance to academic researchers. This is in part enabled by cost effective hardware, as well as easy to implement large data algorithms. Prior to deploying these algorithms, there is a critical step of exploratory data analysis. Sound lends itself to visualising during this exploratory step.
Exploratory data analysis of audio includes visualisations of waveforms and spectrograms. Waveforms are visualisations of the recording’s time on the x-axis by amplitude on the y-axis. Spectrograms are 3D graphs that include time on the x-axis, frequency on the y-axis, and power serving as a colour coded intensity layer. These two basic visualisations are the most used method of exploring audio data [1].
There are many methods to visualise waveforms and spectrograms, which include coding packages, paid software, and freeware. These programs were primarily designed for music, rather than research; this misalignment of use cases usually results in limited functionality when researchers try to visualise many files, and difficulty around the detailed inspections of each research audio file. Moreover, these approaches are limited by coding knowledge, funding associated with paid software, and the need to download software. Additionally, significant computational power is needed for all these methods. This severely limits potential field or in situ applications of exploratory analysis for acoustic sensors, such as checking if an acoustic sensor is functioning as expected in the field.
In response to this need, authors developed and launched BickGraphing, a web-based audio visualisation platform. BickGraphing has the potential to be a local, easy-to-use coding-free option for visualising audio data in research. This platform fills this gap by providing a browser-based application that allows users to upload .wav files locally and interactively explore waveforms and spectrograms. In support of accessibility, offline use cases are supported with BickGraphing, via preloading or downloading. Here, we describe the software architecture, its availability, and its potential for reuse across audio research studies that require rapid spectrogram and waveform inspection.
Implementation and architecture
BickGraphing comprises four subsystems orchestrated by the central Graph component (Figure 1): file input, signal processing, graphic visualisation, file output.
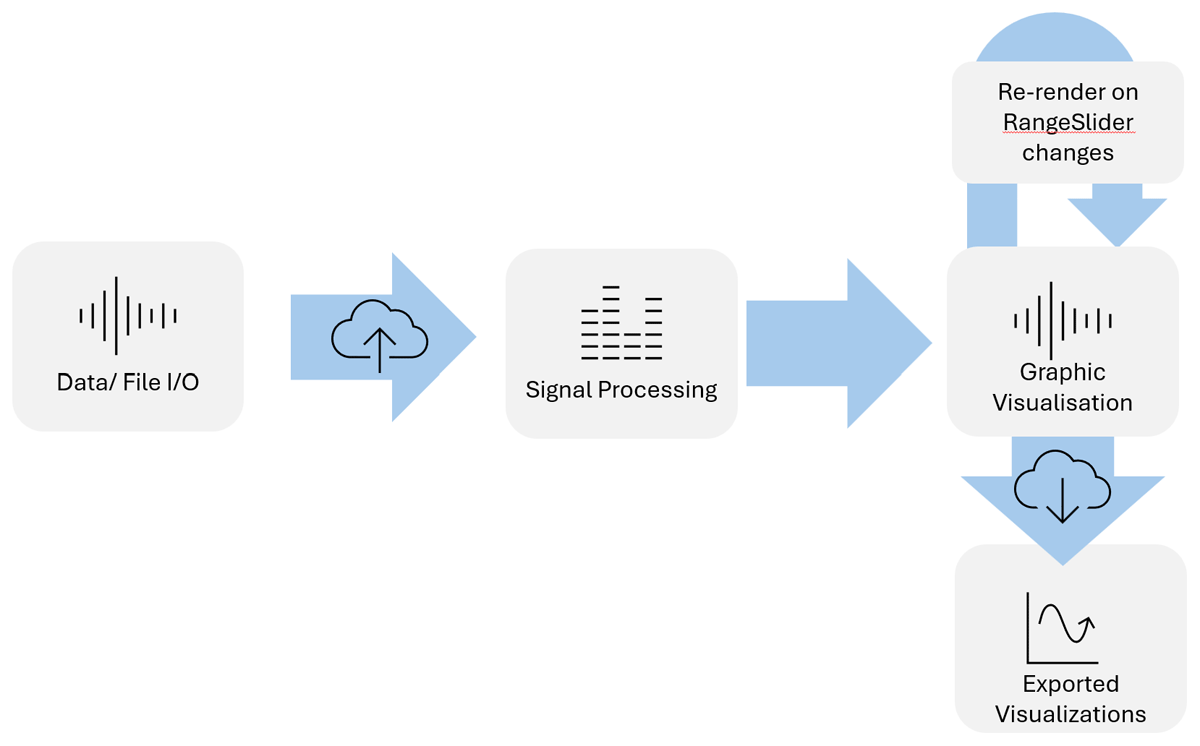
Figure 1
BickGraphing system architecture showing the data flow from file input to signal processing then graphical visualisation and finally export, with a re-render loop on RangeSlider changes.
BickGraphing implementation
BickGraphing has been developed in SvelteKit using TypeScript because of its fast performance on web platforms, compile-time type checking, and ease of deployment as static files. It is implemented as a four-page web application, built and bundled with Vite for sub-second hot reloads and optimised production builds. Node.js (20.19 or later) serves as the environment at both build-time and runtime, compiling TypeScript via the SvelteKit toolchain, resolving npm package dependencies, and running the Vite development server. It is styled with Tailwind CSS, with supporting plugins for forms and typography, and Autoprefixer (a PostCSS plugin that automatically adds CSS vendor prefixes for cross-browser compatibility), for responsive, mobile-first layouts that work across desktop, tablet, and field-deployed tablets.
Having a 100% client-side execution eliminates server costs, and enables efficient offline use in biological field settings.
File I/O
BickGraphing’s file I/O supports multi-file drag-and-drop workflows through the FileSelector, which passes selected .wav files to the central Graph component. Duplicate detection, drag-reordering and state management are managed in FileList, enabling users to visualise multiple audio recordings simultaneously. Loaded files are automatically decoded with AudioContext (Web Audio API) and visualised, requiring no additional user input between file selection and display [2].
Client-side signal processing
BickGraphing performs all audio decoding and analysis in the browser (Figure 2). It uses a dual-decoding strategy that combines the native Web Audio API with ffmpeg.wasm, a WebAssembly port of FFmpeg, to decode each file into raw digital audio samples, represented as normalized floating-point values in Mono PCM (Pulse Code Modulation), for optimal performance and precision [3, 4]. ffmpeg.wasm was chosen over the original C/C++ FFmpeg distribution because it runs natively in the browser; while ffmpeg.wasm typically requires an internet connection to load its binaries, BickGraphing configures it to reference local binaries instead, enabling offline use without server-side processing.
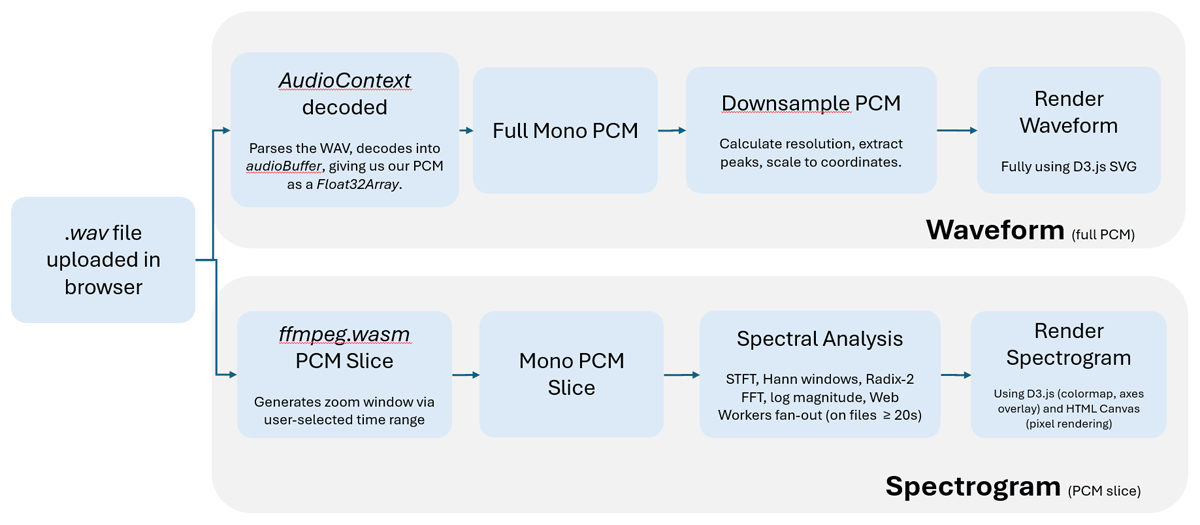
Figure 2
Client-side signal processing pipeline. The .wav file is decoded via two parallel paths: AudioContext decodes the full file for waveform generation, while ffmpeg.wasm slices a user-selected time window for spectrogram computation via Radix-2 FFT with an optional pool of Web Workers for files longer than 20 seconds.
Waveform Generation: Native AudioContext Decoding
The Web Audio API’s AudioContext.decodeAudioData() method provides rapid full-file access to PCM audio data when a user uploads a .wav file, decoding it into an AudioBuffer where getChannelData(0) extracts the mono PCM stream as a Float32Array normalized between –1 and 1. Processing and downsampling the PCM results in the final rendered waveform [2].
The Web Audio API was chosen for its asynchronous non-blocking execution on a dedicated audio thread, and hardware-accelerated decoding; the API delivers sub-second performance for >10-minute recordings across all major browsers, roughly 95% of the global share. This zero-configuration, standards-compliant implementation requires only a modern browser and no external JavaScript dependencies, making it ideal for generating initial waveform overviews that enable rapid navigation through long environmental recordings [2].
Spectrogram Generation: ffmpeg.wasm slicing & STFT Generation
FFmpeg.wasm extracts frame-accurate time windows from the original .wav file into mono F32LE raw PCM using the command -ss <start_time> -t <duration>. This delivers sub-millisecond slicing precision that reduces memory usage by 90%. This approach was chosen over AudioContext slicing due to its frame accuracy, robust .wav file support, and memory efficiency for Short-Time Fourier Transform (STFT) input, which enables precise and efficient spectrogram inspection of audio signals that would be impractical with browser PCM slicing alone [4]. This on-demand approach powers detailed spectral analysis of specific time regions without loading entire recordings into memory, saving significant processing time.
Spectral Analysis: Custom STFT Generation
Our STFT implementation converts overlapping audio frames to a time-frequency representation using 2048-sample Hann windows (sliding every 1024 samples = 50% overlap) across the ffmpeg.wasm PCM slice. Each window is processed via a Radix-2 Cooley-Tukey FFT, reducing per-window operations from O(N2) to O(N log N), approximately 186 times fewer operations at the 2048-sample window size used. Frames are stacked into a 2D magnitude grid spanning time and frequency axes (0–22 kHz Nyquist range).
For files longer than 20 seconds, STFT computation is distributed across parallel Web Workers, one per logical CPU core via navigator.hardwareConcurrency using zero-copy transferable buffers and progress updates posted every 500 frames [5]. Files shorter than 20 seconds are processed on the main thread, as worker startup overhead outweighs the parallelism benefit below this threshold.
The spectrogram heatmap is rendered by mapping the log(1+magnitude) compressed magnitudes to a 256-entry D3.js (D3) Turbo colour scheme (blue = low, red = high), clearly distinguishing sharp insect harmonics from broadband environmental noise (Figure 3). D3 was selected over WebGL due to its mature ecosystem and straightforward integration with the SVG overlay. Because D3 does not include a native spectrogram pixel renderer, pixel data is written directly to an HTML Canvas via a single putImageData() call, with D3-driven axes, title, and legend rendered as an SVG overlay on top. This hybrid Canvas and SVG approach replaced an earlier SVG rect-based renderer that generated up to 19.5 million DOM nodes for a 442-second file. The spectrogram can be exported as a PNG, JPEG, or SVG, with SVG export embedding the heatmap as a base64 PNG image. A debounce gate (400 ms idle, 1000 ms busy) and an AbortController-based preemptive rerun mechanism prevent redundant computation during rapid slider adjustments.
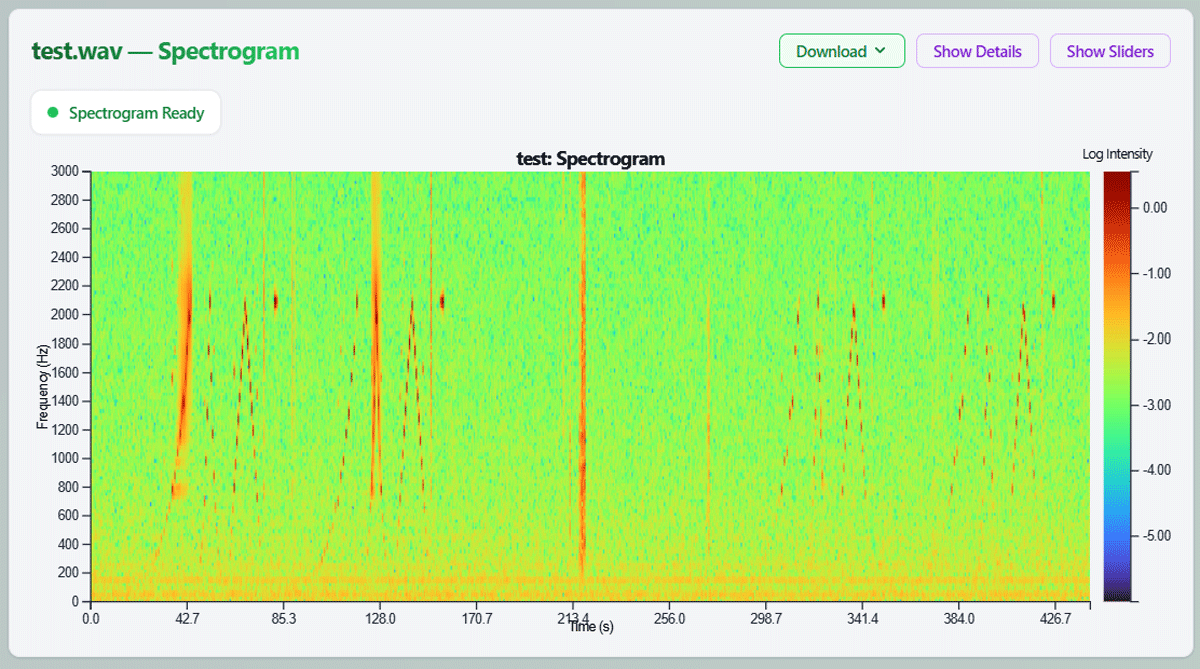
Figure 3
Spectrogram heatmap generated from test.wav in BickGraphing, showing time on the x-axis, frequency from 0–3000 Hz on the y-axis, and a log-intensity colour scheme legend on the right. The interface includes interactive controls and a “Spectrogram Ready” status indicator.
This dual-path architecture arose from a practical limitation: ffmpeg.wasm alone produced static, memory-intensive visualisations without interactivity. The Web Audio API was introduced to provide interactive, real-time waveform exploration natively in the browser with no additional dependencies. Audio is processed in buffered chunks to significantly reduce memory usage. The Web Audio API enables rapid full-file waveform navigation, while ffmpeg.wasm precision slicing powers detailed spectral zooms. Together, they deliver sub-second file previews and frame-accurate spectrogram inspections entirely on the client side. Running this signal-processing pipeline on the client reduces server requirements, enables offline field use, and avoids transferring large audio files over unreliable networks, a critical advantage for deployments in the field.
User interface components and layout
BickGraphing’s Svelte-based interface orchestrates signal processing and visualisation through modular components managed by the Graph component (Figure 4). Key features:
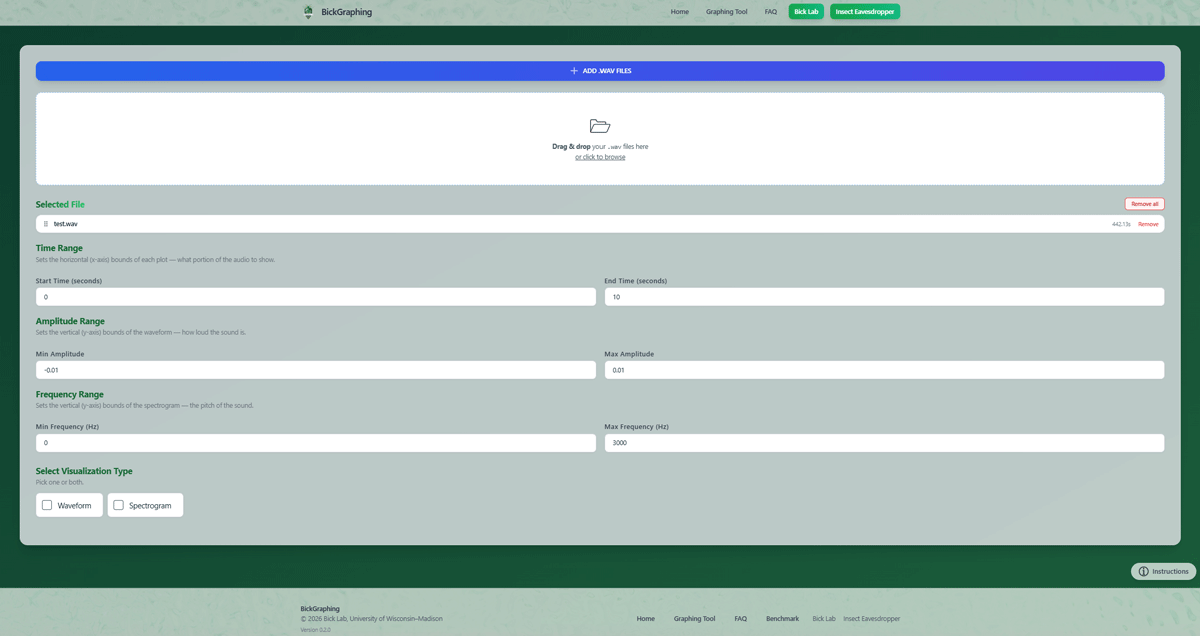
Figure 4
BickGraphing UI component layout showing the central Graph component managing file management, view control, global time, amplitude, frequency controls, and main visualisation components.
File Management (Multi-File Workflow)
FileSelector enables drag and drop uploads with duplicate filtering (processFiles()), while FileList supports drag-reordering (handleReorder) and per-file removal (removeFile()).
RangeInput global controls are synchronised across files via dedicated change handlers for time, frequency, and amplitude ranges.
Files exceeding 60 minutes trigger a long-duration warning (wavHeader.ts), advising users that processing time will be substantially longer due to browser decodeAudioData memory constraints.
View Control (Waveform/Spectrogram Toggle)
ViewSelector toggles visualisation modes via independent toggle buttons (Waveform and Spectrogram).
Miniwaveform thumbnails render in a responsive four-column grid for rapid multi-file scanning and selection.
Main Visualisation (Interactive Graphs)
Waveform renders an SVG line plot from waveformDataMap (downsampled to a max of 5000 points regardless of clip length). Time and amplitude axes are controlled by adjacent RangeSlider widgets and text inputs, via handleTimeChange() and handleAmpChange(), paired with RangeInput fields for global numeric entry. downloadWaveform() exports the plot as SVG, PNG, or JPEG.
Spectrogram renders an STFT heatmap as a hybrid Canvas and SVG overlay. Magnitude values are mapped through a 256-entry D3 Turbo colour scheme and painted to the Canvas via putImageData(), while D3-rendered axes, title, and gradient legend are drawn as an SVG overlay above the heatmap. Magnitudes are log-scaled (log10(|X[k]|)); the colour domain automatically scales to the visible window. The frequency and time ranges are controlled by RangeSliders through handleFreqChange() and handleTimeChange().
STFT is computed using Radix-2 FFT (fft.ts) and is handled by a pool of Web Workers (stft.worker.ts) for files exceeding 20 seconds, or on the main thread for shorter clips. A progress bar updates every 500 frames during STFT computation through PROGRESS messages posted by each worker. A “Spectrogram Ready” status indicator confirms when rendering is complete.
downloadSpectrogram() exports the spectrogram as SVG (with the canvas heatmap embedded as a base64 PNG image), PNG, or JPEG.
ToggleButton reveals optional UI elements including “Show Details” for file metadata and “Show Sliders” for the per-axis range controls. A separate “Reset Changes” button restores all sliders to their default values.
BickGraphing prioritises non-technical users through frictionless UX and real-time feedback. Drag and drop file processing streamlines inputs (FileSelector), progressive disclosure hides complex details by default (ToggleButton), and slider updates deliver sub-second results, all within an offline environment. Together, these features take users from file drop to actionable insights in seconds with no technical expertise required. Interactive elements throughout the interface include ARIA labels to support screen reader accessibility, broadening access for users with visual impairments.
Quality control
A test suite implemented with Vitest (src/lib/__tests__/) validates the core signal-processing pipeline across five layers: unit tests, integration tests, reference implementation parity tests, waveform data tests, and .wav file header tests (40 tests across six test files, 39 passing and one documented expected failure, completing in approximately seven seconds). Unit tests (fft.unit.test.ts) confirm that the Hann window function produces mathematically correct values: zero at endpoints, peak near one, and sum equal to N/2. Integration tests (stft.integration.test.ts) exercise the full STFT pipeline on synthetic signals with known spectral structure; a 440 Hz sine wave is verified to produce peak magnitude at the expected frequency bin (bin 20) in every frame with energy exceeding the noise floor by a factor of 100, and additional tests cover edge cases including near-Nyquist frequency detection and empty or short input handling. Parity tests (librosa.parity.test.ts) validate bin-for-bin numerical agreement against librosa, a widely used Python reference implementation for audio research [6], using identical parameters (n_fft = 2048, hop_length = 1024, Hann window). Agreement is confirmed within 1% of per-frame peak magnitude across five signal classes: a stationary 440 Hz tone, non-stationary frequency sweeps at two durations (10 and 60 seconds), and broadband white noise. Waveform data tests (waveformData.unit.test.ts, waveformData.integration.test.ts) cover the waveformData.ts utility across 20 unit tests, validating output length, time-range correctness, and edge cases including zero-length inputs and out-of-range boundaries. Reference fixtures span seven durations (1, 10, 60, 600, 1800, 3600, and 7200 seconds) across three signal types (sine, sweep, noise), stored in the repository for reproducibility (tests/fixtures/). The test suite can be run via npm test.
A dedicated benchmarking route (/benchmark, https://bicklabuw.github.io/BickGraphing/benchmark) sweeps audio lengths from 5 to 2700 seconds, comparing main-thread versus Web Worker STFT performance and rendering results as a D3 line plot (Figure 5) and downloadable Markdown table. Empirical calibration via this route identified 20 seconds as the crossover threshold below which Web Worker overhead exceeds the parallelism benefit (Table 2); files shorter than 20 seconds are therefore processed on the main thread, while longer files are dispatched to a worker fan-out, yielding optimal throughput across the full range of supported audio lengths.
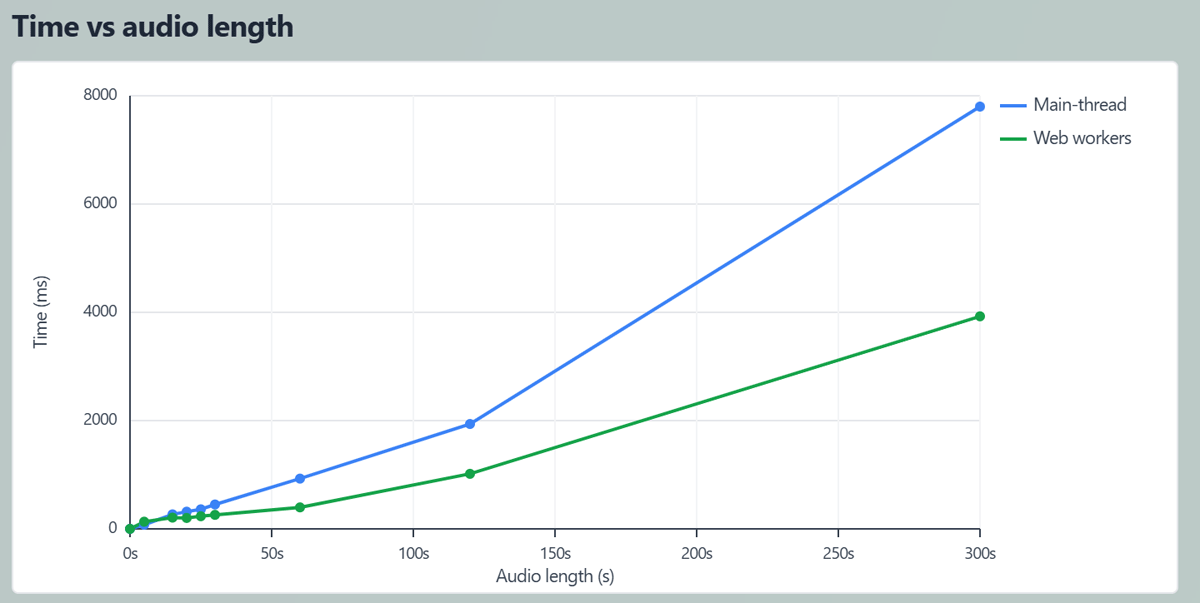
Figure 5
STFT computation time versus audio length comparing main-thread and Web Worker execution. The lines diverge at approximately 20 seconds, with Web Workers reducing computation time by approximately 50% at 300 seconds (4,654 ms versus 1,423 ms), identifying the empirical threshold below which Web Worker startup overhead exceeds the parallelism benefit.
Quality gates run automatically via GitHub Actions (ci.yml) on every push to main and every pull request, running ESLint linting, TypeScript type-checking, and a full production build in parallel on Ubuntu with Node.js 20.19. Deployment to GitHub Pages is triggered manually via the Actions tab (deploy.yml), making the application available at https://bicklabuw.github.io/BickGraphing/. The original GitLab deployment remains accessible at https://ie-graphing-709865.pages.doit.wisc.edu. A test.wav file is included for users to verify correct operation by confirming that waveform and spectrogram plots appear as expected (Figure 6).
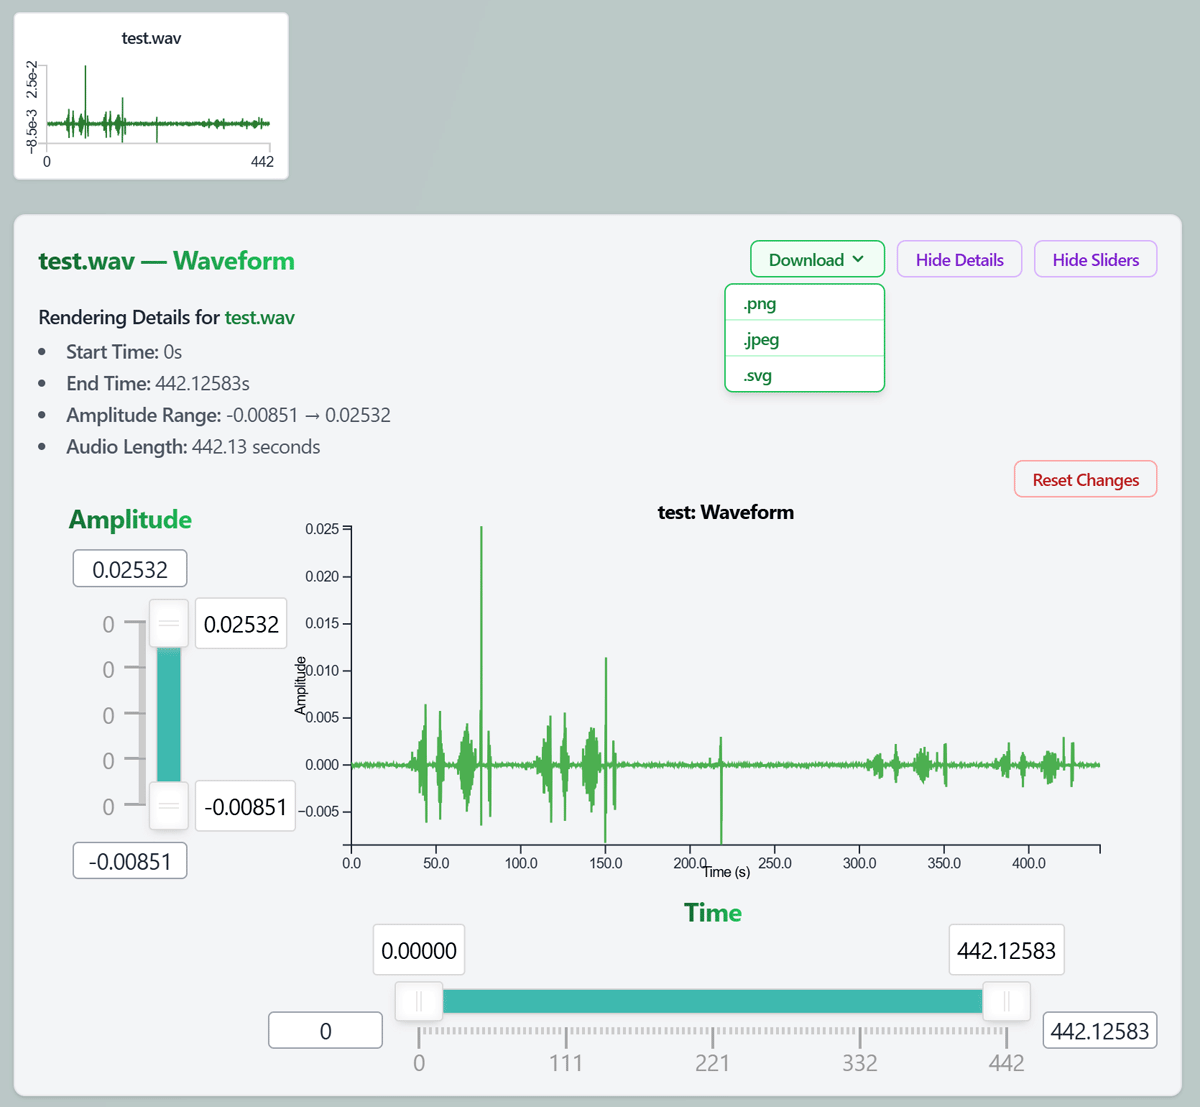
Figure 6
BickGraphing waveform view of test.wav (442 seconds) showing insect vibrational events as amplitude spikes concentrated between 30 and 160 seconds, with MiniWaveform thumbnail and interactive amplitude and time range sliders.
Fixture generation scripts and detailed instructions for regenerating reference data, extending the test suite, and troubleshooting parity failures are documented in the repository’s tests directory (tests/README.md).
(2) Availability
Operating system
Linux, Windows, and macOS systems running a modern WebAssembly-enabled browser; development and testing have focused on Ubuntu 22.04 and Windows 11.
Programming language
TypeScript (tested with TypeScript ≥ 5.x) using the Svelte and SvelteKit frameworks, built with Vite (≥ 6.x) and Node.js 20.19 or later for development and tooling.
Additional system requirements
BickGraphing runs entirely client-side: no audio is transmitted to a server, making it suitable for privacy-sensitive recordings. The application requires a modern browser supporting WebAssembly [7], Web Workers with transferable ArrayBuffers [8], AudioContext [3], Canvas 2D [9], and ResizeObserver [10]; compatible browsers include Chromium-based browsers (version 90 or later), Firefox (version 90 or later), and Safari (version 15 or later). For shorter recordings (up to 60 minutes), the application runs efficiently on low-powered devices including tablets and smartphones. For longer recordings, memory requirements scale with file duration and vary by system and browser, but are typically around the uncompressed .wav file size (476 MB of RAM per hour of mono 24-bit 44.1 kHz audio). Peak usage briefly exceeds this during decoding due to intermediate buffer allocation. Longer files may encounter browser decodeAudioData memory limits; an in-app warning is displayed for files approaching this threshold. No specialised hardware is required for typical research use cases (recordings up to 60 minutes).
Dependencies
BickGraphing is implemented in TypeScript with SvelteKit and relies on the following main packages.
Core framework and tooling
Svelte 5.0.0 or later
@sveltejs/kit 2.16.0 or later
@sveltejs/adapter-static 3.0.10 or later
@sveltejs/vite-plugin-svelte 5.0.0 or later
@sveltejs/adapter-auto 4.0.0 or later
Vite 6.0.0 or later
Styling
Tailwind CSS 3.4.17 or later
@tailwindcss/forms 0.5.9 or later
@tailwindcss/typography 0.5.15 or later
@tailwindcss/vite 4.0.0 or later
PostCSS 8.5.3 or later
autoprefixer 10.4.21 or later
Audio processing
@ffmpeg/core 0.12.6 or later
@ffmpeg/ffmpeg 0.12.15 or later
@ffmpeg/util 0.12.2 or later
Visualisation and interaction
D3 7.9.0 or later
@types/d3 7.4.3 or later
nouislider 15.8.1 or later
svelte-dnd-action 0.9.61 or later
Development and quality tools
TypeScript 5.0.0 or later
svelte-check 4.0.0 or later
ESLint 9.18.0 or later, with eslint-config-prettier 10.0.1 or later and eslint-plugin-svelte 3.0.0 or later
@eslint/compat 1.2.5 or later
@eslint/js 9.18.0 or later
globals 16.0.0 or later
typescript-eslint 8.20.0 or later
Prettier 3.4.2 or later, with prettier-plugin-svelte 3.3.3 or later and prettier-plugin-tailwindcss 0.6.11 or later
cross-env 10.1.0 or later
gh-pages 6.3.0 or later
husky 9.1.7 or later
lint-staged 16.4.0 or later
Testing
Vitest 4.1.7 or later
@vitest/ui 4.1.5 or later
@types/node 25.6.0 or later
Python (fixture regeneration only, Install via pip install -r tests/requirements.txt command)
Python 3.11 or later
numpy 2.4 or later
scipy 1.17.1 or later
librosa 0.11.0 or later
Note: Exact dependency versions are pinned in the committed package-lock.json. Running npm ci reproduces the tested JavaScript environment exactly.
List of contributors
1. Seow, Kayley1
2. Arovas, Alexander2
3. Steinmetz, Grace1
4. Bick, Emily1
1Department of Entomology, University of Wisconsin-Madison
2Department of Biological Systems Engineering, University of Wisconsin-Madison
Software location
Archive
Name: Zenodo
Persistent Identifier: https://doi.org/10.5281/zenodo.20101607
Version published: 0.2.0
Licence: MIT
Publisher: Emily Bick
Date published: 10/05/2026
Code repository
Name: GitHub
Identifier: https://github.com/bicklabuw/BickGraphing/tree/main
Licence: MIT License
Date published: 14/01/2026
Language
The repository, software, and supporting files are in English.
(3) Reuse potential
BickGraphing was first designed for use with the Insect Eavesdropper acoustic sensor, which monitors plant vibroscapes for insect activity [11, 12, 13]. To date, the Insect Eavesdropper has been evaluated on twenty-seven insect species across multiple life stages on seventeen cropping systems by more than thirty academic and government researchers. This platform enabled users of the Insect Eavesdropper to quickly validate whether the device was active and functioning as expected; it also provided immediate visualisation of the plant vibroscapes. BickGraphing proved applicable for scientists working across systems in both laboratory and field settings.
BickGraphing’s performance derives from subsampling implemented in generateVisualizations(), which produces multi-file waveform previews, while live sliders enable sub-second re-renders even for recordings exceeding 30 minutes. The web platform removes coding barriers for audio data visualisation. Completely offline and browser-based with a modest memory footprint, BickGraphing delivers quick, portable audio data viewing.
Several established tools exist for audio visualisation and analysis (Table 1). Audacity is the most widely adopted open-source audio editor [14]. Sonic Visualiser is an open-source desktop application designed for signal-processing researchers [15]. librosa is a widely cited Python library providing signal-processing functions for audio research [6]. Raven Pro, from the K. Lisa Yang Centre for Conservation Bioacoustics at Cornell University, is among the most widely used programs for bioacoustics analysis, cited in over 1,000 peer-reviewed publications [16]. BickGraphing matches these tools in core visualisation capabilities, including waveform and spectrogram display, multi-file handling, and export functionality.
Table 1
BickGraphing Feature Comparison versus Leading Audio Research Tools.
| FEATURE | BICKGRAPHING | RAVEN PRO | AUDACITY | SONIC VISUALISER | LIBROSA | |
|---|---|---|---|---|---|---|
| Accessible Deployment | Browser-based (no install) | Yes | No | No | No | No |
| Field-portable (low compute) | Yes | No | No | No | No | |
| Mobile/tablet support | Yes | No | No | No | No | |
| Cost | Free | Paid | Free | Free | Free | |
| Coding required | No | No | No | No | Yes | |
| Licence | MIT | Proprietary | GPL-2.0+ | GPL-2.0 | ISC | |
| Offline capable | Yes | Yes | Yes | Yes | Yes | |
| Visualisation | Waveform display | Yes | Yes | Yes | Yes | Yes |
| Spectrogram display | Yes | Yes | Yes | Yes | Yes | |
| Multi-file batch viewing | Yes | Yes | Limited | Separate | Scripted | |
| SVG export | Yes | Yes | Yes | Yes | Yes | |
Table 2
BickGraphing STFT Benchmark: Main-thread versus Web Worker computation time at selected audio lengths.
| LENGTH (s) | FRAMES | MAIN-THREAD (ms) | WEB WORKERS (ms) | SAVED (ms) |
|---|---|---|---|---|
| 5 | 214 | 68 | 132 | –64 |
| 15 | 644 | 207 | 185 | 22 |
| 20 | 860 | 273 | 212 | 61 |
| 22 | 946 | 284 | 227 | 57 |
| 24 | 1032 | 303 | 243 | 60 |
| 25 | 1075 | 318 | 222 | 96 |
| 30 | 1290 | 387 | 261 | 126 |
| 60 | 2582 | 763 | 351 | 412 |
| 120 | 5166 | 1493 | 681 | 812 |
| 300 | 12918 | 4654 | 1423 | 3231 |
However, these tools differ substantially in their accessibility and deployment requirements. Existing solutions typically require software installation, coding knowledge, or paid licensing, and are primarily designed for desktop environments. In contrast, BickGraphing is uniquely positioned across all accessibility and deployment criteria: it is browser-based with no installation required, field-portable with low computational overhead, compatible with mobile and tablet devices, and freely available. To our knowledge, it is the only tool among those compared that satisfies all these criteria simultaneously.
BickGraphing was intentionally designed to address this gap. Rather than replicating the full feature sets of existing platforms, we prioritised rapid, low-friction exploratory analysis in field and resource-constrained environments, deliberately excluding features such as audio editing, plugin systems, and scripted analysis pipelines. Through iterative development and user interviews conducted as part of the Insect Eavesdropper project, we identified immediacy, portability, and ease of use as primary requirements. While advanced features such as annotation and playback were identified as valuable additions for future development, the current system is optimised for fast visual validation of recordings in situ.
BickGraphing can be reused by researchers who need fast visual inspection of .wav recordings across many domains. Current pest monitoring technologies, such as image traps, pheromone lures, IoT sensors, and drones, typically demand connectivity, specialised equipment, or complex processing pipelines [17, 18, 19]; BickGraphing complements these approaches by providing acoustic monitoring without additional connectivity or equipment requirements. Beyond insect bioacoustics, potential applications include wildlife and conservation bioacoustics, where scientists routinely scan spectrograms of long Passive Acoustic Monitoring (PAM) recordings to locate bird, bat, and amphibian calls [20]. Birdsong and speech researchers similarly use waveform and spectrogram views to assess articulation, call structure and quality [20]. Other applications include urban noise studies for inspecting traffic peaks or engineering vibration and noise profiling for machinery health assessment [21, 22, 23].
The modular Svelte and WASM architecture of BickGraphing allows it to be extended in several ways: developers can swap in different FFT parameters or window functions via fft.ts, adjust the Web Worker threshold or worker count, add new visualisations (for example multichannel or falsecolour spectrograms), or integrate annotation and export tools that feed into downstream machinelearning pipelines.
The code for BickGraphing is publicly available and documented at Bick Lab’s GitHub Repository (https://github.com/bicklabuw/BickGraphing/tree/main), maintained under the MIT Licence. Bug reports and feature requests can be submitted directly via the repository’s GitHub Issues page (https://github.com/bicklabuw/BickGraphing/issues). Users are also welcome to contact the authors to discuss specific application possibilities at ebick@wisc.edu.
Acknowledgements
Authors would like to thank Bick Lab Members Carmen Meyers, Dr. Mia Phillips, Raghav Jindal, and Praneet Popuri for their assistance in evaluating the BickGraphing Platform. We would also like to thank Dr. Kelsey Fisher (Connecticut Agricultural Experiment Station) and Dr. Dominic Reisig (North Carolina State University) for beta testing the program.
Author Contributions
K. Seow: Data Curation, Formal Analysis, Software, Validation, Visualisation, Writing – Original Draft Preparation, Writing – Review & Editing.
A. Arovas: Conceptualization, Data Curation, Methodology, Project Administration, Software, Supervision, Validation, Writing – Original Draft Preparation, Writing – Review & Editing.
G. Steinmetz: Conceptualization, Data Curation, Methodology, Software, Validation, Visualisation, Writing – Review & Editing.
E. Bick: Funding Acquisition, Project Administration, Resources, Supervision, Validation, Writing – Original Draft Preparation, Writing – Review & Editing.