
Figure 1
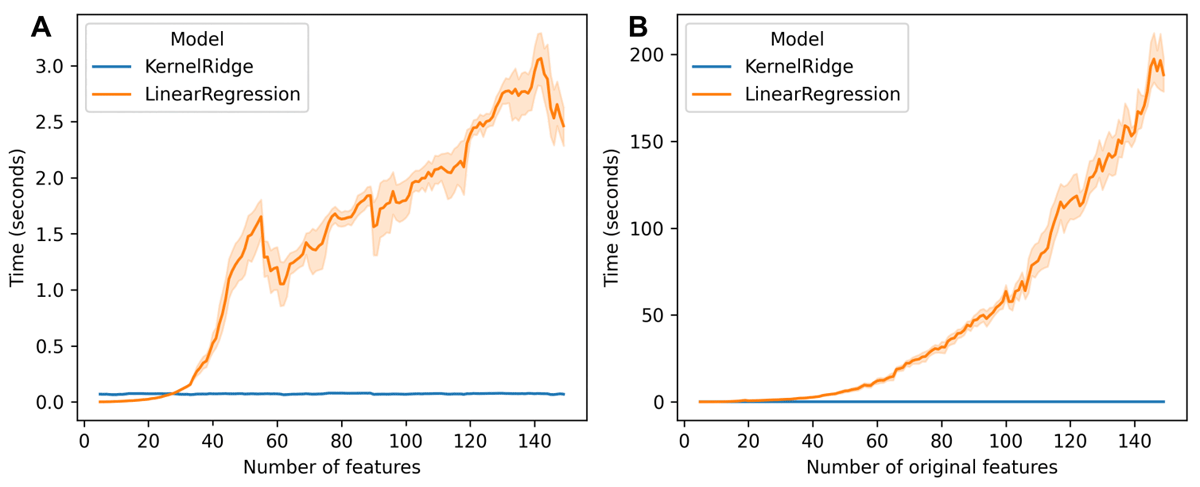
The performance of scikit-learn’s KernelRidge models against LinearRegression models with polynomially expanded features. A batch of 1,000 samples were generated to contain each number of features in turn, with target variables calculated according to Friedman’s 5-variable function (equation 61 in (9)), and random Gaussian noise added with a standard deviation of 0.5. The different models were then trained on the data and CPU time was measured using the Python time library’s process_time function. This was repeated 10 times for each number of features. The Nextflow workflow and Python scripts used to record the times are included in the GitHub repository along with the raw data. Times were recorded on the Norwich BioScience Institutes’ High Performance Computing cluster, on x86 Intel Xeon architecture using the avx2 instruction set. A: A comparison of a KernelRidge model with a polynomial kernel of degree 2 trained on the original data (blue) and a LinearRegression model, trained on the data explicitly mapped into polynomial feature space with degree 2 (orange). B: A comparison of a KernelRidge model with a polynomial kernel of degree 3 trained on the original data (blue) and a LinearRegression model, trained on the data explicitly mapped into polynomial feature space with degree 3 (orange).
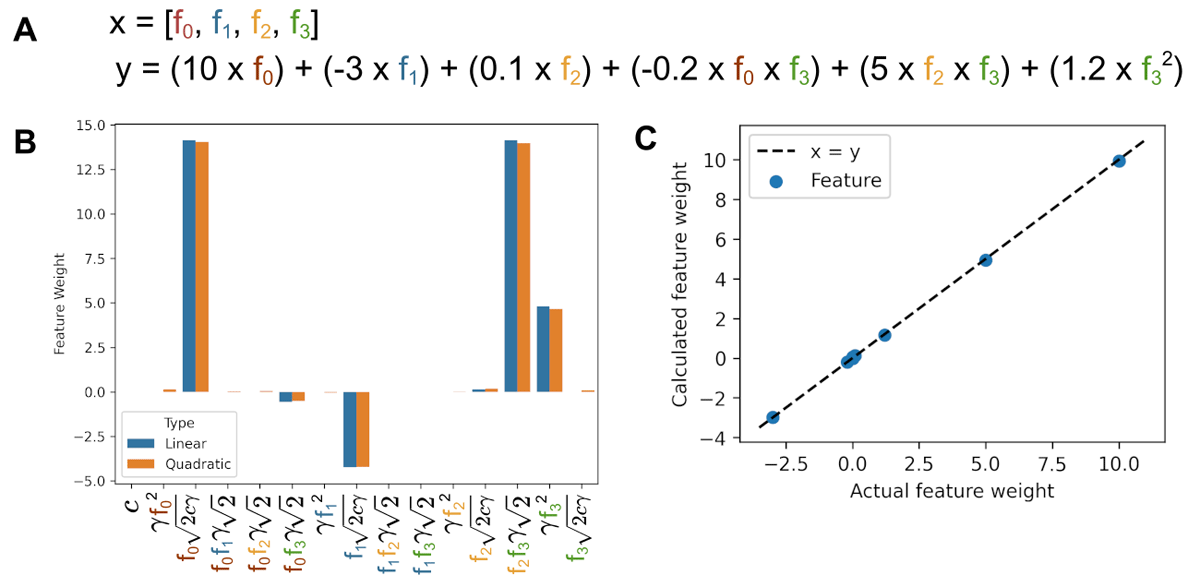
Figure 2
Visualization of the feature weights retrieved by KernelPopper. A: A description of generated data (four randomly generated features) and target variables (calculated from the data). B: The coefficients learned by a linear regression model trained on explicitly enumerated quadratic features (blue) and the feature weights learned by a quadratic KernelRidge model, calculated with KernelPopper (orange). The sign and magnitude of the feature weights learned are aligned with the underlying function (A) and consistent between models. C: The feature weights learned by the kernel ridge model, compared to the actual feature weights used to generate the data.