
Table 1
Comparison of the four deep learning models initially evaluated for object detection. Values are COCO-style metrics, i.e., mean Average Precision (mAP) and mean Average Recall (mAR) averaged over IoU thresholds from 0.50 to 0.95. The highest AP score is highlighted in bold. Data adapted from (7). These averaged scores differ from the single-threshold AP at IoU = 0.50 reported for the selected Faster R-CNN model in the Quality Control section.
| MODEL | mAP (IoU 0.50:0.95) | mAR (IoU 0.50:0.95) |
|---|---|---|
| Fast R-CNN | 0.950 | 0.572 |
| Faster R-CNN | 0.939 | 0.558 |
| RPN | 0.945 | 0.575 |
| RetinaNet | 0.243 | 0.264 |
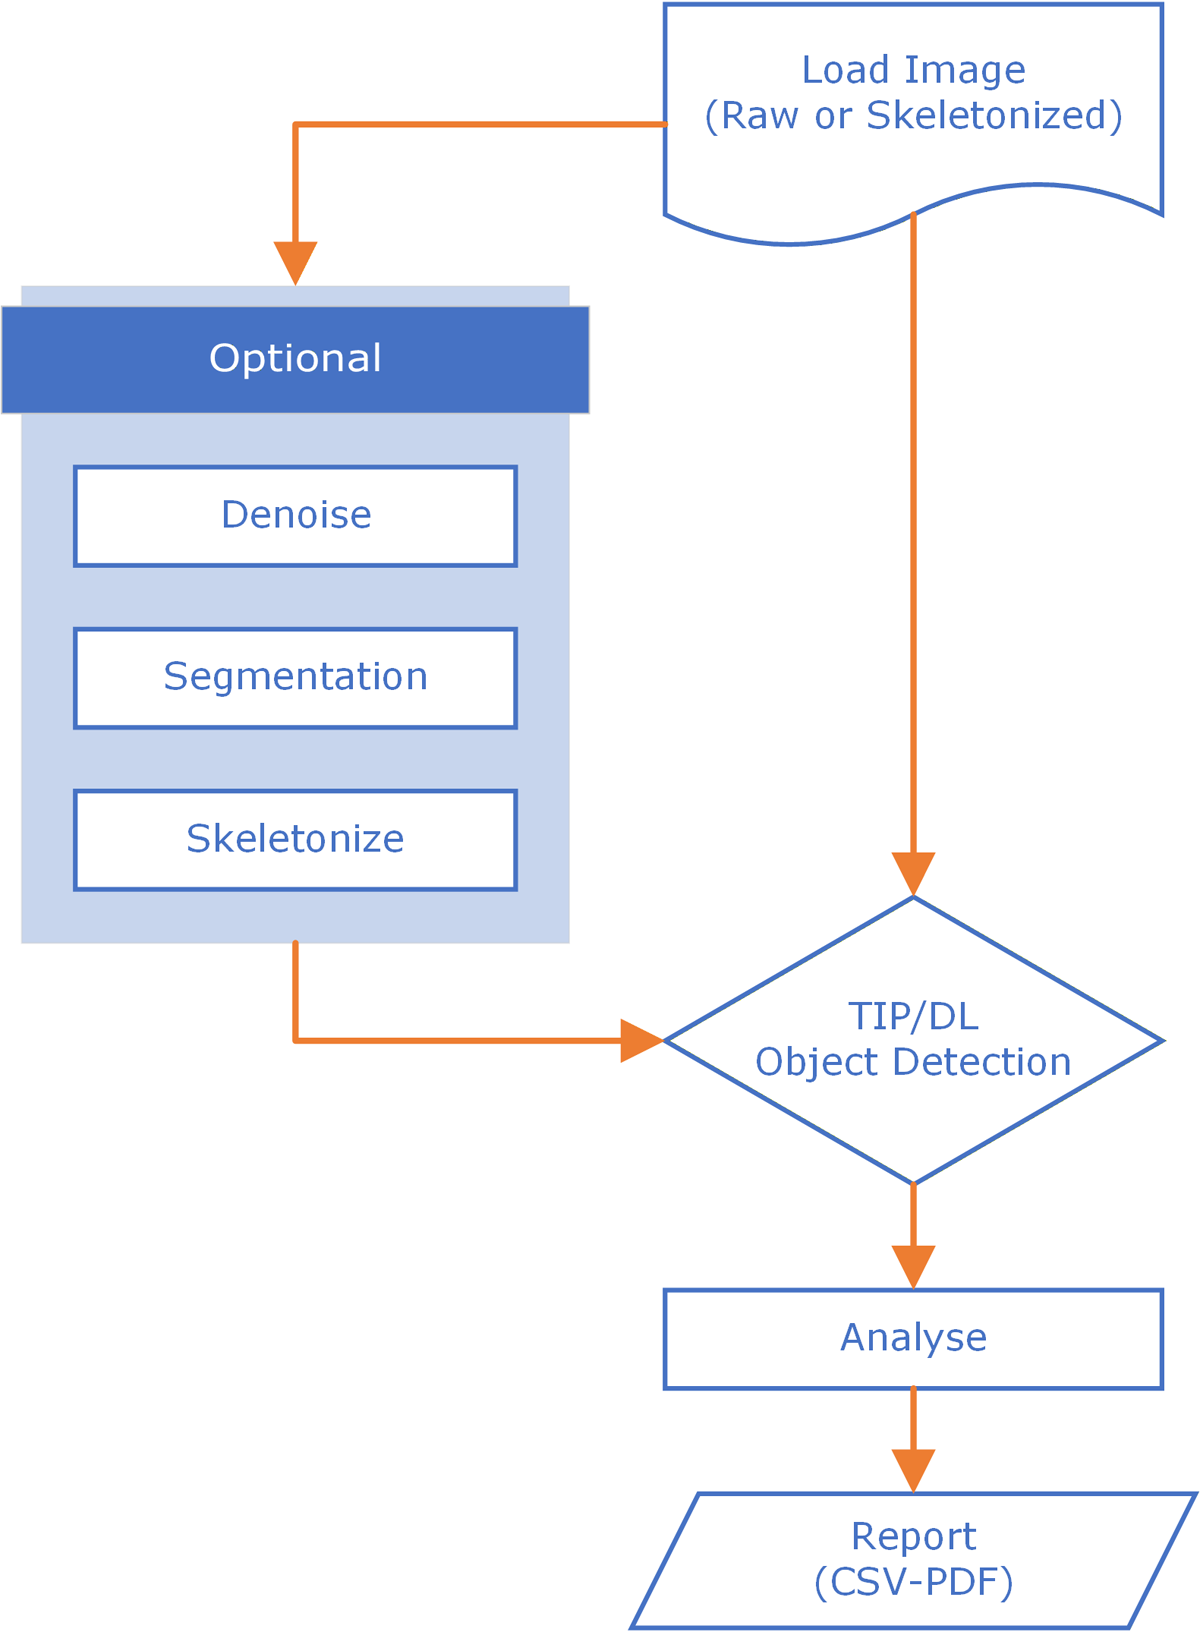
Figure 1
Software general workflow.
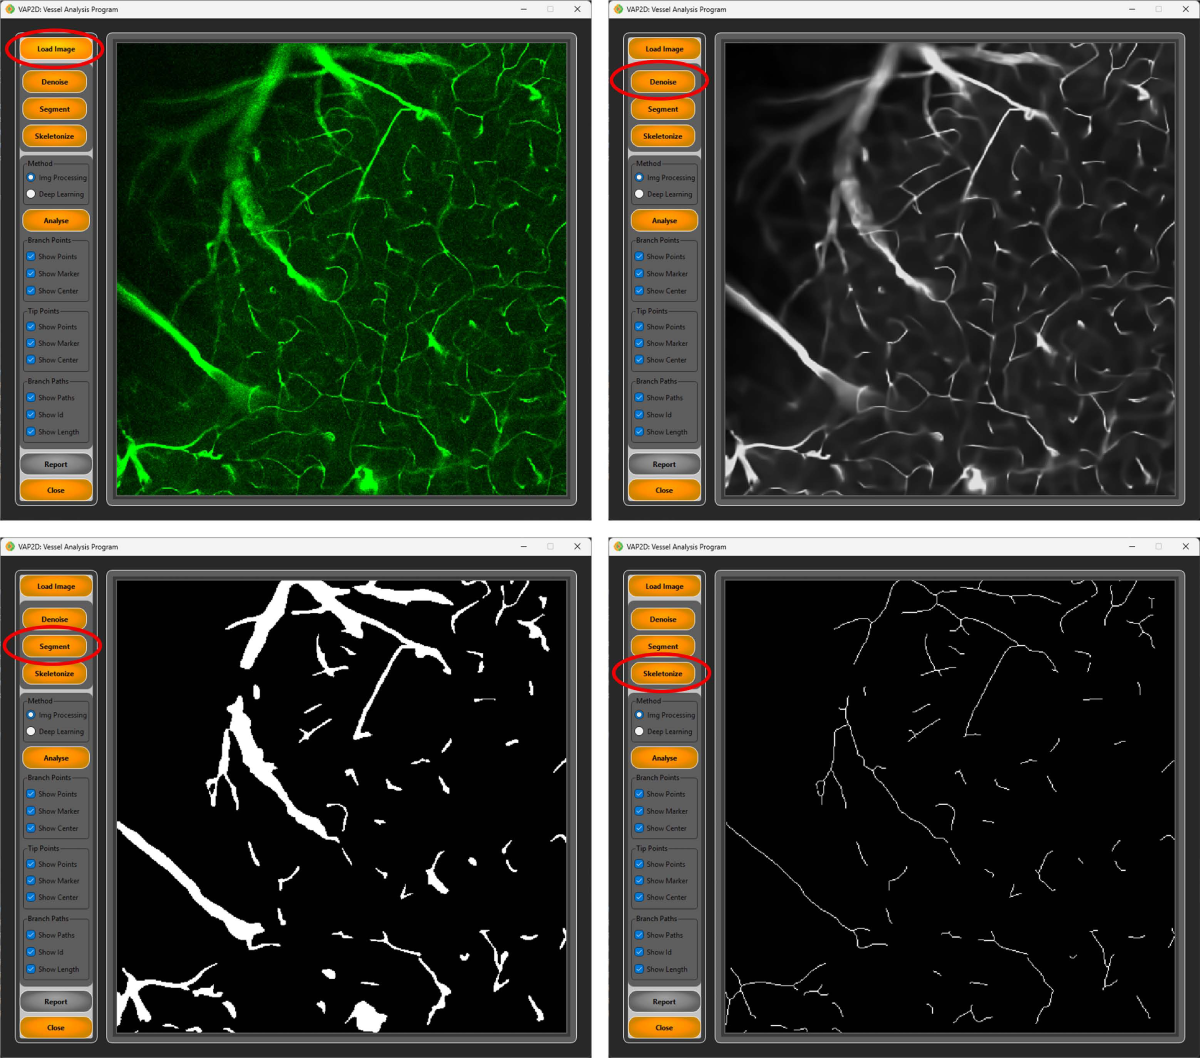
Figure 2
The process of uploading a raw image to the system and the subsequent pre-processing steps, shown left to right and top to bottom: (a) the raw input image as loaded, (b) the result after denoising, (c) the result after segmentation, and (d) the final skeletonized image used for analysis.
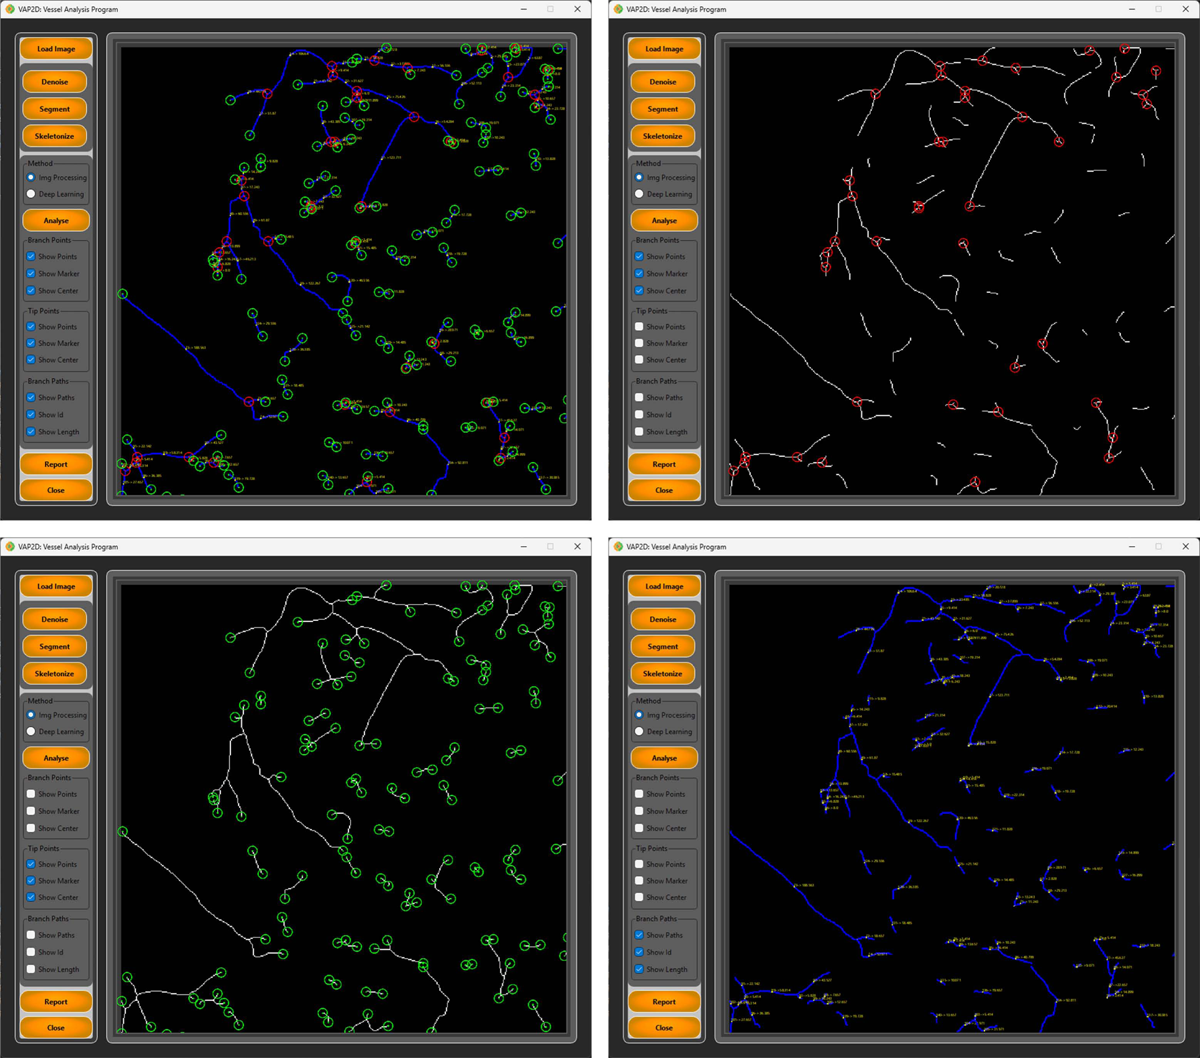
Figure 3
Screenshots of the analysis module showing detected vascular features: branch points (red circles), endpoints (green circles), vessel paths (blue lines), and length measurements (yellow labels). The left panel provides interactive controls to toggle the visibility of each feature type.
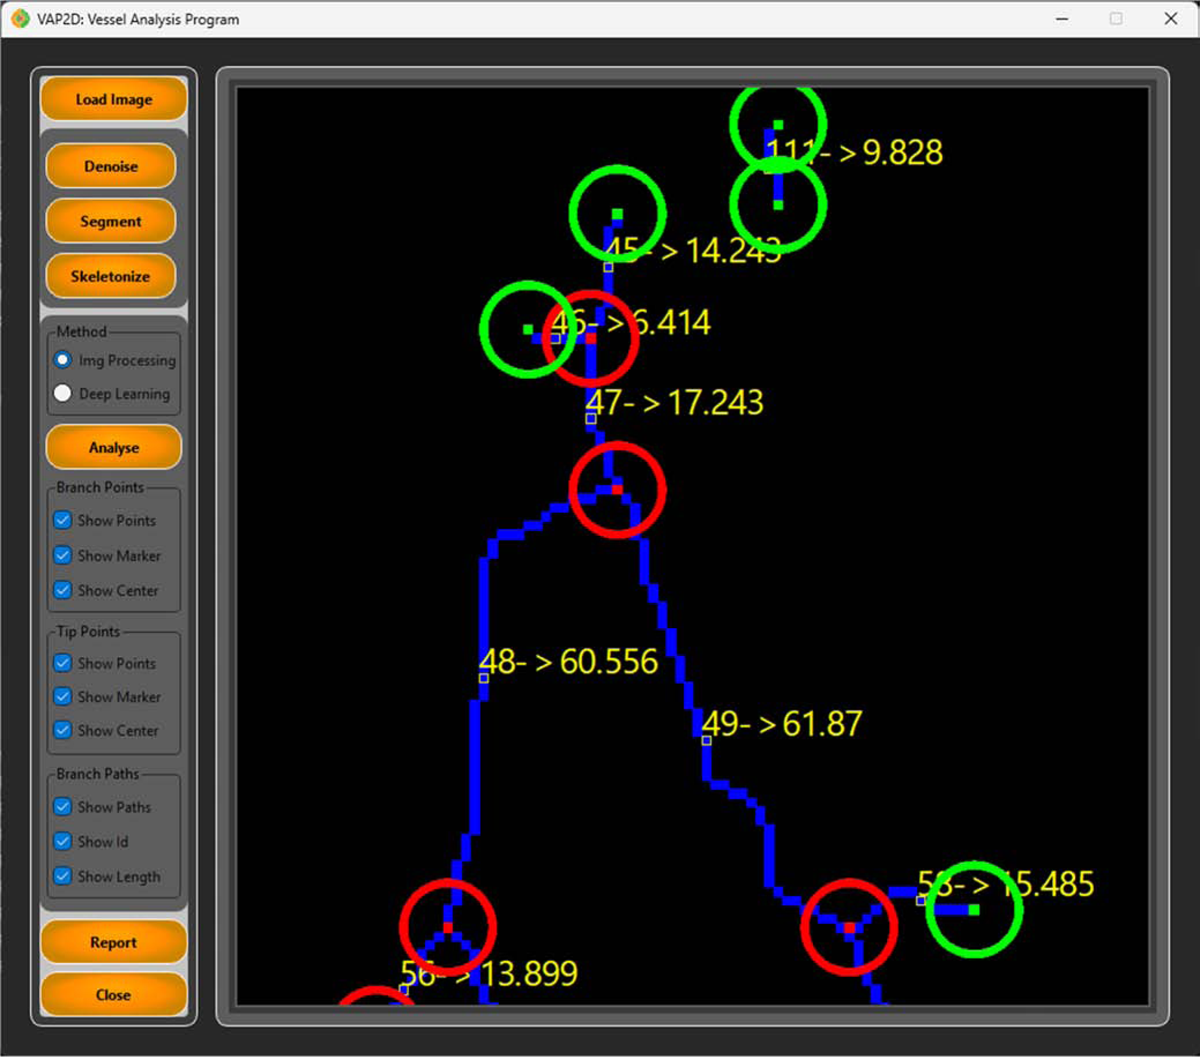
Figure 4
Zoomed-in detail view of the analysis module demonstrating the precise localization of branch points and endpoints. Branch points are indicated by red circles with center markers (small squares), while endpoints are marked with green circles. Yellow labels display branch segment IDs and their corresponding lengths in pixels (e.g., “103 → 24.899” indicates branch segment 103 with length 24.899 pixels).
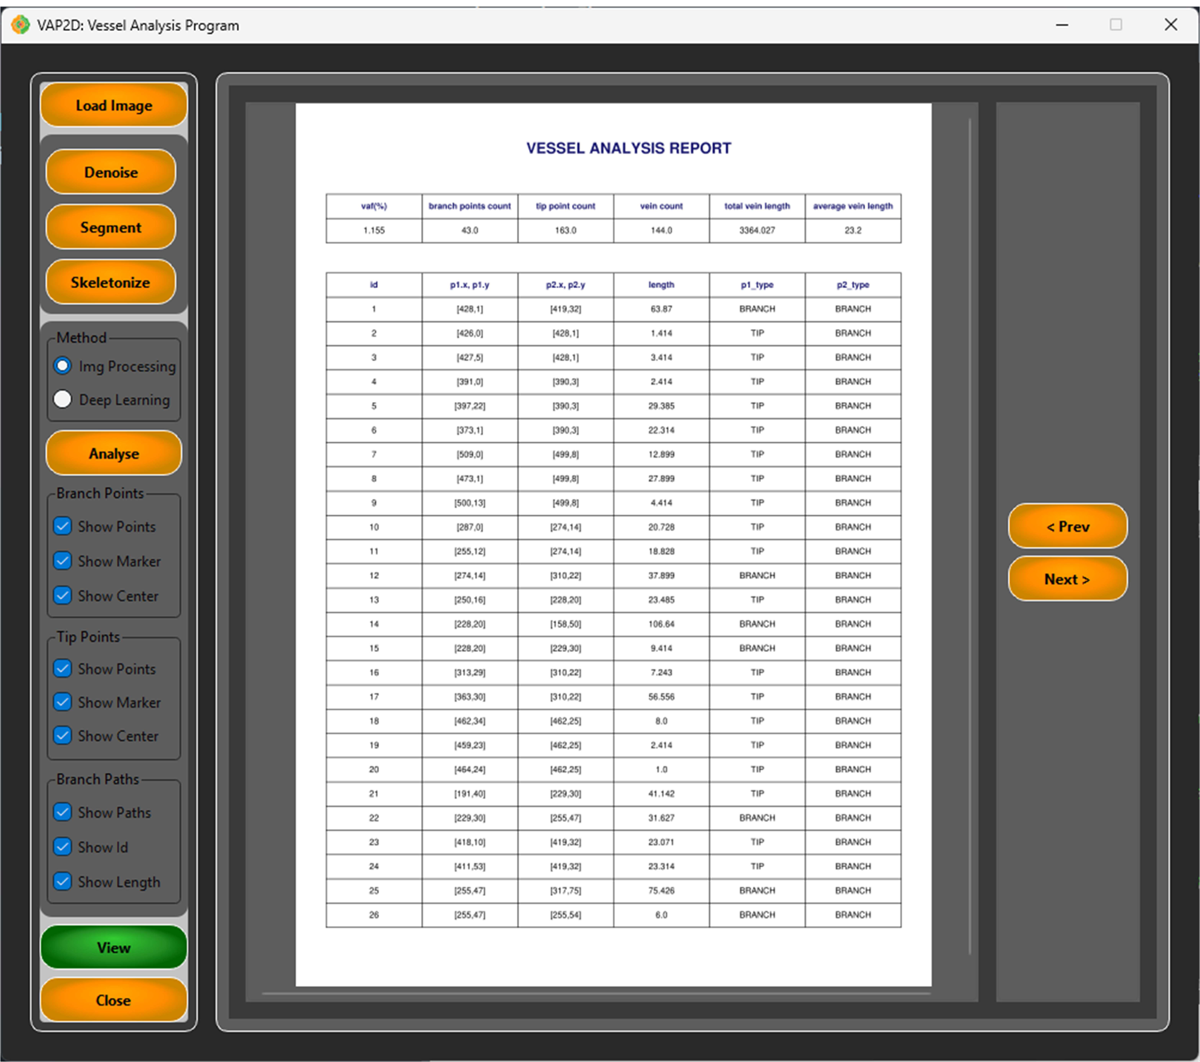
Figure 5
Report Screen.