
(1) Overview
Introduction
VAP2D (two-dimensional vessel analysis program) is an innovative solution to address the need for standardized quantitative analysis of vascular networks in medical imaging and biomedical engineering. Accurate and reproducible measurement of vascular morphology is a critical requirement that directly impacts clinical decision-making, particularly in the early diagnosis of vascular pathologies, optimization of treatment strategies, and tissue engineering applications. Considering the limitations of existing methods (e.g., the time-consuming nature of manual analysis, the error-proneness of traditional algorithms in complex branching), this software fills a significant scientific gap in the field by providing automated analysis of parameters such as branch points, endpoints, vessel length, and vessel densities, especially in 2D binary vessel skeleton images.
The software provides two different methods to detect branch points and endpoints: traditional image processing (TIP) and a deep learning (DL)-based model. This dual approach allows users to choose flexible solutions depending on the data type or image quality. Furthermore, the noise filtering, threshold segmentation, and medial-axis-transform-based skeletonization algorithm, integrated into the preprocessing stage, ensure high consistency in preparing raw images for analysis.
These operations are designed to optimize the software’s performance, especially in clinical data with low contrast or artifacts. The software’s scientific contribution stands out through its robust infrastructure for standardizing quantitative metrics and enabling data-driven decision support systems. For example, in studies investigating the correlation between micro-changes in retinal vascular density and the progression of diabetic retinopathy, or in histopathological analyses of tumor angiogenesis, the metrics produced by VAP2D can help elucidate pathophysiological mechanisms by providing data.
In preclinical studies, objective evaluation of the effects of experimental treatments on vascular regeneration is one of the software’s potential application areas. For experimental applications and use cases, VAP2D is designed with a modular architecture integrated with a graphical user interface (GUI). Users can interactively adjust pre-processing parameters (noise filter size, thresholding range) by uploading raw images (e.g., fundus photographs, micro-CT sections). The skeletonized outputs, branch points, and endpoints are automatically detected using either TIP or DL, as chosen by the user. The results of the analysis can be reported in CSV/PDF formats.
Several programs have been developed for vascular analysis, each with different features. AngioQuant (1), one of the first tools developed for this purpose, was designed in 2005 as a MATLAB-based tool to analyze tubule lengths and branching points in vitro angiogenesis assays. However, it has shortcomings, such as the need for manual segmentation and limited adaptation to image quality. In 2011, RAVE (2) introduced a new MATLAB-based framework for the rapid analysis of vascular networks, while AngioTool (3) was developed in Java, providing flexibility for vector field visualization and morphometric measurements.
A more recent solution, VascuVision (4), aimed at clinical integration with automatic segmentation and skeleton extraction features in CT/MR images. Similarly, Q-VAT (5), an open-source tool running on Fiji/ImageJ, facilitated detailed analysis of macro- and micro-vascular structures using a tile-wise method. REAVER (6), introduced in 2020, provided improved network topology analysis in high-resolution 2D vascular images, but its MATLAB dependency and complex setup processes limit its practical use.
The development of VAP2D originated from the idea of compiling our previous scientific research and delivering it to end-users through a dedicated program (7, 8). The primary motivation for this work was the need expressed by laboratory technicians for user-friendly software to perform vascular analysis. Existing solutions in the literature often present challenges, such as complex installation procedures, incompatibility issues due to outdated technologies, and difficulties performing desired operations, thereby hindering their usability. With VAP2D, we propose a more modern user-centric program that offers easy installation and use.
Implementation and Architecture
VAP2D is a desktop application developed using current software technologies and the latest scientific approaches. It provides users with a modern interface while performing vascular analysis using state-of-the-art scientific techniques. The program can operate independently without requiring additional software or dependencies, providing users with a simple experience.
Developed in Python, VAP2D utilizes the open-source PySide6 framework for its user interface. The interface integrates methods that meet users’ basic needs, such as noise removal, segmentation, and skeletonization. The analysis component presents details with greater clarity, including visualizations of vessel branches, endpoints, and lengths. Furthermore, all analysis results can be exported in CSV or PDF format, facilitating the user’s reporting process.
VAP2D performs object detection using TIP or DL techniques. Both techniques serve the same purpose; however, we offer both techniques in our application as options for the user. First, we used the TIP technique, applying specifically designed filters to the image spatially to detect branching points and endpoints. We targeted eight distinct branching points and sixteen endpoints. These filters, used in conjunction with the hit-or-miss algorithm (9), enabled the precise determination of the centers of the objects (10). On the other hand, in the DL-based object detection methodology, we labeled the objects detected by TIP using 5 × 5 bounding boxes in the COCO (Common Objects in Context) format, a widely used annotation standard for object detection tasks.
For the DL-based detection, we evaluated four different models: Fast R-CNN (Region-based Convolutional Neural Network), Faster R-CNN, RPN (Region Proposal Network), and RetinaNet. The performance of these models, previously detailed in our work (7), is summarized in Table 1 using COCO-style mAP averaged over IoU (Intersection over Union) thresholds from 0.50 to 0.95. While Fast R-CNN achieved the highest average AP of 0.950, we selected Faster R-CNN for integration into VAP2D due to its robust architecture and balanced precision-recall performance, which we deemed more suitable for our hybrid post-processing approach. Second, we significantly improved the precision of the chosen model through extensive hyperparameter optimization, as detailed in our subsequent study (8). This optimization was highly effective, improving the model’s AP score evaluated at the single threshold IoU = 0.50 from a baseline of 0.903 to 0.989—a performance increase of over 9.5%.
Table 1
Comparison of the four deep learning models initially evaluated for object detection. Values are COCO-style metrics, i.e., mean Average Precision (mAP) and mean Average Recall (mAR) averaged over IoU thresholds from 0.50 to 0.95. The highest AP score is highlighted in bold. Data adapted from (7). These averaged scores differ from the single-threshold AP at IoU = 0.50 reported for the selected Faster R-CNN model in the Quality Control section.
| MODEL | mAP (IoU 0.50:0.95) | mAR (IoU 0.50:0.95) |
|---|---|---|
| Fast R-CNN | 0.950 | 0.572 |
| Faster R-CNN | 0.939 | 0.558 |
| RPN | 0.945 | 0.575 |
| RetinaNet | 0.243 | 0.264 |
A key limitation of the standard DL model was its inability to pinpoint exact center locations within the generated bounding boxes. To overcome this, we developed a novel hybrid approach: we apply the morphological filters from our TIP method as a post-processing step on the DL-generated bounding boxes. This allows us to determine the precise centers of the objects, combining the robust detection of DL with the spatial precision of traditional methods. This integrated methodology, which forms the core of VAP2D’s DL module, leads to significantly more accurate and reliable results for subsequent length and density calculations.
We integrated this enhanced methodology into the VAP2D software as a DL method for detecting branching points and endpoints. This integration combines the strengths of both traditional and DL approaches, allowing us to achieve more accurate and reliable results.
The TIP method can be applied directly without requiring any additional processing. However, for the DL method, the images must be strictly in binary format, or the model must be retrained after labeling with TIP. If a re-trained model is provided, finding the center of branching and endpoints will be no issue. The training process, as detailed in our previous studies, serves as a guide for researchers. Complex processes, such as model training, have not been incorporated into the VAP2D software framework, thereby preserving the program’s integrity. This allows users to focus on basic analysis operations.
Input requirements and supported formats: VAP2D accepts two types of input images: (1) Raw vessel images—grayscale images (8-bit recommended) in common formats (TIFF, PNG, BMP, JPEG) that require the full pre-processing pipeline (denoising, segmentation, skeletonization) before analysis; and (2) Binary skeleton images—pre-skeletonized binary images where vessels are represented as single-pixel-wide lines, which can be directly analyzed without pre-processing. The software interface guides users through the appropriate processing steps based on the type of input image.
Pre-trained model and hardware requirements: VAP2D includes a pre-trained Faster R-CNN model (ResNet-50 backbone with Feature Pyramid Network) optimized for cerebral vessel images. As detailed in Table 1 and our previous work (8), this model achieved an average precision (AP) of 0.989 at IoU = 0.50 after hyperparameter optimization using Optuna—an improvement of over 9.5% from the baseline. The optimized hyperparameters are: a base learning rate of 0.01, a maximum of 10,000 iterations, and a batch size of 128 per image. This model is ready for immediate use without additional training. For datasets with significantly different characteristics (e.g., retinal vessels or tumor vasculature), users may retrain the model using standard Detectron2 workflows. The DL module can operate on both CPU and GPU; an NVIDIA GPU with CUDA 11.8+ is recommended for faster inference (approximately 150 ms per 512 × 512 image).
Retraining on custom datasets: Users working with imaging modalities that differ substantially from cerebral confocal images (e.g., retinal fundus photographs or tumor micro-vasculature) can adapt the detection model using the standard Detectron2 pipeline. The recommended workflow is: (1) collect the target images and, where required, binarize them using the same pre-processing pipeline provided by VAP2D (denoising, segmentation, skeletonization); (2) generate branch-point and endpoint annotations—either automatically with the built-in TIP (Hit-or-Miss) detector, which exports 5 × 5 bounding boxes, or by manual labeling—and store them as a COCO-format JSON file; (3) split the data into training and test sets and register both with Detectron2’s DatasetCatalog and MetadataCatalog; (4) configure a Faster R-CNN model (ResNet-50 backbone with Feature Pyramid Network), using the optimized hyperparameters reported above (base learning rate 0.01, up to 10,000 iterations, batch size 128 per image) as a starting point; (5) train with Detectron2’s DefaultTrainer and export the resulting weights as a .pth checkpoint; and (6) place the checkpoint in the model directory so that VAP2D loads it for the DL method. A step-by-step guide, along with a reference configuration file, is provided in the repository documentation (docs/RETRAINING.md).
VAP2D offers laboratory technicians and researchers a modern, user-friendly, and scientifically robust vascular analysis solution. Its structure, supporting both TIP and DL techniques, is designed to meet the diverse needs of users. This project is a significant step toward translating scientific research into practical applications.
Software architecture
This software is a system for analyzing vascular structures. Users can choose image processing or DL methods to provide a comprehensive analysis process. The software’s architecture is modular, with each module designed to perform a specific function. Figure 1 shows the general workflow of our software.
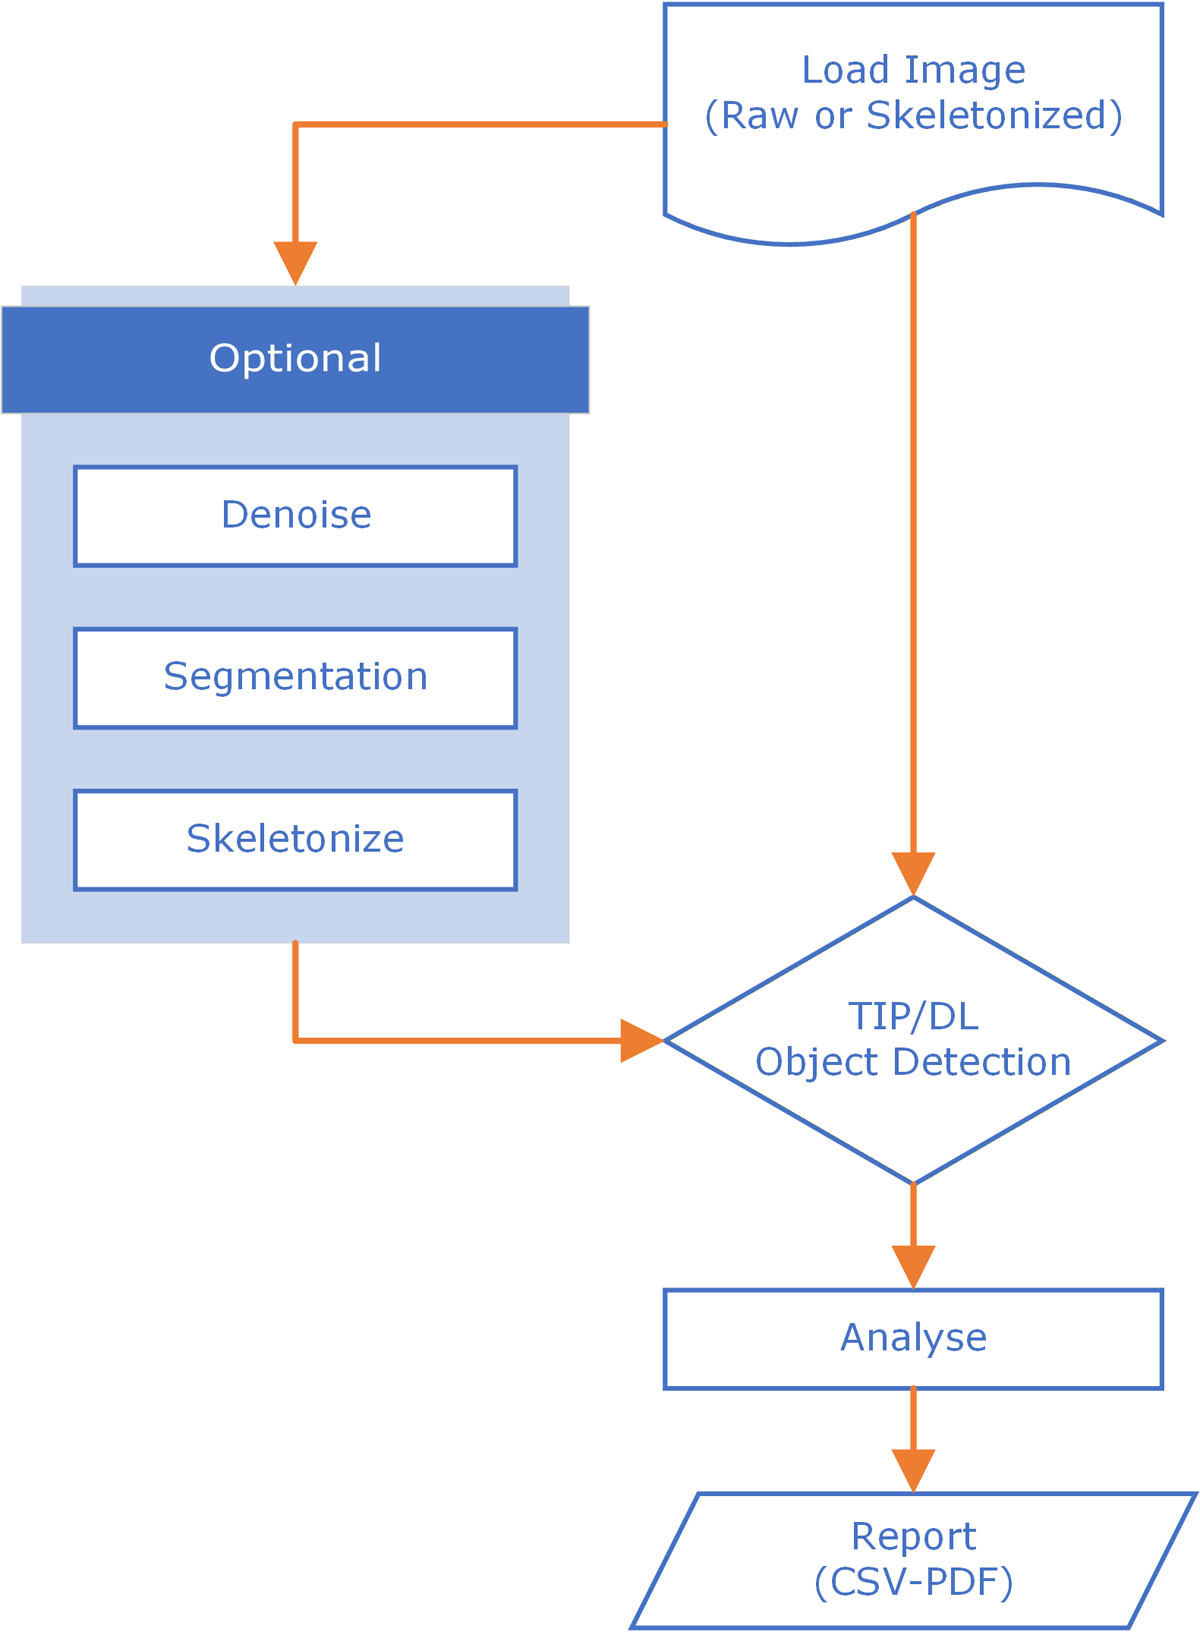
Figure 1
Software general workflow.
General Workflow:
Image Loading: The software initiates the analysis process by loading raw or skeletonized images.
Optional Pre-processing Steps:
– Denoise: Reduces noise and artifacts in the image.
– Segmentation: Enhances and separates vascular structures.
– Skeletonize: Converts vascular structures into their binary skeletal form.
Object Detection: Detects branches and endpoints using TIP or DL methods.
Analysis: Analyzes features of the detected vascular structures, such as finding paths and lengths of veins.
Reporting: Reports the analysis results to the user in CSV or PDF format.
Software functionalities
VAP2D offers a unique, adaptable solution by providing image pre-processing and two object detection methods as options. The software is designed to be customizable according to the user’s needs.
Image pre-processing: The VAP2D pre-processing module incorporates well-known and widely used image processing techniques. However, thanks to its open-source nature, users can modify or enhance these pre-processing steps to suit their specific requirements. For instance, users can integrate their segmentation algorithms to customize the software if the existing segmentation process is deemed insufficient. This flexibility enhances the software’s applicability across various research domains.
Object detection and analysis: Following the pre-processing steps, the analysis begins, and branch points and endpoints are detected using the method selected by the user. To this end, VAP2D offers two algorithms for object detection (TIP and DL). Both algorithms can be easily selected and applied according to user needs. Additionally, the software’s open-source nature allows users to modify or introduce new algorithms.
Visualization and user interaction: VAP2D is capable of robust visualization of analysis results. Its user-friendly interface enables effortless operation via buttons. The analyzed image can visualize details such as branch points, endpoints, vascular pathways, and length information. Users can adjust the visibility of this information as needed, displaying only the required data. This feature enhances the software’s flexibility and user experience.
Customizability and flexibility: VAP2D empowers researchers to customize the software according to their specific needs. Its open-source architecture allows users to modify existing algorithms or introduce new ones. This capability increases the software’s applicability across diverse research fields and applications.
In conclusion, VAP2D is an effective tool in vascular analysis and object detection thanks to its powerful visualization capabilities, flexible analysis options, and customizable structure. The software provides a platform tailored to user needs, streamlining and accelerating research processes.
Quality Control
The reliability and accuracy of VAP2D have been rigorously validated through quantitative evaluation on benchmark datasets and application in peer-reviewed scientific research (7, 8).
Validation dataset: The software was validated using the HFHS13 dataset, comprising 96 2D cerebral vessel images (512 × 512 pixels) obtained from the mouse cortex using confocal microscopy and processed with the 3DISCO tissue clearing procedure. The dataset was divided into 80% for training (76 images) and 20% for testing (20 images).
Ground truth generation: Ground truth annotations were generated using the Hit-or-Miss Transform (HMT) algorithm with 8 spatial filters for endpoint detection and 16 filters for branch point detection. The initial automated annotations were independently verified by two domain experts, with discrepancies discussed and manually corrected to create a high-fidelity ground truth dataset in COCO format with 5 × 5 pixel bounding boxes.
Quantitative evaluation: The object detection performance was evaluated using standard metrics across multiple DL models (7): (1) Faster R-CNN (baseline): AP of 0.903 at IoU = 0.50, Average Recall (AR) of 0.621; (2) Faster R-CNN (optimized): After hyperparameter optimization using Optuna with 50 training runs, achieved AP of 0.989 at IoU=0.50, AP of 0.702 at IoU = 0.75, and AR of 0.802—an improvement of over 9.5% (8); (3) Model comparison: Four models were evaluated (Fast R-CNN, Faster R-CNN, RPN, RetinaNet), with Faster R-CNN selected for optimal performance on small object detection (7).
TIP validation: The TIP detector is a deterministic method based on the Hit-or-Miss Transform, using the same 8 endpoint and 16 branch-point filters described above. Because it is fully deterministic, its detection behavior was validated directly against the expert-verified ground truth: the initial annotations produced by TIP were independently reviewed by two domain experts, and the small number of discrepancies—arising almost exclusively at malformed or broken skeleton segments—were recorded and manually corrected. On well-formed binary skeletons, TIP reproduces the expert-verified branch points and endpoints, and the same morphological operator provides the sub-pixel center localization reported below (median localization error of 0 pixels). TIP, therefore, serves as a validated and reproducible baseline for clean binary inputs, whereas the DL method extends robust detection to noisier or non-binary images. The hybrid approach combines the two so that DL contributes detection robustness while TIP contributes exact localization.
Localization accuracy: A hybrid methodology combining Faster R-CNN detection with HMT-based post-processing achieves pixel-level localization accuracy: precision of 99.44% for endpoints and 99.87% for branch points, with median localization error of 0 pixels and mean error below 1 pixel for matched detections.
Functional testing: The software has been tested on Windows 10/11, Ubuntu 20.04+, and macOS 12+ with Python 3.9+. Installation procedures were verified through Docker containerization and direct installation methods. Inference time is approximately 150 ms per 512 × 512 image on an NVIDIA RTX 3080 GPU.
Reproducibility: Sample input images from the HFHS13 dataset are provided in the Sample_Data/HFHS13/ directory of the repository, enabling users to verify correct installation and reproduce published results.
Illustrative examples
Figure 2 illustrates the process of uploading raw images to the system and the subsequent pre-processing steps. Depending on the characteristics of the uploaded image, each pre-processing function (noise reduction, segmentation, skeletonization) can be applied independently or in combination. This flexible structure allows processing data from different imaging techniques and adapting to various image qualities.
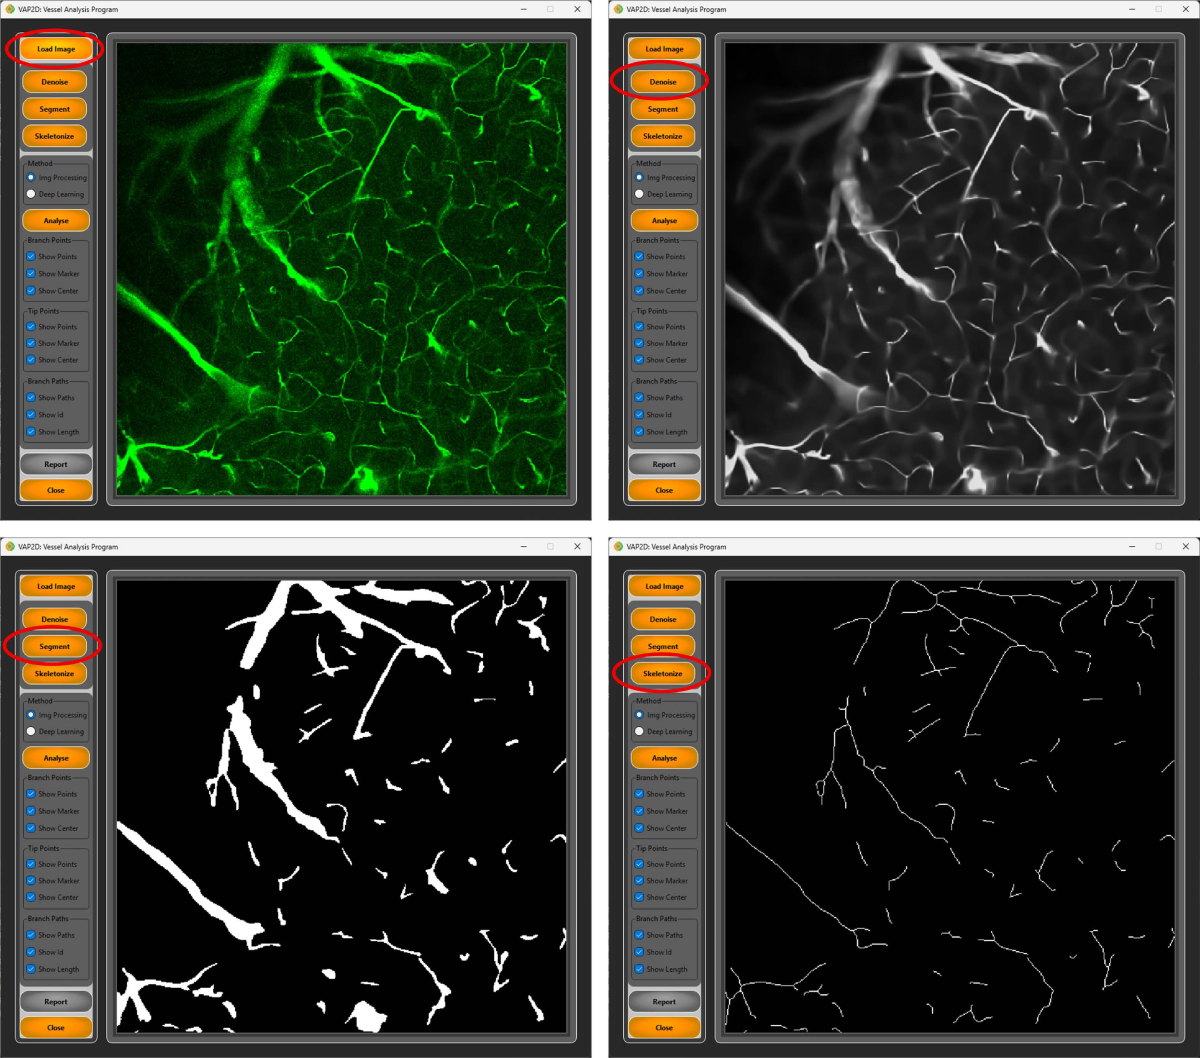
Figure 2
The process of uploading a raw image to the system and the subsequent pre-processing steps, shown left to right and top to bottom: (a) the raw input image as loaded, (b) the result after denoising, (c) the result after segmentation, and (d) the final skeletonized image used for analysis.
Object detection, analysis, and visualization processes are carried out in the next stage, as detailed in the relevant images. The user must select an available object detection method before starting the analysis. These methods include a TIP-based approach and a DL-based model. Once a selection is made, pressing the analysis button triggers the system to detect vessel branching and endpoints according to the chosen method. The detected branching points and endpoints form the basis for converting the vascular network into a data structure. When vessel paths are determined, this data structure automatically includes metric calculations such as length.
All the obtained information (e.g., branching points, vessel paths, length measurements) is visualized on the analyzed image as given in Figure 3. The user can optionally filter the visualized information through the selection boxes in the interface. This feature allows the analysis results to be tailored and interpreted according to the user’s needs. A magnified view of these detected features, showing the precise localization of branch points and endpoints, is given in Figure 4.
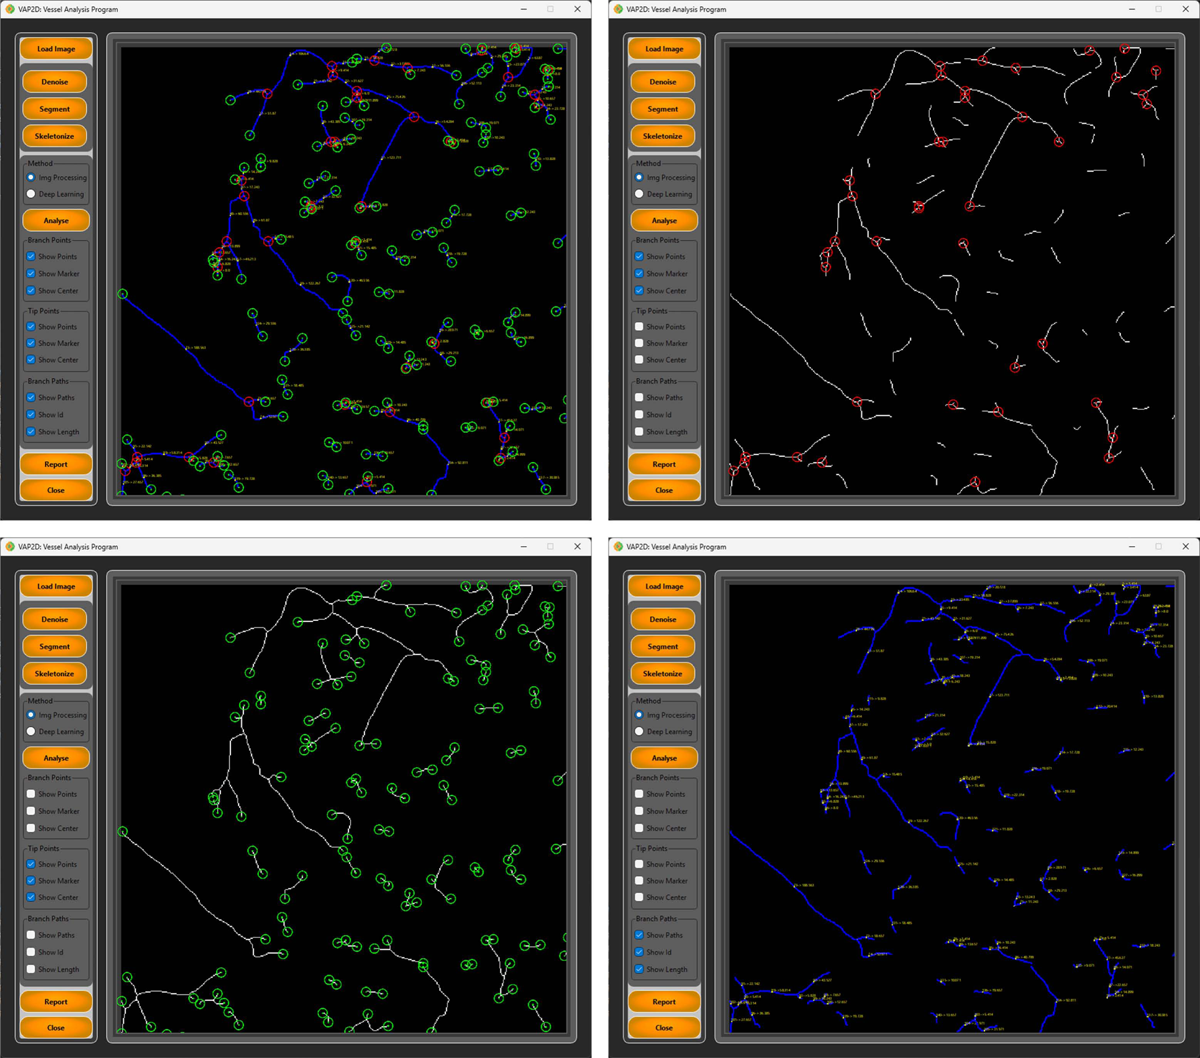
Figure 3
Screenshots of the analysis module showing detected vascular features: branch points (red circles), endpoints (green circles), vessel paths (blue lines), and length measurements (yellow labels). The left panel provides interactive controls to toggle the visibility of each feature type.
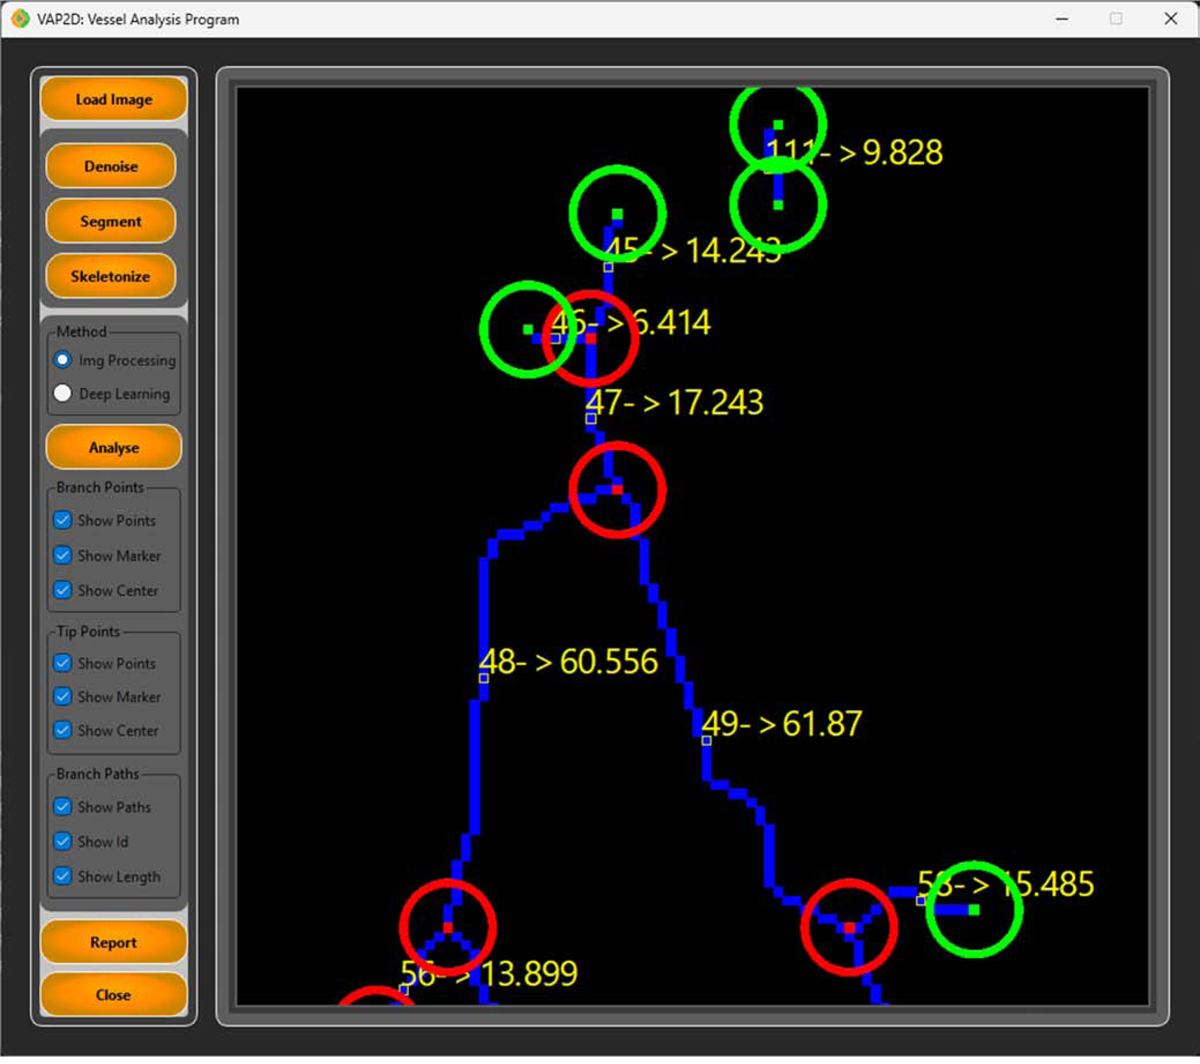
Figure 4
Zoomed-in detail view of the analysis module demonstrating the precise localization of branch points and endpoints. Branch points are indicated by red circles with center markers (small squares), while endpoints are marked with green circles. Yellow labels display branch segment IDs and their corresponding lengths in pixels (e.g., “103 → 24.899” indicates branch segment 103 with length 24.899 pixels).
When the “Report” button is clicked, all the information for the selected file is saved in CSV/PDF format. Additionally, users can view a paginated summary of all the information. Figure 5 shows the report screen.
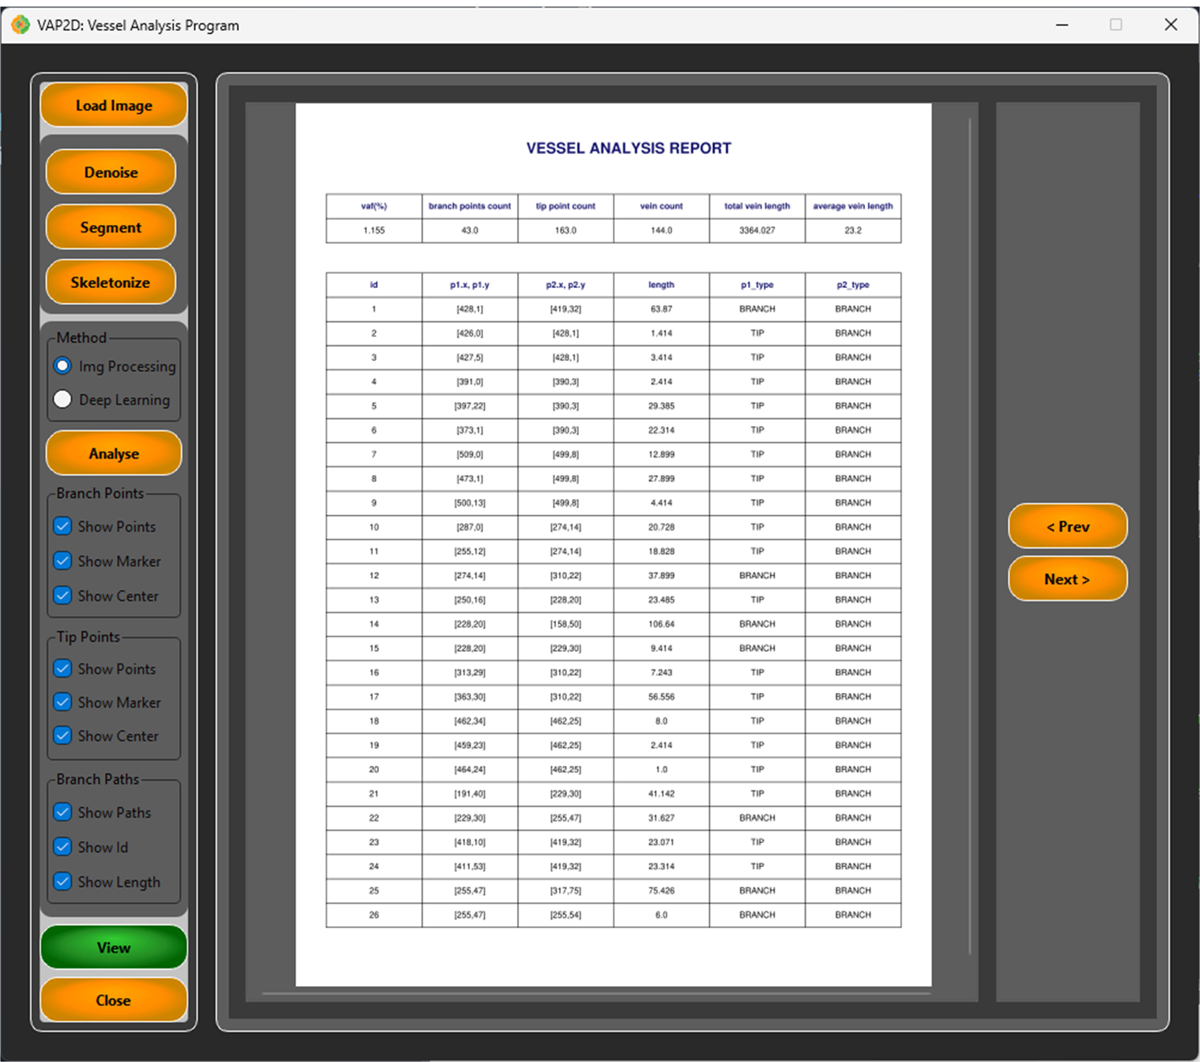
Figure 5
Report Screen.
(2) Availability
Operating system
VAP2D is compatible with Linux (Ubuntu 20.04 or later), Windows 10 or later, and macOS 12 (Monterey) or later.
Programming language
VAP2D is developed in Python 3.9.
Additional System Requirements
A minimum of 4 GB RAM, 500 MB free disk space, and a dual-core processor are recommended. Standard input/output devices (keyboard, mouse, monitor) are sufficient. For DL-based analysis, an NVIDIA GPU with CUDA 11.8 or later is recommended but not required.
Dependencies
numpy < 2; pandas == 2.2.3; scikit-image ≥ 0.25.2; PySide6 == 6.7.3; fpdf == 1.7.2; bm4d == 4.2.5; opencv-python == 4.10.0.84; tabulate == 0.9.0; termcolor == 2.5.0; pycocotools == 2.0.8; fvcore == 0.1.5.post20221221; iopath == 0.1.10; pillow == 11.1.0; tqdm == 4.67.1; packaging == 24.2; cloudpickle == 3.1.1; matplotlib == 3.10.1; torch == 2.0.1; torchvision == 0.15.2; PyYAML == 6.0.2; omegaconf == 2.3.0; pathlib == 1.0.1; scipy == 1.15.2; PyMuPDF ≥ 1.23.0. All dependencies are listed in the requirements.txt file.
List of Contributors
Samet Kaya (Software development, project lead) Department of Computer Engineering, Fatih Sultan Mehmet Vakif University, Istanbul, Turkey Sümeyye Zülal Dik (Software development, testing) Department of Computer Engineering, Fatih Sultan Mehmet Vakif University, Istanbul, Turkey Berna Kiraz (AI and data engineering consultancy) Department of Artificial Intelligence and Data Engineering, Istanbul Technical University, Istanbul, Turkey.
Software location
Archive (e.g., Zenodo, Figshare, institutional repository)
Name: Zenodo
Persistent identifier: https://doi.org/10.5281/zenodo.20787637
Licence: GNU General Public License v3 or later (GPLv3+)
Publisher: Samet Kaya
Version published: v2.4
Date published: 21/06/26
Code repository (e.g. GitHub)
Name: GitHub
Persistent identifier: https://github.com/sametkaya/vap2d
Licence: GNU General Public License v3 or later (GPLv3+)
Date published: 03/08/25
Emulation environment (if appropriate, e.g., DockerHub)
Name: DockerHub
Persistent identifier: https://hub.docker.com/r/sametkaya/vap2d
Licence: GNU General Public License v3 or later (GPLv3+)
Date published: 21/06/26
Language
The software, repository, and supporting files are provided in English. The user interface is in English. Developer documentation and source code include English comments and explanations.
Sample Data
The repository includes the HFHS13 dataset containing 96 cerebral vessel images in TIFF format, located in the Sample_Data/HFHS13/ directory. These 512 × 512 pixel images were obtained from the mouse cortex using confocal microscopy and processed with the 3DISCO tissue clearing procedure. Users can utilize these images to test all software functionalities and reproduce the analysis results presented in this paper and our related publications.
(3) Reuse Potential
VAP2D offers a standardized method for analyzing vascular networks, enabling the automated analysis of parameters such as branching points, endpoints, vessel length, and topological density in 2D vascular skeleton images.
This capability opens new avenues for research inquiry. For instance, studies investigating the relationship between microvariations in retinal vascular density and the progression of diabetic retinopathy, or the histopathological analysis of tumor angiogenesis, can benefit from the metrics generated by the software, thereby contributing to the elucidation of pathophysiological mechanisms.
VAP2D accelerates research processes and enhances accuracy in scenarios where traditional methods are time-consuming and prone to errors. For example, preclinical studies on vascular regeneration allow for the objective evaluation of the effects of experimental therapies. Additionally, by combining DL and TIP techniques, the software provides flexible solutions tailored to different data types and image qualities.
The software features a user-friendly interface and straightforward installation, simplifying and expediting daily analysis workflows for laboratory technicians and researchers. Pre-processing steps such as noise reduction, segmentation, and skeletonization enable users to quickly analyze raw images. Furthermore, exporting analysis results in CSV or PDF facilitates easy data sharing and reporting.
As open-source software, VAP2D caters to a broad user base. Its availability on GitHub makes it easy for users to download and use the software. While different algorithms can be tested and results observed internally, the front end can be further developed. Moreover, the software’s flexible and customizable architecture enhances its applicability across various research domains.
The modular architecture supports several concrete extension points. On the pre-processing side, the default threshold-based segmentation and BM4D denoising can be replaced with learning-based alternatives (e.g., U-Net segmentation) by substituting the corresponding methods in System/ImageOperation.py. On the detection side, the traditional Hit-or-Miss filter bank and the Faster R-CNN model can be replaced with other Detectron2-supported architectures (e.g., RetinaNet, Cascade R-CNN) or retrained on user data using standard Detectron2 workflows. The current CSV/PDF export can be extended to structured formats such as JSON or HDF5 for downstream pipelines, and the computed graph metrics can be passed to network-analysis libraries (e.g., NetworkX) for topological studies. Because the analysis layer operates on standard skeletonized inputs, VAP2D can also be integrated as a quantification back-end behind segmentation tools such as Fiji/ImageJ or napari.
Beyond interactive use, VAP2D’s modular design supports automated and batch workflows. The analysis logic is decoupled from the graphical interface in the System/ layer, so the core routines (pre-processing, TIP/DL detection, vascular-graph construction, and CSV/PDF export) can be imported and driven from a Python script without launching the GUI. A typical batch scenario iterates over a directory of images, applies identical pre-processing and detection settings to each, and writes one report per image—for example, looping over the bundled Sample_Data/HFHS13/ directory to regenerate all metrics non-interactively. This makes the tool straightforward to embed in larger reproducible pipelines: it can be invoked as a quantification step immediately after an upstream segmentation stage, and its tabular CSV output can be aggregated across an entire cohort for downstream statistical analysis. The current release is GUI-first and does not yet ship a dedicated command-line interface or web API; however, because the analysis modules are already separated from the user interface, wrapping them in a thin command-line entry point—or a lightweight REST endpoint for service-oriented deployments—is a small and natural extension, which we identify as a clear direction for high-throughput and headless use. An illustrative batch-processing script is included in the repository documentation.
VAP2D has potential in commercial applications, particularly in medical imaging and biomedical engineering. Its open-source nature enables commercial entities to customize the software according to their needs. Additionally, the software’s modular structure and DL integration may pave the way for the development of new products or spin-off companies.
VAP2D software effectively analyzes vessels and detects objects thanks to its powerful visualization capabilities, flexible analysis options, and customizable structure. It provides a platform tailored to user needs, facilitating and accelerating research processes.
A significant feature of VAP2D is its open-source nature. This allows users to customize the software, modify existing algorithms, or add new ones. Being open-source enables broader use across various research fields and applications. Its availability on GitHub simplifies downloading and encourages developers to contribute. The software supports TIP and DL techniques, offering laboratory technicians and researchers a modern, user-friendly, and scientifically robust solution. Its open-source structure allows users to enhance its functionality by modifying or adding algorithms, increasing its applicability in diverse research areas.
In conclusion, VAP2D provides a reliable platform for vessel analysis in fields such as medical imaging and biomedical engineering. It represents a significant step in translating scientific research into practical applications.
Support and maintenance: User support is primarily provided through the GitHub issue tracker (https://github.com/sametkaya/vap2d/issues), where users can report bugs and request features. To make reports actionable, the repository provides structured issue templates for bug reports and feature requests, and a SUPPORT.md file documents the available support channels, the project’s maintenance policy, and expected response times. The software is actively maintained by the corresponding author, who triages issues and reviews community pull requests. For non-developer users or general inquiries, the corresponding author can also be contacted directly by email ().
Acknowledgements
The authors would like to thank the Fatih Sultan Mehmet Vakıf University Scientific Research Projects (SRP) Unit for their support.